geothermal resource potential of the safford-san simon basin, arizona
geothermal resource potential of the safford-san simon basin, arizona
geothermal resource potential of the safford-san simon basin, arizona

You also want an ePaper? Increase the reach of your titles
YUMPU automatically turns print PDFs into web optimized ePapers that Google loves.
GEOTHERMAL RESOURCE<br />
POTENTIAL OF THE SAFFORD-SAN<br />
SIMON BASIN, ARIZONA<br />
by<br />
James C. Witcher<br />
Arizona Geological Survey<br />
Open-File Report 81-26<br />
Arizona Geological Survey<br />
416 W. Congress, Suite #100, Tucson, Arizona 85701<br />
Funded By The U.S. Department <strong>of</strong>Energy<br />
Contract Number DE-FC07-79ID12009<br />
This report is preliminary and has not been edited<br />
or reviewed for conformity with Arizona Geological Survey standards
NOTICE<br />
This report was prepared to document work sponsored by <strong>the</strong> United States<br />
Government. Nei<strong>the</strong>r <strong>the</strong> United States nor its agents, <strong>the</strong> United States<br />
Department <strong>of</strong> Energy, nor any federal employees, nor any <strong>of</strong> <strong>the</strong>ir contractors,<br />
subcontractors or <strong>the</strong>ir employees, makes any warranty, express or implied, or<br />
assumes any legal liability or responsibility for <strong>the</strong> accuracy, completeness,<br />
or usefulness <strong>of</strong> any information, apparatus, products or process disclosed,<br />
or represents that its use would not infringe privately owned rights.<br />
Reference to a company or product name does not imply approval or recommendation<br />
<strong>of</strong> <strong>the</strong> product by <strong>the</strong> Bureau <strong>of</strong> Geology and Mineral Technology or <strong>the</strong><br />
U.S. Department <strong>of</strong> Energy to <strong>the</strong> exclusion <strong>of</strong> o<strong>the</strong>rs that may be suitable.<br />
i
TABLE OF CONTENTS<br />
PAGE<br />
List Of Figures<br />
List <strong>of</strong> Tables<br />
List 5f Appendices<br />
Introduction<br />
Land Status<br />
Previous Work<br />
Regional Setting<br />
Regional Stratigraphy and Structure<br />
Basement structure <strong>of</strong> <strong>the</strong> nor<strong>the</strong>rn<br />
Safford-San Simon Basin<br />
Basement structure <strong>of</strong> <strong>the</strong> sou<strong>the</strong>rn<br />
Safford San Simon Basin<br />
Basin and Range<br />
Basin-Fill sediments in <strong>the</strong> Safford area<br />
Basin-Fill sediments in <strong>the</strong> San Simon area<br />
Indian Hot Springs-Gila Valley<br />
Buena Vista Area<br />
Introduction<br />
Geochemistry<br />
Structure<br />
Geo<strong>the</strong>rmometry<br />
Conclusion<br />
Introduction<br />
Geochemistry<br />
Geology and Reservoir Characteristics<br />
Cactus Flat-Artesia Area<br />
Geology<br />
Temperature Gradients<br />
Mercury Soil Survey<br />
Ground Water Chemistry and Geo<strong>the</strong>rmometry<br />
Conclusion<br />
1<br />
3<br />
4<br />
6<br />
12<br />
14<br />
19<br />
21<br />
23<br />
27<br />
29<br />
29<br />
29<br />
29<br />
35<br />
35<br />
37<br />
37<br />
37<br />
40<br />
50<br />
50<br />
53<br />
59<br />
61<br />
68<br />
ii
Table <strong>of</strong> Contents (cont'd.)<br />
PAGE<br />
San Simon<br />
69<br />
Bowie Area<br />
Introduction<br />
Thermal Regime<br />
Geology<br />
Geohydrology<br />
Chemistry<br />
Conclusion<br />
Introduction<br />
Geochemistry<br />
Structure and Stratigraphy<br />
Active Tectonism<br />
Conclusion<br />
Whitlock Mountains Area<br />
Tables<br />
Appendices<br />
Bibliography<br />
69<br />
69<br />
71<br />
74<br />
74<br />
77<br />
78<br />
78<br />
78<br />
79<br />
85<br />
86<br />
88<br />
89-10.9<br />
110-120<br />
121-131<br />
iii
FIGURES<br />
FIGURE 1<br />
FIGURE 2<br />
FIGURE 3<br />
FIGURE 4<br />
FIGURE 5<br />
FIGURE 6<br />
FIGURE 7<br />
FIGURE 8<br />
Map <strong>of</strong> <strong>the</strong>rmal wells and springs<br />
Map <strong>of</strong> land status<br />
Location map <strong>of</strong> study area and physiographic<br />
provinces<br />
Regional lineaments and crustal discontinuities<br />
Map <strong>of</strong> inferred Tertiary basement lithology in<br />
sou<strong>the</strong>astern Arizona<br />
Major geologic structure in <strong>the</strong> Safford area<br />
Schlumberger resistivity pr<strong>of</strong>ile near Safford<br />
Map showing areas with low electrical resistivity<br />
and wells which encounter evaporite minerals or<br />
brine<br />
PAGE<br />
(pocket)<br />
(pocket)<br />
7<br />
9<br />
15<br />
30<br />
33<br />
34<br />
FIGURE 9<br />
FIGURE 10<br />
FIGURE 11<br />
FIGURE 12<br />
FIGURE 13<br />
FIGURE 14<br />
FIGURE 15<br />
Map <strong>of</strong> fluoride distribution in <strong>the</strong> Buena Vista<br />
area 38<br />
Dissolved carbon dioxide versus excess silica for<br />
ground water in <strong>the</strong> Buena Vista area 39<br />
Subsurface geology and stratigraphic cross section<br />
<strong>of</strong> <strong>the</strong> hot well area near Buena Vista 41<br />
Reconnais<strong>san</strong>ce geologic map <strong>of</strong> <strong>the</strong> Buena Vista <strong>geo<strong>the</strong>rmal</strong><br />
area 43<br />
Temperature versus depth pr<strong>of</strong>ile <strong>of</strong> deep well east<br />
<strong>of</strong> Buena Vista 47<br />
Complete Bouguer gravity map <strong>of</strong> <strong>the</strong> Buena Vista area<br />
showing areas with copper mineralization 48<br />
Reconnais<strong>san</strong>ce geologic map <strong>of</strong> <strong>the</strong> Cactus Flat-Artesia<br />
area 51<br />
FIGURE 16<br />
FIGURE 17<br />
Bouguer gravity map <strong>of</strong> <strong>the</strong> Safford-San Simon Basin<br />
Aeromagnetic map <strong>of</strong> <strong>the</strong> Safford-San Simon Basin<br />
(pocket)<br />
(pocket)<br />
FIGURE 18<br />
Location map <strong>of</strong> Dipole-Dipole electrical resistivity<br />
pr<strong>of</strong>iles 7 and 8 54<br />
iv
FIGURES<br />
PAGE<br />
FIGURE 19<br />
FIGURE 20<br />
FIGURE 21<br />
FIGURE 22<br />
FIGURE 23<br />
FIGURE 24<br />
FIGURE 25<br />
FIGURE 26<br />
FIGURE 27<br />
FIGURE 28<br />
FIGURE 29<br />
FIGURE 30<br />
Subsurface resistivity models and pseudosections <strong>of</strong><br />
resistivity pr<strong>of</strong>iles 7 and 8 55<br />
Temperature versus depth well data in <strong>the</strong> Cactus<br />
Flat-Artesia area 57<br />
Map showing <strong>the</strong> area <strong>of</strong> high temperature gradients in<br />
<strong>the</strong> Artesia area. 58<br />
Map showing distribution <strong>of</strong> soil mercury in <strong>the</strong> Cactus-<br />
Flat Artesia area 60<br />
Anion ratios versus lithium in Cactus Flat-Artesia area<br />
ground water 62<br />
Dissolved carbon dioxide versus excess silica in Cactus<br />
Flat-Artesia area ground water 66<br />
Temperature versus depth data for artesian wells in <strong>the</strong><br />
San Simon area 70<br />
Structure contour map <strong>of</strong> <strong>the</strong> base <strong>of</strong> <strong>the</strong> blue clay unit<br />
in San Simon area 72<br />
Structure contour map <strong>of</strong> <strong>the</strong> top <strong>of</strong> <strong>the</strong> blue clay unit<br />
in <strong>the</strong> San Simon area 73<br />
Map <strong>of</strong> water level <strong>of</strong> artesian wells in <strong>the</strong> San Simon<br />
area in 1915 75<br />
Estimated temperature gradients <strong>of</strong> artesian wells in <strong>the</strong><br />
San Simon area in 1915, 76<br />
Map showing distribution <strong>of</strong> Na-K-Ca geo<strong>the</strong>rmometer temperatures<br />
in <strong>the</strong> Bowie area 80<br />
FIGURE 31 A gravity subsurface model <strong>of</strong> <strong>the</strong> Bowie area 81<br />
FIGURE 32<br />
Bouguer gravity map <strong>of</strong> Bowie area compared to locations<br />
<strong>of</strong> ground-water falls 82<br />
FIGURE 33 Topographic pr<strong>of</strong>iles across <strong>the</strong> San Simon Valley 83<br />
FIGURE 34 Map <strong>of</strong> water table in <strong>the</strong> Bowie area in 1975 84<br />
v
TABLES<br />
TABLE 1<br />
TABLE 2<br />
2A<br />
2B<br />
2C<br />
2D<br />
2E<br />
2F<br />
TABLE 3<br />
3A<br />
3B<br />
3C<br />
3D<br />
3E<br />
3F<br />
TABLE 4<br />
o<br />
Wells with measured temperatures greater than 30 C in <strong>the</strong><br />
Safford-San Simon Basin, Arizona<br />
Chemical analysis <strong>of</strong> ground waters in <strong>the</strong> Safford-San Simon<br />
area.<br />
Analyses <strong>of</strong> Gila Valley-Indian Hot Springs ground waters<br />
Analyses <strong>of</strong> Buena Vista area ground waters<br />
Analyses <strong>of</strong> Cactus Flat-Artesia area ground waters<br />
Analyses <strong>of</strong> San Simon area ground waters<br />
Analyses <strong>of</strong> Bowie area ground waters<br />
Analyses <strong>of</strong> Whitlock Mountains area ground water<br />
Silica and Na-K-Ca geo<strong>the</strong>rmometers for ground water in <strong>the</strong><br />
Safford-San Simon area.<br />
Geo<strong>the</strong>rmometers for <strong>the</strong> Gila Valley-Indian Hot Springs area.<br />
Geo<strong>the</strong>rmometers for <strong>the</strong> Buena Vista area<br />
Geo<strong>the</strong>rmometers for <strong>the</strong> Cactus Flat-Artesia area<br />
Geo<strong>the</strong>rmometers for <strong>the</strong> San Simon area<br />
Geo<strong>the</strong>rmometers for <strong>the</strong> Bowie area<br />
Geo<strong>the</strong>rmometers for <strong>the</strong> Whitlock Mountains area<br />
Summary table showing aquifers in <strong>the</strong> Cactus Flat area with<br />
temperatures and estimated temperature gradients<br />
P~E<br />
89<br />
94-103<br />
95<br />
96<br />
98<br />
100<br />
WI<br />
W2<br />
103-108<br />
103<br />
W4<br />
105<br />
106<br />
107<br />
W8<br />
109<br />
vi
APPENDICES<br />
APPENDIX 1<br />
APPENDIX 2<br />
APPENDIX 3<br />
Selected:dri11ers logs<br />
pH correction <strong>of</strong> dissolved silica<br />
Arizona Bureau <strong>of</strong> Mines Memorandum on <strong>the</strong> Funk<br />
Benevolent No. 1 Fee well near San Simon<br />
PAGE<br />
110-114<br />
115-118<br />
119-120<br />
vii
INTRODUCTION<br />
o<br />
In <strong>the</strong> Safford-San Simon Basin, <strong>the</strong>rmal water (>30 C)<br />
flows from numerous<br />
artesian wells and springs.<br />
These wells and springs are used by several mineral<br />
baths in <strong>the</strong> Safford area.<br />
The most notable hot water occurrence in <strong>the</strong><br />
area is Indian Hot Springs located northwest <strong>of</strong> Safford near Fort Thomas.<br />
Nearly all wells deeper than 200 meters in <strong>the</strong> Safford area flow naturally<br />
and have discharge temperatures greater than 30 o C.<br />
Deepest <strong>of</strong> <strong>the</strong>se wells,<br />
<strong>the</strong> 1,148 m Underwriters Syndicate #1 Mack oil and gas test or Mary Mack well<br />
near Pima, is indicative <strong>of</strong> a substantial low-temperature <strong>geo<strong>the</strong>rmal</strong> <strong>resource</strong>.<br />
The well is no longer flowing and it is believed that <strong>the</strong> pressurized water<br />
broke through <strong>the</strong> shallow and deteriorated casing after <strong>the</strong> well flow was<br />
temporarily shut-in some years ago. However, in 1933, Knechtel (1938) reports<br />
o<br />
that this well had an artesian flow <strong>of</strong>2,500 gpm <strong>of</strong> 59 C,<br />
sodium chloride water<br />
with 2,251 parts per million (ppm)<br />
total dissolved solids (TDS).<br />
Figure 1 is a map showing <strong>the</strong> location <strong>of</strong> <strong>the</strong> Safford-San Simon area.<br />
Hot springs and areas with hot wells are also shown.<br />
The study area, between<br />
Fort Thomas and San Simon, straddles a valley which is drained by <strong>the</strong> Gila and<br />
San Simon rivers.<br />
The study area is bounded by rugged mountains on <strong>the</strong> southwest<br />
and nor<strong>the</strong>ast sides.<br />
Topography within <strong>the</strong> study area is mostly gentle<br />
and easily accessible.<br />
Agriculture is mostly confined to <strong>the</strong> Gila River flood<br />
plain between Fort Thomas and San Jose, and along Interstate 10 from Bowie to<br />
San Simon.<br />
Important <strong>geo<strong>the</strong>rmal</strong> anomalies occur in all <strong>the</strong>se agricultural<br />
areas.<br />
Communities in <strong>the</strong> area are closely situated to <strong>the</strong> agriculture.<br />
Rising costs and supply problems for hydrocarbon fuels have intensified<br />
<strong>the</strong> need for alternative energy sources.<br />
Developing <strong>the</strong> <strong>potential</strong> <strong>geo<strong>the</strong>rmal</strong><br />
<strong>resource</strong>s in <strong>the</strong> Safford-San Simon <strong>basin</strong> area could reduce energy costs and<br />
assure <strong>the</strong> area <strong>of</strong> a constant energy supply.<br />
Also, new agriculture-related<br />
1
usinesses such as food processing, grain drying or ethanol production using<br />
<strong>geo<strong>the</strong>rmal</strong> energy are possible.<br />
This report summarizes <strong>the</strong> geologic and geohydrologic features important<br />
to <strong>the</strong> <strong>geo<strong>the</strong>rmal</strong> regime <strong>of</strong> <strong>the</strong> Safford-San Simon area.<br />
The purpose <strong>of</strong> <strong>the</strong><br />
investigation is to define areas in <strong>the</strong> Safford-San Simon <strong>basin</strong> that have<br />
<strong>potential</strong> <strong>geo<strong>the</strong>rmal</strong> <strong>resource</strong>s suitable for direct use.<br />
Several things are required to make <strong>geo<strong>the</strong>rmal</strong> energy feasible.<br />
The most<br />
important requirement is <strong>the</strong> availability <strong>of</strong> a suitable <strong>geo<strong>the</strong>rmal</strong> <strong>resource</strong>.<br />
In order to determine <strong>resource</strong> suitability for a particular application,<br />
several questions concerning <strong>the</strong> <strong>potential</strong> <strong>resource</strong> need answering before<br />
planning and development can proceed:<br />
Is <strong>the</strong> <strong>potential</strong> <strong>resource</strong> beneath land<br />
which is favorable for development; or, in o<strong>the</strong>r words, what is <strong>the</strong> land ownership,<br />
topography, and access? What depth is <strong>the</strong> reservoir? What production<br />
temperatures are likely?<br />
What is <strong>the</strong> chemical quality <strong>of</strong> <strong>the</strong> <strong>geo<strong>the</strong>rmal</strong><br />
water?<br />
What are <strong>the</strong> probable reservoir rocks and <strong>the</strong>ir reservoir properties?<br />
What are <strong>the</strong> subsurface geologic controls on <strong>the</strong> permeability and location <strong>of</strong><br />
<strong>the</strong> reservoir?<br />
What is <strong>the</strong> <strong>geo<strong>the</strong>rmal</strong> heat source and <strong>the</strong> natural heat loss<br />
<strong>of</strong> <strong>the</strong> <strong>potential</strong> <strong>resource</strong>?<br />
Direct-use applications may use <strong>geo<strong>the</strong>rmal</strong> water between 30 0 C and l80 0 C.<br />
The chemical quality and production requirements vary depending on <strong>the</strong> type<br />
<strong>of</strong> utilization and heat requirement.<br />
2
Land Status<br />
Figure 2 shows land ownership in <strong>the</strong> Safford-San Simon <strong>basin</strong>, Arizona.<br />
Private or patented lands are found mostly in <strong>the</strong> flood plain <strong>of</strong> <strong>the</strong> Gila<br />
River, in <strong>the</strong> Cactus Flat-Artesia areas, and along Interstate 10 around <strong>the</strong><br />
communities <strong>of</strong> Bowie and San Simon. The U.S. Bureau <strong>of</strong> Land Management (BLM)<br />
administers <strong>the</strong> bulk <strong>of</strong> <strong>the</strong> land in <strong>the</strong> area.<br />
Small tracts <strong>of</strong> state lands are<br />
interspersed with <strong>the</strong> federally owned (BLM) land. Prospective lands with<br />
<strong>potential</strong> for <strong>geo<strong>the</strong>rmal</strong> <strong>resource</strong>s are both private (patented) and federal.<br />
3
Previous Work<br />
Many studies are available which pertain to <strong>the</strong> geology in <strong>the</strong> Safford<br />
San Simon <strong>basin</strong> area. Co~nty geologic maps published by <strong>the</strong> Arizona Bureau<br />
<strong>of</strong> Mines<br />
(Bureau <strong>of</strong> Geology and Mineral Technology) provide generalized<br />
structural and lithologic information on <strong>the</strong> area.<br />
More detailed geologic<br />
information on specific localities within <strong>the</strong> study area are also published.<br />
Cooper (1959) and Cooper (1960) show <strong>the</strong> geology <strong>of</strong> sou<strong>the</strong>astern Cochise<br />
County to include <strong>the</strong> sou<strong>the</strong>rn Safford-San Simon <strong>basin</strong>. Gi11erman (1958)<br />
discusses <strong>the</strong> geology <strong>of</strong> <strong>the</strong> Pe1onci110 Mountains which border <strong>the</strong> east side<br />
<strong>of</strong> <strong>the</strong> Safford-San Simon <strong>basin</strong>, south and east <strong>of</strong> San Simon. Sabins (1957)<br />
and Raydon (1952)<br />
discuss <strong>the</strong> geology and stratigraphy <strong>of</strong> <strong>the</strong> nor<strong>the</strong>rn<br />
Chiricahua Mountains.<br />
Currently <strong>the</strong> U.S. Geological Survey is mapping <strong>the</strong><br />
region in detail as a part <strong>of</strong> <strong>the</strong> Silver City AMS<br />
1:250,000 Conterminous<br />
United States Mineral Appraisal Program (CUSMAP).<br />
Tertiary sediments in <strong>the</strong> Safford area are discussed by Heindl (1958),<br />
Seff (1962), and Harbour (1966), while White (1963)<br />
summarizes <strong>the</strong> Cenozoic<br />
stratigraphy around San Simon.<br />
Cenozoic volcanism and geochronology <strong>of</strong> <strong>the</strong><br />
Safford area is outlined by Berry (1976) and Strangway and o<strong>the</strong>rs (1976).<br />
Deal and o<strong>the</strong>rs (1978) discuss <strong>the</strong> Cenozoic volcanic stratigraphy and volcano-tectonic<br />
features in <strong>the</strong> sou<strong>the</strong>rn Pe1onci11o Mountains.<br />
Extensive ash<br />
flow tuff sheets and an inferred Tertiary cauldron in <strong>the</strong> Chiricahua Mountains<br />
are discussed by Marjaniemi (1968).<br />
Several geophysical surveys covering <strong>the</strong> Safford-San Simon <strong>basin</strong> are<br />
available. Most recently, Wynn and Dansereau (1979) and Wynn (1981) published<br />
complete Bouguer gravity maps <strong>of</strong> <strong>the</strong> Silver City 1:250,000AMS sheet.<br />
These maps <strong>of</strong> <strong>the</strong> study area were done in conjunction with <strong>the</strong> CUSMAP<br />
studies<br />
<strong>of</strong> <strong>the</strong> U.S. Geological Survey.<br />
Aeromagnetic maps <strong>of</strong> <strong>the</strong> Safford-San Simon<br />
4
asin are published in Andreasen and Galot (1966) and Sauck and Sumner (1970).<br />
Geohydrology <strong>of</strong> <strong>the</strong> area is discussed by Schwennesen (1917), Knechtel<br />
(1938) and White (1963). Preliminary studies <strong>of</strong> <strong>the</strong> <strong>geo<strong>the</strong>rmal</strong> <strong>resource</strong><br />
<strong>potential</strong> <strong>of</strong> <strong>the</strong> Safford-San Simon <strong>basin</strong> are in Gerlach and o<strong>the</strong>rs (1975),<br />
Swanberg and o<strong>the</strong>rs (1977), and Witcher (1979).<br />
O<strong>the</strong>r studies pertaining to <strong>the</strong> geology in this area are listed in <strong>the</strong><br />
bibliography at <strong>the</strong> back <strong>of</strong> this report.<br />
5
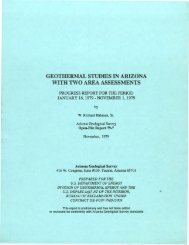
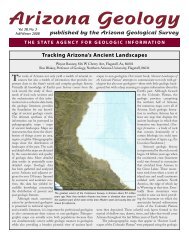
Regional Setting<br />
The Safford-San Simon <strong>basin</strong> lies in <strong>the</strong> Mexican Highland section <strong>of</strong> <strong>the</strong><br />
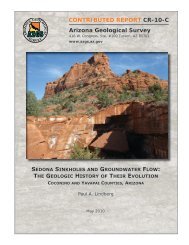
Basin and Range province in sou<strong>the</strong>astern Arizona (Figure 3).<br />
Overall elevation<br />
in <strong>the</strong> Mexican Highland section is high, 941 meters (3,000 feet), relative<br />
to <strong>the</strong> Sonoran section <strong>of</strong> <strong>the</strong> Basin and Range in southwestern Arizona.<br />
Significant topographic relief also characterizes <strong>the</strong> Mexican Highland section.<br />
In <strong>the</strong> Safford-San Simon <strong>basin</strong>, <strong>the</strong> Gila and San Simon Rivers have<br />
aggraded deeply into Pliocene sediments.<br />
The entrenchment <strong>of</strong> <strong>the</strong> streams is<br />
suggestive <strong>of</strong> ei<strong>the</strong>r uplift <strong>of</strong> <strong>the</strong> region relative to <strong>the</strong> Sonoran Desert<br />
section or indicative <strong>of</strong> newly acquired through-flowing status <strong>of</strong> <strong>the</strong> Gila<br />
River into <strong>the</strong> lower Sonoran Desert section <strong>of</strong> southwestern Arizona.<br />
A zone <strong>of</strong> seismicity which traverses Arizona from <strong>the</strong> northwest to sou<strong>the</strong>ast<br />
includes <strong>the</strong> Mexican Highland section (Sumner, 1976).<br />
This seismic<br />
activity may indicate continued tectonism.<br />
Active tectonism is frequently<br />
accompanied by higher crustal heat flow and <strong>geo<strong>the</strong>rmal</strong> phenomenon.<br />
No Quaternary volcanism is identified in <strong>the</strong> Safford-San Simon <strong>basin</strong>.<br />
Basaltic Quaternary volcanism does occur in <strong>the</strong> San Carlos Indian Reservation<br />
northwest <strong>of</strong> <strong>the</strong> study area, in <strong>the</strong> San Bernardino Valley south <strong>of</strong> <strong>the</strong> study<br />
area (Luedke and Smith, 1978) and in <strong>the</strong> Animas Valley, New Mexico,<br />
sou<strong>the</strong>ast<br />
<strong>of</strong> <strong>the</strong> study area (Smith, 1978; Reeder, 1957; Luedke and Smith, 1978).<br />
Conductive heat flow studies <strong>of</strong> <strong>the</strong> region are published by Reiter and<br />
Shearer, 1979. Shearer (1979) gives additional heat flow data in a New<br />
Mexico Institute <strong>of</strong> Mining and Technology Ph.D. ~hesis.<br />
At present,<br />
no heat flow data are available for <strong>the</strong> sou<strong>the</strong>rn Safford-San Simon <strong>basin</strong>.<br />
Reiter and Shearer (1979) used mineral exploration drill holes in <strong>the</strong> Gila<br />
and Peloncillo Mountains to obtain <strong>the</strong>ir heat flow estimates.<br />
Conductive<br />
heat flow in this area ranges between 1.4 HFU and 2.3 HFU with a mean <strong>of</strong><br />
6
114° 112° IIO O 108° 106° 104°<br />
36"<br />
NEVADA<br />
UTAH<br />
ARIZONA<br />
COLORADO PLATEAU PROVINCE<br />
COLORADO<br />
NEW MEXICO<br />
SOUTHER.<br />
/Rcfc0 SpUTH,ERN<br />
MOUNTAINS ROCK'd<br />
I;' / I<br />
PROVINCE '-10UNTAIf'lS<br />
PROVINCE<br />
36°<br />
_FLAGSTAFF<br />
,---' t<br />
---J I I "\. ~"nll"" --r- " f I I'~ SECTION'<br />
I "<br />
- / I<br />
SONORAN -Dl1/'rAllv...... , MOGOLLON DATIL ;,' ~<br />
I , -',<br />
rT'V~/r/..1. ' .... _... I " I I I<br />
SECTION ~ '"---, ......, ;',,' \~LATEAU/fRIO GRANDE \,<br />
PLAINS<br />
PROVINCE<br />
, ,<br />
I (SACRAMENTO I -1:340<br />
BASIN AND RANGE SAFFO~ ""'__'./! RIFT :<br />
PROVINCE"\,~~ : \<br />
MEXICAN HIGHLAND SECTION I ;,...<br />
..., VI/III/IA I :: "<br />
3201- TlIC§ON- } BASIN AND RANGE PROVINCE ~ , ~f\) J -132°<br />
I ,- ----, StUd Y<br />
'4 \ _"':';,---i:-\-,\\-<br />
N n 50 MILES area ,If , ........f \<br />
I<br />
! ' \ ,,\ \ "\ \<br />
114°<br />
112°<br />
\? '------, I<br />
MEXICO ' / I<br />
,<br />
IIOO<br />
108°<br />
Figure 3.<br />
Location map <strong>of</strong> study area and physiographic provinces.<br />
,
+ 1.86 HFU - .33 HFU. The variation in values is most likely due to upward- or<br />
downward-moving water along nearby faults or shear zones<br />
(Reiter and Shearer,<br />
1979). The regional conductive heat flow <strong>of</strong> <strong>the</strong> study area appears normal<br />
for <strong>the</strong> sou<strong>the</strong>rn Basin and Range province.<br />
A poorly understood regional feature with <strong>potential</strong> significance for<br />
<strong>geo<strong>the</strong>rmal</strong> exploration in <strong>the</strong> Safford-San Simon <strong>basin</strong> is <strong>the</strong> "Texas Zone" or<br />
"Texas Lineament" (Schmitt, 1966). Texas Zone will be used in this report<br />
and refers to a west-northwest oriented belt crossing sou<strong>the</strong>rn Arizona through<br />
<strong>the</strong> Basin and Range province.<br />
striking outcrop patterns.<br />
The belt is defined by west-northwest to west<br />
Evidence for major west-northwest basement structural<br />
flaws is circumstantial in most <strong>of</strong> <strong>the</strong> belt. However, in a few areas<br />
major west-northwest oriented faults occur along <strong>the</strong> traces <strong>of</strong> <strong>the</strong> elements<br />
<strong>of</strong> <strong>the</strong> Texas Zone (Lutton, 1958; Titley, 1976; Drewes, 1971; Drewes, 1972;<br />
and Swan, 1976).<br />
These elements or linear discontinuities have been involved<br />
in numerous tectonic and depositional events since Precambrian.<br />
Differential<br />
uplift and left lateral strike slip are documented along portions <strong>of</strong> <strong>the</strong><br />
linear discontinuities. Today, <strong>the</strong> grain <strong>of</strong> <strong>the</strong> Texas Zone is observed in<br />
outcrop patterns that are elongated transversely to present landforms<br />
(Titley,<br />
1976). Titley (1976) states, "The grain is revealed in at least six presently<br />
recognized faults or linear discontinuities which border northwest trending<br />
blocks <strong>of</strong> some 30 to 40 kilometers in width.<br />
Each block bears its own<br />
"signature" by virtue <strong>of</strong> unique stratigraphic relationships and by distinctive<br />
relationships to adjoining blocks."<br />
Figure 4 reproduces Titley's interpretive<br />
map showing <strong>the</strong> Mesozoic stratigraphic and tectonic relationships that<br />
appear as discontinuities or elements <strong>of</strong> <strong>the</strong> Texas Zone.<br />
The Texas Zone<br />
linear discontinuities may have an origin during Precambrian; and <strong>the</strong>y may be<br />
fundamental flaws in <strong>the</strong> crust <strong>of</strong> sou<strong>the</strong>rn Arizona.<br />
The Texas Zone discon-<br />
8
I.D<br />
". ".<br />
'.<br />
".<br />
..... ",/"<br />
'.<br />
~~~<br />
~,~~~ y<br />
0"Y<br />
~..~1- ",/<br />
':)~~.,/"<br />
//<br />
~<br />
.,/<br />
SCALE 148kilometers,<br />
3Om/7es<br />
~~ ,/<br />
~/"<br />
~~~/<br />
GLE~WOOD \,'5:/<br />
v',-<br />
~
tinuities appear to correlate with late Paleozoic and Mesozoic tectonic and<br />
sedimentation patterns in sou<strong>the</strong>rn Arizona (Elston, 1958; McKee, 1951;<br />
Peirce, 1976; Ross, 1973).<br />
In <strong>the</strong> Safford-San Simon <strong>basin</strong>, two linear discontinuities are interpreted<br />
to cross <strong>the</strong> study area.<br />
The nor<strong>the</strong>rn element coincides with <strong>the</strong><br />
south-facing escarpment <strong>of</strong> <strong>the</strong> Gila Mountains.<br />
This nor<strong>the</strong>rn element contains<br />
a northwest-striking array <strong>of</strong> Laramide porphyry copper ore bodies and prospects<br />
in <strong>the</strong> Gila Mountains and Peloncillo Mountains to include <strong>the</strong> Phelps<br />
Dodge, Kennecott, San Juan and Sanchez ore bodies in <strong>the</strong> Gila Mountains and<br />
<strong>the</strong> Sol and Slick Rock <strong>basin</strong> prospects in <strong>the</strong> nor<strong>the</strong>rn Peloncillo Mountains.<br />
Ano<strong>the</strong>r apparent Texas Zone discontinuity crosses <strong>the</strong> study area from Stockton<br />
Pass in <strong>the</strong> Pinaleno Mountains to Granite Gap in <strong>the</strong> Peloncillo Mountains.<br />
A major west-northwest oriented fault zone with Precambrian left-lateral<br />
strike-slip traverses <strong>the</strong> Stockton Pass area (Swan, 1976).<br />
In <strong>the</strong> San Simon<br />
area, <strong>the</strong> sou<strong>the</strong>rn boundary <strong>of</strong> a Pliocene-late Miocene depositional <strong>basin</strong> is<br />
on strike with this element.<br />
The depositional <strong>basin</strong> is interpreted<br />
from drillers' logs and will be discussed in detail in <strong>the</strong> discussion <strong>of</strong> <strong>the</strong><br />
<strong>geo<strong>the</strong>rmal</strong> <strong>potential</strong> <strong>of</strong> <strong>the</strong> San Simon area.<br />
At Granite Gap near <strong>the</strong> Arizona<br />
New Mexico border a structurally high exposure <strong>of</strong> pre-Tertiary rocks documents<br />
ano<strong>the</strong>r major northwest-oriented fault zone, which is also on strike with <strong>the</strong><br />
Stockton Pass zone (Gillerman, 1958; Armstrong and Silberman, 1974; and<br />
Drewes and Thorman, 1978).<br />
A major nor<strong>the</strong>ast-striking feature, <strong>the</strong> Morenci lineament, crosses <strong>the</strong><br />
nor<strong>the</strong>rn Safford-San Simon <strong>basin</strong>.<br />
The Gila River east <strong>of</strong> Safford defines<br />
<strong>the</strong> lineament where it cuts through <strong>the</strong> nor<strong>the</strong>rn Peloncillo Mountains in <strong>the</strong><br />
Gila Box.<br />
<strong>the</strong> range.<br />
The lineament crosses <strong>the</strong> Pinaleno Mountains at <strong>the</strong> "dog leg" in<br />
Several very prominent canyons oriented nor<strong>the</strong>ast drain <strong>the</strong> east<br />
10
side <strong>of</strong> <strong>the</strong> mountains and coincide with shear zones mapped by Thorman<br />
1981. These shear zones may be elements <strong>of</strong> <strong>the</strong> Morenci lineament. The<br />
Morenci lineament appears to be a highly useful exploration concept for <strong>geo<strong>the</strong>rmal</strong><br />
<strong>resource</strong>s because every hot spring with a temperature greater than<br />
40 0 C in sou<strong>the</strong>astern Arizona occurs within 20 kilometers <strong>of</strong> <strong>the</strong> median <strong>of</strong> <strong>the</strong><br />
lineament trace. Chapin and o<strong>the</strong>rs (1978) first defined <strong>the</strong> lineament in a<br />
<strong>geo<strong>the</strong>rmal</strong> and geologic context where it crosses <strong>the</strong> Rio Grande rift in New<br />
Mexico.<br />
The Morenci lineament may be a major crustal flaw.<br />
The significance <strong>of</strong> <strong>the</strong> Texas Zone and Morenci lineaments for <strong>geo<strong>the</strong>rmal</strong><br />
<strong>resource</strong> exploration is important even though <strong>the</strong>se lineaments are based on<br />
highly diverse and sometimes sparse geologic data, which can be related in a<br />
genetic sense using a somewhat speculative concept--major crustal flaw(s),<br />
which localize and intensify faulting and plutonism.<br />
Because highly fractured<br />
rock and deep-seated zones allowing magmatic intrusion or deep circulation<br />
<strong>of</strong> water is <strong>of</strong> prime importance in <strong>the</strong> localization <strong>of</strong> <strong>geo<strong>the</strong>rmal</strong> systems,<br />
regional delineation <strong>of</strong> <strong>potential</strong> zones <strong>of</strong> highly fractured rock is<br />
useful in <strong>the</strong> evaluation and interpretation <strong>of</strong> known shallow <strong>geo<strong>the</strong>rmal</strong> manifestations,<br />
and exploration for deeper hidden <strong>geo<strong>the</strong>rmal</strong> systems.<br />
11
Regional Stratigraphy and Structure<br />
Several superimposed depositional, erosional and tectonic events have<br />
combined to create a favorable geologic setting for low-to-intermediate temperature<br />
<strong>geo<strong>the</strong>rmal</strong> reservoirs and convective systems in <strong>the</strong> Safford-San Simon<br />
<strong>basin</strong>.<br />
Faulting is capable <strong>of</strong> creating good vertical permeability for deep circulation<br />
<strong>of</strong> water.<br />
Also, high-angle faults may displace permeable rocks to<br />
sufficient depth for significant heating by normal heat flow from <strong>the</strong> earth's<br />
interior.<br />
Low-angle faults may displace impermeable rock over permeable rock<br />
creating a "structural trap" reservoir.<br />
In addition, low-angle faults in<br />
Arizona are frequently characterized by impermeable zones at or near <strong>the</strong><br />
fault plane.<br />
These zones may overlie fractured and permeable rock.<br />
Rock geometries resulting from tectonic movement,<br />
post and syntectonic<br />
sediment deposition, and erosion may create favorable combinations <strong>of</strong> <strong>potential</strong><br />
reservoir rocks and cap rocks to form "stratigraphic traps".<br />
Similar<br />
traps may also evolve during volcanism where episodic and changing styles<br />
and compositions <strong>of</strong> volcanic eruptions result in mud flows and impermeable<br />
tuff overlying permeable volcanic sequences such as fractured basaltic flows<br />
and fractured welded tuffs.<br />
Impermeable "cap rocks" are as important as <strong>the</strong> occurrence <strong>of</strong> permeable<br />
rock.<br />
With a cap rock or aquiclude, <strong>the</strong> temperature <strong>of</strong> a deep reservoir will<br />
remain high because leakage out <strong>of</strong> <strong>the</strong> reservoir will occur only along vertical<br />
fracture zones or faults in limited flows, thus conserving heat.<br />
Deeply penetrating zones <strong>of</strong> fractured rock in <strong>the</strong> Precambrian basement<br />
may exist in <strong>the</strong> area.<br />
The hypo<strong>the</strong>sized regional crustal discontinuities<br />
<strong>of</strong> <strong>the</strong> Texas Zone and <strong>the</strong> Morenci lineament are possibly due to fault reactivation<br />
and plutonism <strong>of</strong> major Precambrian structures.<br />
Present-day regional<br />
12
stress fields may dilate some <strong>of</strong> <strong>the</strong>se structures where <strong>the</strong>y are oriented<br />
favorably.<br />
The Morenci lineament direction correlates with <strong>the</strong> nor<strong>the</strong>ast direction<br />
<strong>of</strong> major Precambrian structures in Arizona.<br />
Oldest <strong>of</strong> <strong>the</strong> Precambrian rocks,<br />
<strong>the</strong> Pinal Schist, is believed to represent major nor<strong>the</strong>ast-trending regional<br />
structural deformation (Silver, 1978).<br />
Near <strong>the</strong> trace <strong>of</strong> <strong>the</strong> Morenci lineament<br />
in northwest Cochise County, <strong>the</strong> Pinal Schist is highly deformed and forms<br />
a large (40 km) wide "anticlinorium" exhibiting strongly overturned folds<br />
(Silver, 1978).<br />
Pinal Schist.<br />
Precambrian granite and granodiorite plutons intrude <strong>the</strong><br />
Similar intense deformation is seen in <strong>the</strong> crystalline rock<br />
<strong>of</strong> <strong>the</strong> Pinaleno Mountains.<br />
It should be noted, however, that <strong>the</strong> Pinaleno<br />
Mountains are a part <strong>of</strong> a Tertiary "metamorphic core complex" which overprints<br />
<strong>the</strong> Precambrian deformation (Davis and Coney, 1979).<br />
In <strong>the</strong> Stockton Pass area, Swan (1976) presents geochronologic data<br />
that suggests that <strong>the</strong> Texas Zone features originated between 1,400 m.y.<br />
and 1,200 m.y.<br />
In Stockton Pass, Swan (1976) maps a wide zone <strong>of</strong> west-northwest<br />
trending faults which left-laterally displace Precambrian diabase intrusions<br />
in granitic plutonst<br />
Due to tectonic reactivation after 1100 m.y.<br />
Paleozoic rocks are not believed to be widely present in <strong>the</strong> subsurface<br />
in <strong>the</strong> Safford-San Simon <strong>basin</strong> because erosion, subsequent to Mesozoic and<br />
Tertiary tectonism, has probably removed <strong>the</strong>se rocks, although isolated and<br />
incomplete sections <strong>of</strong> Paleuzoic rocks may occur.<br />
Zenoliths <strong>of</strong> quartzite<br />
(Cambrian-Ordovician Coronado Sandstone?) are observed in Laramide intrusions<br />
in <strong>the</strong> Gila Mountains (Dunn, 1978). East <strong>of</strong> <strong>the</strong> study area, a Mesozoic uplift<br />
is centered in <strong>the</strong> Burro Mountains, New Mexico.<br />
Elston (1958) names<br />
this post-Permian, pre-late-Cretaceous feature, <strong>the</strong> Burro uplift.<br />
North <strong>of</strong><br />
Burro uplift progressively older Paleozoic rocks are observed in outcrop as<br />
13
<strong>the</strong> uplift is approached. Late Cretaceous sediments are observed unconformably<br />
overlapping both <strong>the</strong> Precambrian rocks on <strong>the</strong> uplift and Paleozoic rocks<br />
on <strong>the</strong> uplift margins.<br />
Due to <strong>the</strong> widespread cover to Tertiary sediment and<br />
volcanic rocks, <strong>the</strong> actual extent <strong>of</strong> <strong>the</strong> uplift is not known with certainty.<br />
It is believed <strong>the</strong> uplift trends west-northwest in conformance with <strong>the</strong> trend<br />
<strong>of</strong> Mesozoic sedimentation patterns and tectonic features inferred to comprise<br />
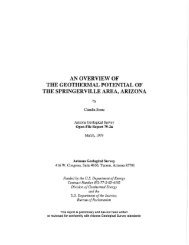
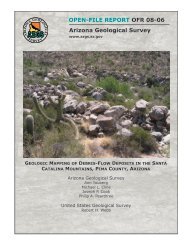
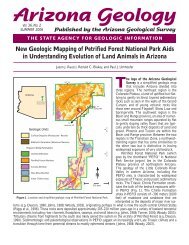
elements <strong>of</strong> <strong>the</strong> Texas Zone. Figure 5 is a generalized map <strong>of</strong> <strong>the</strong> Tertiary<br />
basement in sou<strong>the</strong>ast Arizona and southwestern New Mexico.<br />
Inspection <strong>of</strong><br />
<strong>the</strong> map shows that <strong>the</strong> Pinaleno Mountains may be part <strong>of</strong> a western extension<br />
<strong>of</strong> <strong>the</strong> Burro uplift. However, this is not certain because <strong>the</strong> Pinaleno Mountains<br />
are not known to expose late Cretaceous sediment unconformably overlying<br />
Precambrian granite. Tertiary low-angle faulting may have tectonically removed<br />
<strong>the</strong> Paleozoic rocks since <strong>the</strong> Pinaleno Mountains are a Tertiary "metamorphic<br />
core complex" (Davis and Coney, 1979). The <strong>geo<strong>the</strong>rmal</strong> implications<br />
and description <strong>of</strong> "metamorphic core complex" are discussed later in this<br />
section.<br />
Basement Structure <strong>of</strong> <strong>the</strong> Nor<strong>the</strong>rn Safford-San Simon Basin<br />
The "Laramide" orogeny, 75 m.y. to 50 m.y., involved uplift, volcanism,<br />
intense compressive deformation and plutonism in that order (Coney, 1978;<br />
Shafiqullah and o<strong>the</strong>rs, 1980).<br />
In <strong>the</strong> nor<strong>the</strong>rn Safford-San Simon Basin area,<br />
<strong>the</strong> "Laramide" orogeny is recorded in <strong>the</strong> Gila Mountains.<br />
Andesite and felsic<br />
tuff is intruded by small silicic to intermediate composition stocks, which<br />
are associated with local porphyry copper deposits.<br />
These volcanic and intrusive<br />
rocks range in age from 53 to 58 m.y.<br />
(Dunn, 1978; Robinson and Cook,<br />
1966; and Livingston and o<strong>the</strong>rs, 1968). Intense shear zones and dike swarms<br />
trending nor<strong>the</strong>ast transect <strong>the</strong>se rocks and <strong>the</strong>y are frequently highly altered<br />
and mineralized.<br />
Drill holes up to 4,000 feet have failed to reach <strong>the</strong><br />
14
I-'<br />
Ln<br />
!' .. ","<br />
"" ,,...<br />
P.c<br />
Tucson o<br />
-l!W 134<br />
0<br />
+\I<br />
I<br />
I<br />
I<br />
I<br />
I<br />
I<br />
I<br />
'........ ,J ,_,<br />
...........__41' / I " ...<br />
+<br />
.'<br />
-.l.!!00<br />
134 0 _Jl09°<br />
134°<br />
o<br />
()<br />
.;c<br />
I ~<br />
, ------~'-,,- ...._-- ~<br />
• " ......... 4J<br />
" ...., '..\...... "" Pz+Mz+P~ C0 z<br />
------ ','.... 0<br />
" \ '.. .!::f<br />
"'-,<br />
, "<br />
'--...... \.<br />
~.. \<br />
, ..<br />
,)Mcc ",,<br />
'--, I<br />
' ...._--<br />
" I<br />
'\ '\ '......... -4<br />
""._~' '..... .........,... Clifton<br />
'. \... ... ...... , +<br />
', ....., '-.... ..........<br />
'l'<br />
"", -.........,<br />
I +<br />
" I I~... "'''', ........ _ ...,<br />
.. " Safford...... K+ P-e ""'---~ Silver City<br />
: ",' \ 0 ' .., - .............<br />
(r.... -----.......', " 0<br />
........ '-', "<br />
\ ..., '. ......~-, ",<br />
' \ Mee· "'" "<br />
'.. '---," -... --- ... _-~--- .....,<br />
\ \ \ ...-.....- -....<br />
.. \ '. ...,'...... "'-- ...<br />
-34°<br />
...- ...,------ '-••-- -"-~,<br />
+Pz+Mz+P-e<br />
... ?<br />
...<br />
+<br />
P~<br />
pz<br />
Mz<br />
K<br />
LI<br />
Mcc<br />
-33 0<br />
-32°<br />
lEGEND<br />
Precambrian rock undifferentiated<br />
Paleozoic rock undifferentiated<br />
Mesozic rock undifferentiated<br />
Cretaceous sediment or<br />
"Laramide" Intrusive<br />
\ ...........: P-e "_..... ...' ......,<br />
'.. ".' ??? ""'- ......,,'?<br />
'.. . .' "'---- '.<br />
" '--',<br />
..._----"' ....~-, ------, .-.---- ........._--<br />
"-~<br />
Tertiary "Metamorphic<br />
complex"<br />
?<br />
?<br />
volcanics<br />
core<br />
~IiZed Mop <strong>of</strong> Tertiary Basement Sou<strong>the</strong>astern jrlZono.<br />
I I I<br />
111° 110 0 109°<br />
I<br />
,46kilometers I<br />
30 miles<br />
N<br />
-f-<br />
Figure 5.<br />
Map <strong>of</strong> inferred Tertiary basement lithology in<br />
sou<strong>the</strong>astern, Arizona.
ase <strong>of</strong> <strong>the</strong> "Laramide" andesites (Dunn, 1978). Dunn (1978) states that part<br />
<strong>of</strong> <strong>the</strong> andesite may be a hypabyssal intrusive based upon an apparent gradational<br />
contact with diorite intrusions and <strong>the</strong> lack <strong>of</strong> flow or bedding structure<br />
in <strong>the</strong> andesite.<br />
In any case <strong>the</strong>se fractured intrusions and extrusive<br />
rocks penetrate deeply into <strong>the</strong> crust.<br />
Reservoirs in Precambrian, Mesozoic and Paleocene rocks will occur only<br />
in fault and shear zones where <strong>the</strong>se rocks are shattered and permeable.<br />
If<br />
<strong>the</strong> shear zones exist in <strong>the</strong> Precambrian rocks, <strong>the</strong> Pinaleno Mountains are a<br />
<strong>potential</strong> recharge area at high elevation, which could cause significant<br />
forced convective flows <strong>of</strong> water in <strong>the</strong> nor<strong>the</strong>rn and central Safford-San Simon<br />
<strong>basin</strong>.<br />
Post "Laramide" geologic history <strong>of</strong> <strong>the</strong> nor<strong>the</strong>rn and central Safford<br />
San Simon <strong>basin</strong> began with a period <strong>of</strong> erosion during Eocene.<br />
During this<br />
time, most <strong>of</strong> <strong>the</strong> late Cretaceous and Paleocene sediments and volcanic rocks<br />
were stripped from <strong>the</strong> surface.<br />
Following Eocene erosion, basaltic andesite volcanism began in <strong>the</strong> area.<br />
The best studied sequence in .<strong>the</strong> Gila Mountains is probably representative<br />
<strong>of</strong> <strong>the</strong> volcanism in <strong>the</strong> nor<strong>the</strong>rn Peloncillo Mountains and sou<strong>the</strong>rn Pinaleno<br />
Mountains. Strangway and o<strong>the</strong>rs (1976) report 30.2 to 28.8 m.y. K-Ar dates<br />
for a reddish brown basaltic andesite unconformably overlying <strong>the</strong> Laramide<br />
andesite.<br />
This basal basaltic andesite exhibits amygda1oida1 texture and is<br />
in flows one to two meters thick. Flow brecias are very common. Following<br />
<strong>the</strong> lower basaltic andesite extrusion, rhyolites and 1atites were extruded.<br />
One center <strong>of</strong> rhyo1ite/1atite volcanism was located in <strong>the</strong> area north<br />
<strong>of</strong> Bryce Mountain and Weber Peak.<br />
A large rhyo1ite/1atite dome complex is<br />
present (D. Richter, pers. comm.). Phenocrysts are rare in <strong>the</strong>se rocks and<br />
in many areas <strong>the</strong>y are extensively autobrecciated.<br />
16
The upper basaltic andesite, overlying <strong>the</strong> rhyolite/latite flows in <strong>the</strong><br />
Gila Mountains, is dark gray and occurs in massive flows two to five meters<br />
thick. These rocks are considered equivalent to <strong>the</strong> 20-25 m.y. Bearwallow .<br />
Mountain basaltic andesites <strong>of</strong> Elston and o<strong>the</strong>rs (1973).<br />
Contemporaneous with<br />
this basaltic andesite volcanism, a large rhyolite/latite dome was extruded<br />
in Tollgate Canyon <strong>of</strong> <strong>the</strong> nor<strong>the</strong>rn Peloncillo Mountains ,(D. Richter, pers.<br />
comm.).<br />
Thin unwelded tuffs from this center <strong>of</strong> silicic volcanism are<br />
quarried for cinder.<br />
O<strong>the</strong>r centers <strong>of</strong> silicic volcanism are identified at Dry Mountain in <strong>the</strong><br />
Whitlock Mountains and in <strong>the</strong> Peloncillo Mountains nor<strong>the</strong>ast <strong>of</strong> San Simon.<br />
No thick, extensive sequences <strong>of</strong> welded ash flow tuff are identified in <strong>the</strong><br />
nor<strong>the</strong>rn and central areas <strong>of</strong> <strong>the</strong> Safford-San Simon Basin; <strong>the</strong>refore, no<br />
large Tertiary, cauldron subsidence features are believed to be present.<br />
Also, no thick sequences <strong>of</strong> clastic sediment are interbedded in <strong>the</strong> mid-Tertiary<br />
volcanic sequence that crops out in <strong>the</strong> mountains bordering nor<strong>the</strong>rn<br />
and central portions <strong>of</strong> <strong>the</strong> Safford-San Simon <strong>basin</strong>.<br />
On <strong>the</strong> whole, <strong>the</strong> volcanic<br />
rocks in <strong>the</strong> Gila and Peloncillo mountains dip gently nor<strong>the</strong>ast and have<br />
a total thickness between 0.6 and 1.2 km.<br />
During and after <strong>the</strong> mid-Tertiary volcanism, <strong>the</strong> Pinaleno Mountains "metamorphic<br />
core complex" probably evolved.<br />
"Metamorphic core complexes" may<br />
have formed as a result <strong>of</strong> regional strain, "<strong>the</strong>rmal perturbation, and tectonic<br />
denudation" (Davis and Coney, 1979).<br />
Studies show that core complexes in<br />
sou<strong>the</strong>rn Arizona have a four-element morphology (Davis and Coney, 1979):<br />
(1) unmetamorphosed cover rocks are deformed by listric normal faulting, overturned<br />
folds, and bedding plane faults; (2)<br />
a low-angle decollement zone <strong>of</strong><br />
erosionally resistant, and frequently chlorititized, mylonitic breccia, mylonite,<br />
and microbreccia separates <strong>the</strong> cover rocks from <strong>the</strong> metamorphic carapace;<br />
17
(3) a metamorphic carapace displaying highly attenuated greenschist to amphibolite<br />
grade metamorphosed younger Precambrian and Phanerozoic rocks with<br />
"tight iso~linal<br />
recumbent-to-overturned intrafolial folds, axial plane<br />
cleavage, boudins, pinch and swell, flattened and stretched pebble metaconglomerate,<br />
lineation and ductile faults" all concordantly plated to <strong>the</strong> core<br />
rocks; (4) a core <strong>of</strong> augen gneiss (granitic plutons with sheets <strong>of</strong> mylonitic<br />
rocks or cataclastically deformed metasedimentary and metavolcanic rocks<br />
(Pinal schist) intruded lit-par-lit by deformed granite or pegmatite layers<br />
(Davis and Coney, 1979).<br />
Core rocks contain low-dipping cataclastic foliation<br />
and a pervasive and systematically aligned mineral and slickenside lineation<br />
with a low dip (Davis and Coney, 1979).<br />
Isotope studies <strong>of</strong> <strong>the</strong> pre<br />
Tertiary intrusives <strong>of</strong> <strong>the</strong> Catalina metamorphic complex near Tucson reveal<br />
partially or completely reset isotope geochronologic clocks (Damon and o<strong>the</strong>rs,<br />
1963; and Shafiqullah and o<strong>the</strong>rs, 1978). Significant <strong>the</strong>rmal perturbation<br />
during mid-Tertiary reset <strong>the</strong> isotope ratios.<br />
This coincides in time with<br />
<strong>the</strong> voluminous eruption <strong>of</strong> volcanic tuffs and lavas in sou<strong>the</strong>rn Arizona.<br />
These volcanic rocks and contemporaneous clastic rocks and underlying Phanerozoic<br />
rocks comprise" <strong>the</strong> listrically, normal-faulted cover rocks that are allochthonous<br />
on <strong>the</strong> core-complex decollement zones.<br />
A probable decollement<br />
zone and deformed cover rocks are mapped by Blacet and Miller (1978) on <strong>the</strong><br />
west end <strong>of</strong> <strong>the</strong> Pinaleno Mountains.<br />
At this location, Tertiary volcanic<br />
rocks and mostly volcano-clastic sediment are steeply dipping sou<strong>the</strong>ast and<br />
are separated from <strong>the</strong> gneiss by a low-angle fault or decollement zone.<br />
Steeply dipping and listric, normal-faulted Tertiary volcanic rocks and<br />
possibly "Laramide volcanic" rocks overlie an inferred decollement in <strong>the</strong><br />
basement <strong>of</strong> <strong>the</strong> Safford-San Simon <strong>basin</strong> on <strong>the</strong> eastern and nor<strong>the</strong>rn flanks<br />
<strong>of</strong> <strong>the</strong> Pinaleno Mountains.<br />
If faulted and fractured "cover rocks" occur<br />
18
over an inferred decollement in <strong>the</strong> basement <strong>of</strong> <strong>the</strong> Safford <strong>basin</strong>, <strong>the</strong>y may<br />
have significant permeability and have significant <strong>geo<strong>the</strong>rmal</strong> reservoir<br />
<strong>potential</strong>.<br />
Basement Structure <strong>of</strong> <strong>the</strong> Sou<strong>the</strong>rn Safford-San Simon Basin<br />
The basement stratigraphy and structure in <strong>the</strong> sou<strong>the</strong>rn Safford-San<br />
Simon <strong>basin</strong> has a different character than <strong>the</strong> basement <strong>of</strong> <strong>the</strong> central and<br />
nor<strong>the</strong>rn portions <strong>of</strong> <strong>the</strong> <strong>basin</strong>.<br />
Outcrops in <strong>the</strong> Dos Cabezas and Chiricahua<br />
Mountains reveal a more varied stratigraphy than is observed in <strong>the</strong> Pinaleno<br />
Mountains or Gila Hountains.<br />
Two structural terranes typify <strong>the</strong> nor<strong>the</strong>rn Chiricahua Mountains (Sabins,<br />
1957; and Drewes, 1976). The nor<strong>the</strong>rn terrane appears in situ or autochthonous.<br />
The o<strong>the</strong>r terrane is allochthonous and is thrust over <strong>the</strong> nor<strong>the</strong>rn<br />
autochthon.<br />
An early Cretaceous gravel, <strong>the</strong> Glance Conglomerate, unconformably<br />
overlies Paleozoic rocks on <strong>the</strong> autochthonous block (Sabins, 1957).<br />
West <strong>of</strong><br />
Apache Pass in <strong>the</strong> Dos Cabezas, <strong>the</strong> Glance Conglomerate<br />
unconformably overlies<br />
Pennsylvania Horquilla Limestone, while six miles east <strong>of</strong> Apache Pass, <strong>the</strong><br />
Glance Conglomerate overlies <strong>the</strong> El Paso Formation and Coronado Sandstone<br />
(Sabins, 1957).<br />
The Paleozoic sequence overlies Precambrian Pinal Schist,<br />
gneiss, and granite.<br />
The allochthonous block, formed by <strong>the</strong> Fort Bowie and Wood Mountain<br />
thrust faults, is correlated on a regional scale by Drewes<br />
(1979) as part<br />
<strong>of</strong> an extensive crustal plate thrust northward and nor<strong>the</strong>astward in sou<strong>the</strong>ast<br />
Arizona and southwest New Mexico called <strong>the</strong> Hidalgo Allochthon.<br />
In <strong>the</strong><br />
study area, Drewes (1976) infers a thrust fault in <strong>the</strong> subsurface beneath<br />
<strong>the</strong> sou<strong>the</strong>rn San Simon <strong>basin</strong>, which connects <strong>the</strong> thrust faults at Granite<br />
Gap with those in <strong>the</strong> nor<strong>the</strong>rn Chiricahua Mountains. However, it should be<br />
19
noted that o<strong>the</strong>r explanations are proposed for <strong>the</strong> thrust faults in sou<strong>the</strong>astern<br />
Arizona, which do not require <strong>the</strong> extensive horizontal movement <strong>of</strong><br />
<strong>the</strong> crust that is implied by Drewes (1976). Jones (1963), Davis (1979) and<br />
Keith and Barrett (1976) present arguments which suggest that <strong>the</strong> thrust<br />
faults are local and related to <strong>the</strong> margins <strong>of</strong> basement cored uplifts.<br />
On <strong>the</strong> allochthon, <strong>the</strong> Glance Conglomerate may reach 300 meters thickness<br />
and unconformably overlies only <strong>the</strong> Pennsylvanian-Permian Naco Group<br />
limestones to include <strong>the</strong> basal Horquilla Limestone.<br />
out that this unconformity has significant relief.<br />
Sabins (1957) pointed<br />
Also, <strong>of</strong> interest is <strong>the</strong><br />
apparent Mesozoic erosional thinning <strong>of</strong> <strong>the</strong> Paleozoic sequence in a north<br />
and eastward direction.<br />
The structure inferred by <strong>the</strong> Glance Conglomerate<br />
and thinning <strong>of</strong> <strong>the</strong> Paleozoic sequence may indicate a southwestern boundary<br />
<strong>of</strong> <strong>the</strong> Burro Uplift.<br />
The Dos Cabezas and nor<strong>the</strong>rn Chiricahua mountains appear to have had<br />
significant pre-Rhyolite Canyon Formation tilting.<br />
Dips in <strong>the</strong> Faraway Ranch<br />
Formation and older Nipper Formation average 20 0 and 40 0 , respectively. Tilting<br />
<strong>of</strong> <strong>the</strong> overlying Rhyolite Canyon Formation is less than 10 0 • Since Faraway<br />
Ranch Formation appears to thicken toward <strong>the</strong> south, suggesting a<br />
sou<strong>the</strong>rly source area, <strong>the</strong> angular unconformity <strong>of</strong> <strong>the</strong> older Faraway Ranch<br />
Formation and <strong>the</strong> younger Rhyolite Canyon Formation point toward significant<br />
volcano-tectonic subsidence or tectonic downwarping to <strong>the</strong> south. In addition,<br />
Marjaniemi (1969) postulates that <strong>the</strong> Rhyolite Canyon tuffs originate<br />
from a cauldron centered in <strong>the</strong> west central Chiricahua Mountains.<br />
The<br />
Faraway Ranch Formation ranges 29.0 ± 1.9 m.y.<br />
to 28.3 ± 2 m.y. and <strong>the</strong> Rhyolite<br />
Canyon Formation ranges 25.6 ± 0.8 m.y. to 24.7 ± 0.7 m.y. (Shafiqullah<br />
and o<strong>the</strong>rs, 1978). After subtracting <strong>the</strong> 30 0 -40 0 dip attributable to tectonism<br />
during and after volcanism from <strong>the</strong> observed dips on Paleozoic strata,<br />
20
attitudes <strong>of</strong> <strong>the</strong> thrust faults, reverse faults, and Paleozoic rocks are beo<br />
0<br />
tween 0 and 35. This means that lower Paleozoic rocks may be preserved<br />
beneath Tertiary volcanic rocks and sediment in <strong>the</strong> sou<strong>the</strong>rn Safford-San<br />
Simon Basin in <strong>the</strong> vicinity <strong>of</strong> Interstate 10.<br />
Basin and Range<br />
Mid-Tertiary volcanism probably ceased in <strong>the</strong> Safford-San Simon area by<br />
19 m.y. because <strong>the</strong> youngest observed volcanism in <strong>the</strong> area occurred in <strong>the</strong><br />
nor<strong>the</strong>rn Peloncillo Mountains 20 m.y. ago.<br />
Twenty-million-year-old felsic<br />
lavas and tuffs are observed in Tollgate Canyon and <strong>the</strong> Gila Box area (Don<br />
Richter, pers. comm.). Post 20 m.y. and contemporaneous with <strong>the</strong> mid-Tertiary<br />
volcanism, coarse clastic rocks were deposited in topographically low areas.<br />
Sediments <strong>of</strong> this depositional period are observed in <strong>the</strong> Gila Box at <strong>the</strong><br />
mouth <strong>of</strong> Bonita Creek and in Eagle Creek Canyon near Clifton. Heindl (1958)<br />
named <strong>the</strong>se sediments <strong>the</strong> Bonita Beds and Gold Gulch Beds, respectively; and<br />
both have basaltic andesite flows and silicic tuffs in basal exposures along<br />
canyons.<br />
In <strong>the</strong> Tucson area, <strong>the</strong> Rillito beds are believed to represent<br />
ano<strong>the</strong>r similar Miocene conglomerate deposit (Pashley, 1966).<br />
The Rillito<br />
beds are tilted and faulted by normal listric faults and overlie <strong>the</strong> Catalina<br />
fault, <strong>the</strong> low-angle decollement zone <strong>of</strong> <strong>the</strong> Catalina "metamorphic core complex".<br />
Unexposed tilted and faulted Miocene gravels may comprise <strong>the</strong> basement<br />
in <strong>the</strong> Safford-San Simon <strong>basin</strong> adjacent to <strong>the</strong> Pinaleno Mountains and<br />
may overlie an inferred decollement zone associated with <strong>the</strong> Pinaleno Mountains<br />
"metamorphic core complex".<br />
The tilted Miocene sediments immediately<br />
pre-date Basin and Range faulting.<br />
Present-day <strong>basin</strong>s and ranges began to develop during middle to late<br />
Miocene (15 m.y. to 10 m.y.) $carborough and Peirce, 1978). Scarborough and<br />
Peirce (1978) name this tectonism <strong>the</strong> "Basin and Range disturbance".<br />
The<br />
21
"Basin and Range disturbance" is characterized by complex high-angle faulting<br />
that broke <strong>the</strong> crust <strong>of</strong> sou<strong>the</strong>rn Arizona into a zigzag pattern <strong>of</strong> horsts<br />
(mountains) and grabens (<strong>basin</strong>s).<br />
Valleys <strong>of</strong> sou<strong>the</strong>rn Arizona roughly coincide<br />
with <strong>the</strong> structural <strong>basin</strong>s; however, <strong>the</strong> valleys are more extensive due<br />
to erosion <strong>of</strong> <strong>the</strong> horsts which have created pediments that laterally extend<br />
<strong>the</strong> low-lying topography.<br />
The Safford-San Simon Basin is a manifestation<br />
<strong>of</strong> <strong>the</strong> "Basin and Range disturbance".<br />
Young pediment fault scarps at <strong>the</strong><br />
Pinaleno Mountain front suggest that some "Basin and Range" faulting is still<br />
occurring at a low ebb.<br />
The greatest displacements occurred prior to late<br />
Pliocene because late Pliocene <strong>basin</strong>-filling sediments are largely underformed<br />
by faulting.<br />
"Basin and Range disturbance" faulting displaced basement rocks<br />
over two kilometers as evidenced by gravity surveys and deep oil and gas<br />
drill holes.<br />
Erosion <strong>of</strong> <strong>the</strong> horst blocks during and after faulting provided<br />
detritus to fill <strong>the</strong> <strong>basin</strong>s with up to two kilometers <strong>of</strong> clastic sediments.<br />
Actually, <strong>the</strong> Safford-San Simon <strong>basin</strong> represents several closely spaced enechelon<br />
grabens now buried beneath <strong>the</strong>se sediments to give <strong>the</strong> impression <strong>of</strong><br />
one extensive graben.<br />
Integrated drainage developed between <strong>basin</strong>s during Pleistocene time.<br />
The Gila and San Simon rivers have entrenched into <strong>the</strong> <strong>basin</strong>-filling sediments,<br />
since late Pliocene or early Pleistocene, to complete <strong>the</strong> present-day physiography<br />
within <strong>the</strong> Safford-San Simon Basin.<br />
"Basin-filling" sediments in <strong>the</strong> Safford-San Simon <strong>basin</strong> have been<br />
studied by Schwennesen (1917), Knechtel (1938), Heindl (1958), and by Harbour<br />
(1966). While <strong>the</strong> sediments are continuous in <strong>the</strong> area, <strong>the</strong>se authors have<br />
shown several semi-independent depositional <strong>basin</strong>s.<br />
Also, gradation <strong>of</strong> <strong>the</strong><br />
sediments from coarse near <strong>the</strong> mountain fronts to fine near <strong>the</strong> center <strong>of</strong> <strong>the</strong><br />
<strong>basin</strong>s is not a general characteristic <strong>of</strong> <strong>the</strong> <strong>basin</strong>-filling sediments; ra<strong>the</strong>r,<br />
22
gradation is observed only in certain localities.<br />
For purposes <strong>of</strong> definition within <strong>the</strong> structural framework and geologic<br />
history, <strong>the</strong> "<strong>basin</strong>-fill" sediments are only those sediments filling <strong>the</strong> "Basin<br />
and Range disturbance" structural <strong>basin</strong>s or overlying post "Basin and Range disturbance"<br />
erosional pediments. Two categories <strong>of</strong> <strong>basin</strong>-filling sediments are<br />
evident in this area.<br />
The youngest category includes deposits left by rivers<br />
and washes, which for <strong>the</strong> most part are entrenching older <strong>basin</strong>-fill deposits<br />
as a result <strong>of</strong> post-Pliocene development and integration <strong>of</strong> through-flowing<br />
drainage.<br />
In a strict definition,<strong>the</strong> young category <strong>of</strong> sediments is not<br />
<strong>basin</strong> fill in that <strong>the</strong>y are sediments in transport out <strong>of</strong> <strong>the</strong> <strong>basin</strong>.<br />
The<br />
o<strong>the</strong>r category <strong>of</strong> <strong>basin</strong> sediment is mostly older deposits <strong>of</strong> internal drainage<br />
(closed <strong>basin</strong> origin) and are truly <strong>basin</strong>-filling sediment.<br />
Basin-fill Sediments in <strong>the</strong> Safford Area<br />
The youngest category <strong>of</strong> sediments include flood plain deposits <strong>of</strong> <strong>the</strong><br />
Gila River and tributaries and gravel deposits capping "terrace" benches and<br />
mesas.<br />
The Gila flood plain sediments provide a large portion <strong>of</strong> <strong>the</strong> irrigation<br />
water for <strong>the</strong> Gila Valley.<br />
The older <strong>basin</strong> sediments are an important factor in <strong>geo<strong>the</strong>rmal</strong> interpretation<br />
<strong>of</strong> <strong>the</strong> area for two reasons: (1) <strong>the</strong>y are <strong>the</strong> reservoir rocks for<br />
most presently known occurrences <strong>of</strong> hot water in <strong>the</strong> area; (2) <strong>the</strong>y modify <strong>the</strong><br />
<strong>the</strong>rmal regime <strong>of</strong> <strong>the</strong> area because <strong>of</strong> <strong>the</strong>ir low <strong>the</strong>rmal conductivities.<br />
The<br />
older <strong>basin</strong> sediments are divided into two geographic distributions for convenience<br />
<strong>of</strong> discussion.<br />
The sediments in <strong>the</strong> Safford area are discussed separately<br />
from <strong>the</strong> sediments in <strong>the</strong> San Simon area.<br />
While <strong>the</strong>y do occur in<br />
semi,..independent depositional <strong>basin</strong>s, <strong>the</strong>y do have many common characteristics.<br />
In <strong>the</strong> Safford area, Harbour (1966) informally classifies <strong>the</strong> <strong>basin</strong>-fill<br />
sediments into two stratigraphic units, upper <strong>basin</strong> fill and lower <strong>basin</strong> fill.<br />
23
Harbour (1966)<br />
fur<strong>the</strong>r proposes that <strong>the</strong> Pliocene-Pleistocene boundary coincides<br />
roughly with <strong>the</strong> transition from lower <strong>basin</strong> fill to upper <strong>basin</strong> fill.<br />
The stratigraphic transition marks an overall change in <strong>the</strong> sedimentation processes<br />
which is inferred to be caused by a climatic change.<br />
The stratigraphy<br />
change also occurs below <strong>the</strong> Blancan-Irvington vertebrate faunal transition<br />
(Harbour, 1966).<br />
Harbour (1966)<br />
fur<strong>the</strong>r subdivides <strong>the</strong> upper and lower <strong>basin</strong>-fill stratigraphic<br />
units into facies.<br />
The facies are lithologically and depositionally<br />
distinct but interfinger both laterally and vertically due to rapid changes<br />
in depositional environments.<br />
The lower <strong>basin</strong> fill is divided into four major facies and two minor<br />
facies.<br />
A basal conglomerate facies is in depositional contact with pre-<br />
"Basin and Rangedisturbance'basement rocks.<br />
The coarse nature and thickening<br />
<strong>of</strong> <strong>the</strong> basal conglomerate facies toward <strong>the</strong> axis <strong>of</strong> <strong>the</strong> nor<strong>the</strong>rn Safford-<br />
San Simon <strong>basin</strong> suggest deposition after or contemporaneous with "Basin and<br />
Range" faulting.<br />
Harbour (1966) reports that a well drilled for water by<br />
Kennecott Copper Corporation north <strong>of</strong> Safford intersects 59 meters <strong>of</strong> conglomerate<br />
before encountering volcanic rocks at <strong>the</strong> base <strong>of</strong> <strong>the</strong> Gila Mountains;<br />
while near <strong>the</strong> Safford airport, ano<strong>the</strong>r well encounters 123.4 meters <strong>of</strong> gravel<br />
consisting <strong>of</strong> clasts <strong>of</strong> basalt and andesite before entering volcanic bedrock.<br />
A driller's log <strong>of</strong> ano<strong>the</strong>r Kennecott well, WW2,<br />
north <strong>of</strong> Safford (exact location<br />
not known) shows 0-36m gravel, 36-273m clay, 273-339m gravel, 339-356m<br />
clay and 356m bedrock (volcanic rocks) (files, City <strong>of</strong> Safford).<br />
In this<br />
water well, 66m <strong>of</strong> <strong>the</strong> basal conglomerate facies lie beneath 238m <strong>of</strong> clay and<br />
separated from bedrock by a thin strata <strong>of</strong> clay.<br />
At Safford, <strong>the</strong> driller's<br />
log <strong>of</strong> <strong>the</strong> sou<strong>the</strong>rn Pacific well documents "blue" clay and gypsiferous clay<br />
24
to depth <strong>of</strong> 555 meters (Knechtel, 1938). No comglomerate was encountered at<br />
depth in this well. However, in <strong>the</strong> Mary Mack well at Pima, Harbour (1966)<br />
interprets <strong>the</strong> basal conglomerate at 442 to 1,148 meters.<br />
A driller's log<br />
<strong>of</strong> <strong>the</strong> basal conglomerate facies in <strong>the</strong> Mary Mack well shows red <strong>san</strong>d interbedded<br />
with shale and gravel.<br />
Pre-"Basin and Range" rocks (bedrock) are not<br />
believed to have been encountered by this well because deep sediments encountered<br />
by this well produced copious quantities <strong>of</strong> water, suggestive <strong>of</strong><br />
poorly indurated and permeable sediment.<br />
The finer-grained lithology <strong>of</strong><br />
<strong>the</strong>se sediments may indicate deposition in <strong>the</strong> axis <strong>of</strong> <strong>the</strong> <strong>basin</strong>.<br />
The driller's log <strong>of</strong> <strong>the</strong> Sou<strong>the</strong>rn Pacific well at Safford reported by<br />
Knechtel (1938) is interpreted by Harbour (1966) to show <strong>the</strong> evaporite facies<br />
and <strong>the</strong> green clay facies <strong>of</strong> <strong>the</strong> lower <strong>basin</strong>-fill stratigraphic unit.<br />
Between<br />
213 and 555 meters <strong>of</strong> yellow gypsiferous clay and salty clay are classified<br />
in an evaporite facies.<br />
South <strong>of</strong> Safford, ano<strong>the</strong>r Sou<strong>the</strong>rn Pacific<br />
well at Tanque encountered gypsum and clay at a depth <strong>of</strong> 180 meters.<br />
The<br />
bottom 10 meters is in gypsum (Knechtel, 1938). Harbour (1966) interprets<br />
<strong>the</strong>se sediments as <strong>the</strong> evaporite facies.<br />
Green clay overlies <strong>the</strong> gypsiferous<br />
deposits in both wells and is called "blue clay" by <strong>the</strong> local drillers.<br />
Where green clay facies outcrops in <strong>the</strong> Safford area, it shows conformable<br />
thin bedded or laminated green and yellow clay layers with sharp contacts.<br />
Northwest <strong>of</strong> Safford <strong>the</strong> green clay facies becomes coarser, with alternating<br />
red and green clay layers that become increasingly red, silty, and <strong>san</strong>dy.<br />
The red silt and <strong>san</strong>d interbedded with red and brown clay is <strong>the</strong> red facies<br />
<strong>of</strong> Harbour (1966).<br />
The red facies overlies <strong>the</strong> basal conglomerate in <strong>the</strong><br />
Mary Mack well.<br />
Both <strong>the</strong> red facies and green clay facies appear to grade<br />
into each o<strong>the</strong>r and into <strong>the</strong> evaporite facies towards <strong>the</strong> center <strong>of</strong> <strong>the</strong> depositional<br />
<strong>basin</strong>.<br />
The basal conglomerate probably intertongues with <strong>the</strong><br />
25
evaporite facies and green clay/red facies at <strong>the</strong>ir bases and on <strong>the</strong>ir margins.<br />
The center <strong>of</strong> <strong>basin</strong>-fill deposition appears to be at Safford because<br />
<strong>the</strong> Sou<strong>the</strong>rn Pacific well at Safford has <strong>the</strong> greatest thickness and deepest<br />
known occurrence <strong>of</strong> clay and evaporite deposits in <strong>the</strong> <strong>basin</strong>.<br />
Note, however,<br />
that <strong>the</strong> Sou<strong>the</strong>rn Pacific well at Tanque encounters gypsum a couple <strong>of</strong> hundred<br />
feet higher in elevation than <strong>the</strong> well at Safford.<br />
This might indicate a<br />
separate depositional <strong>basin</strong> or that <strong>the</strong> center <strong>of</strong> <strong>the</strong> depositional <strong>basin</strong> is<br />
south <strong>of</strong> Safford in <strong>the</strong> vicinity <strong>of</strong> Tanque.<br />
Two subfacies are identified by Harbour (1966)<br />
in <strong>the</strong> green clay facies.<br />
Near San Jose nor<strong>the</strong>ast <strong>of</strong> Safford, a sequence <strong>of</strong> well sorted .and crossbedded<br />
<strong>san</strong>dstone interbedded with rounded gravel clasts intertongues into <strong>the</strong> green<br />
clay facies. Harbour (1966) interprets <strong>the</strong>se sediments as deltaic deposits.<br />
These sediments are called <strong>the</strong> delta facies, and <strong>the</strong>y are confined to <strong>the</strong><br />
area east and north <strong>of</strong> San Jose.<br />
The o<strong>the</strong>r subfacies occurs in discontinuous exposures at <strong>the</strong> top <strong>of</strong> <strong>the</strong><br />
green facies and is called <strong>the</strong> calcareous facies.<br />
The calcareous facies consists<br />
<strong>of</strong> calcareous zones and thin oolitic limestones or gypsiferous, salty,<br />
limonitic, clayey-siltstone interbedded in yellow or green clay.<br />
Harbour<br />
(1966) believes <strong>the</strong> calcareous facies represents <strong>the</strong> dessication (drying up)<br />
<strong>of</strong> <strong>the</strong> lake(s) that provided <strong>the</strong> depositional environment for <strong>the</strong> green clay<br />
facies and evaporite facies.<br />
The calcareous facies is not present everywhere<br />
due to probable erosion prior to deposition <strong>of</strong> <strong>the</strong> dominantly coarse-grained<br />
upper <strong>basin</strong> fill stratigraphic unit.<br />
The upper <strong>basin</strong> fill disconformably overlies<br />
<strong>the</strong> green clay facies.<br />
The upper <strong>basin</strong>-fill stratigraphic unit will not<br />
be discussed in detail because its position precludes any <strong>potential</strong> as a <strong>geo<strong>the</strong>rmal</strong><br />
reservoir.<br />
The upper b.asin-fill stratigraphic unit occurs mostly on<br />
<strong>basin</strong> margins and on <strong>the</strong> <strong>basin</strong> pediments where it probably grades into <strong>the</strong><br />
26
asal conglomerate facies <strong>of</strong> <strong>the</strong> lower <strong>basin</strong> fill.<br />
rfuere this occurs, important<br />
hydrologic connection no doubt exists to provide <strong>the</strong> ground water<br />
recharge and give <strong>the</strong> observed artesian pressure in <strong>the</strong> basal conglomerate<br />
facies.<br />
Basin-fill Sediments in <strong>the</strong> San Simon Area<br />
White (1963) uses an informal two-fold classification for sediments in<br />
<strong>the</strong> San Simon area.<br />
Basin-filling sediment are divided into younger alluvial<br />
fill and older alluvial fill.<br />
The younger alluvial fill category is restricted to sediment deposited<br />
by present-day washes or gravel-capping terraces or remnant erosional features.<br />
Technically, <strong>the</strong> younger alluvial fill category sediments are not <strong>basin</strong>-filling<br />
sediments because <strong>the</strong>y are sediments in transport out <strong>of</strong> <strong>the</strong> <strong>basin</strong>.<br />
True <strong>basin</strong>-filling sediments would be categorized by White<br />
(1963) as <strong>the</strong><br />
older alluvial fill sediments.<br />
White (1963) breaks <strong>the</strong> older alluvial fill<br />
sediments into four groups:<br />
(1) lower unit, (2) blue clay unit, (3) upper<br />
unit, (4) marginal zone.<br />
The lower unit is continuous throughout <strong>the</strong> <strong>basin</strong><br />
and probably correlates with <strong>the</strong> basal conglomerate facies <strong>of</strong> Harbour (1966)<br />
in <strong>the</strong> Safford area.<br />
Sand, gravel and clay comprise <strong>the</strong> lower unit and it<br />
contains water under artesian pressure which is tapped locally for irrigation.<br />
Total thickness <strong>of</strong> <strong>the</strong> lower unit varies, a maximum thickness <strong>of</strong> over 610<br />
meters is observed in <strong>the</strong> depositional <strong>basin</strong> center.<br />
The blue clay unit overlies <strong>the</strong> lower unit and attains a maximum thickness<br />
<strong>of</strong> 183 meters.<br />
Correlation <strong>of</strong> <strong>the</strong> blue clay unit with <strong>the</strong> green clay<br />
facies is probable because both "formation" tops occur near <strong>the</strong> same elevation<br />
and have similar deposition setting.<br />
Also, <strong>the</strong> lithology <strong>of</strong> <strong>the</strong> green<br />
clay facies and <strong>the</strong> blue clay unit is apparently identical.<br />
27
The upper unit sediments overlie <strong>the</strong> blue clay unit and consist <strong>of</strong> 20<br />
to 60 meters <strong>of</strong> silt, <strong>san</strong>d, and gravel.<br />
These sediments probably correlate<br />
with <strong>the</strong> upper <strong>basin</strong> fill unit <strong>of</strong> Harbour (1966). The marginal unit <strong>of</strong> White<br />
(1963) is defined as sediments occurring on <strong>the</strong> <strong>basin</strong> margins beyond <strong>the</strong> blue<br />
clay pinchout.<br />
Marginal unit sediments include both upper and lower unit<br />
sediments.<br />
For <strong>geo<strong>the</strong>rmal</strong> purposes, <strong>the</strong> green clay facies or blue clay units are<br />
very important because <strong>the</strong>y are aquicludes and have low <strong>the</strong>rmal conductivities.<br />
result.<br />
Thus, relatively high temperature gradients and confined aquifers<br />
The basal conglomerate facies or lower unit sediments provide artesian<br />
aquifers beneath <strong>the</strong> green clay facies.<br />
Nearly all wells penetrating<br />
<strong>the</strong> basal conglomerate facies or lower unit produce useable quantities <strong>of</strong><br />
water.<br />
28
Indian Hot Springs-Gila Valley<br />
Introduction<br />
Indian Hot Springs, 4S to 48°C,<br />
discharge from <strong>basin</strong>-fill sediments on<br />
<strong>the</strong> first major terrace above <strong>the</strong> present-day flood plain and north <strong>of</strong> <strong>the</strong><br />
Gila River.<br />
Travertine (calcium carbonate) deposits are observed cementing<br />
sediments at many springs discharges. Total flow rate <strong>of</strong> five spring discharges<br />
is approximately 1,000 l/min (Mariner and o<strong>the</strong>rs, 1977).<br />
Geochemistry<br />
Minor amounts <strong>of</strong> gas, mainly nitrogen, are released at spring orifices<br />
(Mariner and o<strong>the</strong>rs, 1977).<br />
Springs that evolve nitrogen gas are generally<br />
o<br />
associated with lower temperature <strong>geo<strong>the</strong>rmal</strong> systems «ISO C)<br />
(Bodvarsson,<br />
1964; Ellis and Mahon, 1977). Total dissolved solids (TDS) <strong>of</strong> <strong>the</strong> Indian Hot<br />
Springs ranges from 2,S70 to 3,004 mg/l (Table 2).<br />
Indian Hot Springs have<br />
sodium chloride composition with fluoride contents between 2.8 and 4.8 mg/l.<br />
The presence <strong>of</strong> sulfate, up to IS milliequivalent percent total anions, suggests<br />
that <strong>the</strong>se waters have had contact with gypsum.<br />
An artesian well,<br />
drilled to 183 meters at <strong>the</strong> springs in 1933, had a reported discharge <strong>of</strong><br />
lS6 gpm and a temperature <strong>of</strong> 48.3 0 C (Knechtel, 1938).<br />
o<br />
Using a MAT <strong>of</strong> 18 C,<br />
an estimated temperature gradient for <strong>the</strong> well at Indian Hot Springs is<br />
l6SoC/km.<br />
This gradient is much higher than average temperature gradients<br />
(46-48°C/km) <strong>of</strong> wells in <strong>the</strong> Safford-San Simon <strong>basin</strong>.<br />
The high temperature<br />
gradient indicates that <strong>the</strong> well intersects <strong>the</strong> zone <strong>of</strong> upward-flowing water,<br />
which discharges at <strong>the</strong> surface as spring flow.<br />
Structure<br />
Due to <strong>the</strong> mantle <strong>of</strong> travertine-cemented sediment and soil cover, no<br />
exposures were available to identify probable structures which control spring<br />
29
R27E<br />
T5S.<br />
T5S.<br />
T6S.<br />
T6S<br />
T7S.<br />
T7S.<br />
T8S<br />
T8S.<br />
T9S.<br />
TIOS.<br />
TIOS.<br />
Figure 6.<br />
Major geologic structure in <strong>the</strong> Safford area.<br />
30
flow.<br />
A fault zone(s) is inferred to provide <strong>the</strong> vertical conduit for <strong>the</strong>rmal<br />
water flow at Indian Hot Springs.<br />
Projection <strong>of</strong> <strong>the</strong> NNW-striking Pleistocene zone <strong>of</strong> faults in <strong>the</strong> Cactus<br />
Flat-Artesia area across <strong>the</strong> Indian Hot Springs location is possible.<br />
The<br />
springs are on strike with <strong>the</strong> Cactus Flat fault zone; and <strong>the</strong> Gila River<br />
changes course to conform with <strong>the</strong> inferred trace <strong>of</strong> this fault zone (Figure<br />
~. In addition, Muller (1973) shows degradation <strong>of</strong> chemical quality in<br />
shallow wells «6Sm) which are downstream from <strong>the</strong> inferred trace <strong>of</strong> <strong>the</strong> Cactus<br />
Flat zone.<br />
Sodium chloride water may leak upward along <strong>the</strong> fault and<br />
flow into shallow floodplain aquifers.<br />
Ano<strong>the</strong>r fault, crossing <strong>the</strong> Indian Hot Springs area, is inferred from<br />
gravity data and from geologic investigations at Big Springs.<br />
Big Springs, east <strong>of</strong> Indian Hot Springs in D-6-2S-S, is centered on a<br />
WNW alignment <strong>of</strong> springs. Deformation <strong>of</strong> <strong>basin</strong>-fill sediments is observed<br />
in arroyo walls just below Big Springs.<br />
Laminated clay deposits (green clay<br />
facies) are tilted and faulted.<br />
Mud intrusions along shears and faults suggest<br />
liquification during deformation.<br />
This deformation is pre-ancestral Gila<br />
River gravels, which are in angular unconformable contact with underlying<br />
deformed <strong>basin</strong>-fill sediment.<br />
Faults are oriented N2S o W and show downward<br />
displacement to <strong>the</strong> north.<br />
This exposure is interpreted by <strong>the</strong> writer as<br />
anti<strong>the</strong>tic deformation on <strong>the</strong> hanging wall <strong>of</strong> a large unexposed normal fault<br />
which may control spring alignment.<br />
The spring alignment at Big Springs can<br />
be projected northwest through Eden Spring and across Indian Hot Springs.<br />
Apparently, Indian Hot Springs are controlled by a fault(s) which allows<br />
vertical flow out <strong>of</strong> deep «1 km) artesian aquifers.<br />
At least two deep wells in <strong>the</strong> area, <strong>the</strong> Mary Mack well and <strong>the</strong> Mount<br />
31
Graham Mineral<br />
Bath well, discharge sodium chloride water with cation and<br />
anion ratios similar to Indian Hot Springs.<br />
Temperatures <strong>of</strong> water produced<br />
by <strong>the</strong> artesian wells are all within 110C <strong>of</strong> Indian Hot Springs (48 o C).<br />
The<br />
1,148-meter Mary Mack well, D-6-24-l3AB<br />
encountered five water-producing<br />
zones below 495 meters; and <strong>the</strong> well discharged 2,250 gpm <strong>of</strong> 58.9 0 C water,<br />
which had a sodium chloride composition and 3,530 mg/l TDS (Knechtel, 1938)<br />
(see driller's log in appendix 2).<br />
The Mount Graham Mineral Bath well, D-6-25-36CBB, discharges 610 gpm<br />
(files, USGS, Tucson) 46 o C, sodium chloride water with a TDS ranging from<br />
4,431 to 8,292 mg/l. This well, formerly called <strong>the</strong> Smithville Canal well,<br />
was drilled in 1957 to a total depth <strong>of</strong> 659 meters.<br />
Lithology in <strong>the</strong> well<br />
is mudstone to 312 meters depth (green clay <strong>of</strong> Harbour (1966), gypsiferous<br />
siltstone/mudstone and gypsum from 312 to 488 meters depth (evaporite facies<br />
<strong>of</strong> Harbour, 1966) and "volcanic" <strong>san</strong>d from 488 to 659 meters depth (basal<br />
conglomerate <strong>of</strong> Harbour, 1966) (files, USGS, Tucson). All water flow in this<br />
well apparently enters <strong>the</strong> borehole below 488 meters depth.<br />
A ra<strong>the</strong>r large and extensive low-temperature (40 to 70 o C)<br />
<strong>geo<strong>the</strong>rmal</strong><br />
reservoir is indicated in <strong>the</strong> Gila Valley by <strong>the</strong> deep wells and <strong>the</strong> hot<br />
springs. Near <strong>the</strong> Gila River, <strong>the</strong> top <strong>of</strong> <strong>the</strong> reservoir is approximately 500<br />
meters deep and may reach to 1 km in depth.<br />
The reservoir probably extends<br />
in <strong>the</strong> subsurface from Thatcher to Fort Thomas.<br />
Continuation <strong>of</strong> <strong>the</strong> reservoir<br />
beneath Safford is possible; however,<br />
<strong>the</strong> reservoir depth is probably<br />
much greater than 500 meters. A schlumberger resistivity sounding (Figure 7)<br />
centered in D-8-26-2C and modeled as a three-layer earth, shows 219 meters <strong>of</strong><br />
6.5 ohm-meter rock (Probably <strong>the</strong> green clay facies <strong>of</strong> Harbour, 1966) and 853<br />
meters <strong>of</strong> 0.5 ohm-meter rock (probably <strong>the</strong> evaporite facies <strong>of</strong> Harbour, 1966,<br />
and/or possibly <strong>san</strong>d and gravel containing <strong>the</strong>rmal, saline water)<br />
(Phoenix,<br />
32
DWG. NO.-R.-IJ.-~<br />
CALCULATED THICKNE8S<br />
AND RE81STlVITY<br />
THleICNES. REIISTIVITY<br />
IN ..ETERS I-OHII METERS<br />
I<br />
i<br />
219.0 I 6.6<br />
STATE OF ARIZONA BUREAU OF<br />
GEOLOGY a MINERAL TECHNOLOGY<br />
GEOLOGICAL SURVEY BRANCH<br />
GEOTHERMAL GROUP<br />
SAFFORD VALLEY GRAHAM COUNTY, ARIZONA<br />
863.0 I .6<br />
.. I:i 10<br />
I;; ..<br />
"" I .0<br />
~<br />
~ ..<br />
C>o 97.0<br />
FREQUENCY:<br />
DEPTH SOUNDING<br />
0.126 HZ.<br />
APP~VED:<br />
C'1<br />
C'1<br />
/;)«- J. ."
+N SCAL.E<br />
I<br />
o<br />
15 Kilometers<br />
E3 F3 Fa<br />
BASE MAP:USGS Sliver City, 1:250,000<br />
Figure, 8.<br />
Map showing areas with low electrical resistivity<br />
and wells which encounter evaporite minerals or<br />
brine.<br />
34
Geophysics, 1979).<br />
Nearby at Safford, <strong>the</strong> Sou<strong>the</strong>rn Pacific well bottomed<br />
at 555 meters in gypsiferous sediment.<br />
Ano<strong>the</strong>r nearby deep test well, D-7-<br />
26-26ABA, bottomed in halite and mudstone at 689 meters. These well data<br />
indicate that a <strong>potential</strong> <strong>geo<strong>the</strong>rmal</strong> reservoir at Safford is deep, possibly<br />
between 800 meters and 1 kilometer.<br />
Temperatures between 55 and 70 0 C are<br />
o<br />
possible, based upon an indicated temperature gradient <strong>of</strong> 45 C/km.<br />
Geo<strong>the</strong>rmometry<br />
Application <strong>of</strong> chemical geo<strong>the</strong>rmometry on <strong>the</strong>se waters is not appropriate<br />
within <strong>the</strong> qualifying assumptions required for <strong>the</strong>ir use (Fournier<br />
and o<strong>the</strong>rs, 1974).<br />
Because <strong>the</strong>se waters are probably in contact with highly<br />
soluble evaporite minerals, <strong>the</strong> Na-K-Ca geo<strong>the</strong>rmometer estimates are not<br />
believed to reflect deep reservoir conditions.<br />
with a1pha-cristobalite at Indian Hot Springs.<br />
Silica is in equilibrium<br />
Silica concentrations in <strong>the</strong><br />
Mount Graham Mineral Bath well are super-saturated with respect to all solid<br />
species <strong>of</strong> silica except amorphous silica (opal).<br />
Alpha-cristobalite geo<strong>the</strong>rmometers<br />
<strong>of</strong> <strong>the</strong> Mount Graham Mineral Bath well are 56°C to 64°C.<br />
Conclusion<br />
The <strong>the</strong>rmal regime <strong>of</strong> <strong>the</strong> Gila Valley is believed generally conductive,<br />
with systematic temperature increases with depth except near fault zones.<br />
The heat source for <strong>the</strong> <strong>the</strong>rmal waters is easily explained by <strong>the</strong> normal<br />
flow <strong>of</strong> heat from <strong>the</strong> earth's interior in <strong>the</strong> region.<br />
The relatively high<br />
temperature gradients (>40 o C/km)<br />
in this area are probably due to <strong>the</strong> insulating<br />
affect <strong>of</strong> low heat-conductive, <strong>basin</strong>-filling sediments.<br />
Figure 8 is a map <strong>of</strong> subsurface resistivity obtained by dipole-dipole<br />
pr<strong>of</strong>iling. This map is useful to show <strong>the</strong> subsurface extent <strong>of</strong> gypsiferous<br />
clay and evaporite minerals.<br />
Wells drilled in <strong>the</strong> zone <strong>of</strong> low resistivity<br />
are likely to encounter water whose TDS exceeds 3,000 mg/l.<br />
Localized<br />
35
aquifers in <strong>the</strong>se areas may have brines with TDS over 100,000 mg/l.<br />
A deep<br />
abandoned well at <strong>the</strong> Safford Golf Course encountered brine.<br />
Water production<br />
from depths below 1.3 kilometers is untested in <strong>the</strong> Gila Valley.<br />
36
Buena Vista Area<br />
Introduction<br />
More than eight irrigation wells, which are all less than 213 meters<br />
deep, discharge <strong>the</strong>rmal water from 30 to 49 0 C.<br />
These <strong>the</strong>rmal waters, previously<br />
reported by Muller and. o<strong>the</strong>rs (1973) as <strong>the</strong> "Larson anomaly", have<br />
sodium chloride-sulfate chemistry with TDS less than 1,200 mg/1 (Table 2).<br />
Three <strong>of</strong> <strong>the</strong>se wells sampled during <strong>the</strong> study have artesian flows which exceed<br />
an estimated 100 gpm during <strong>the</strong> winter months.<br />
Pumped flow rates<br />
measured by <strong>the</strong> U.S. Geological Survey range between 900 and 1,600 gpm (files,<br />
USGS,<br />
Tucson).<br />
Geochemistry<br />
Thermal waters in <strong>the</strong> Buena Vista area are readily distinguished from<br />
local non-<strong>the</strong>rmal waters by <strong>the</strong>ir low calcium «20 mg/1) and magnesium<br />
«8.0 mg/1) concentration and <strong>the</strong>ir high fluoride (>4.0 mg/1) concentrations.<br />
Fluoride concentration up to 14.0 mg/1 are reported for <strong>the</strong>rmal waters in<br />
this area (Figure 9). Dissolved silica in <strong>the</strong>se <strong>the</strong>rmal waters is supersaturated<br />
with respect to quartz and chalcedony at measured discharge temperatures.<br />
Dissolution <strong>of</strong> alumino-silicate minerals is tentatively suggested<br />
as <strong>the</strong> primary control <strong>of</strong> dissolved silica because <strong>the</strong> highest silica concentrations<br />
are observed in waters with <strong>the</strong> highest dissolved carbon dioxide<br />
concentration (Figure 10).<br />
Carbon dioxide reacts with sodium and potassium<br />
feldspars to form clay while adding dissolved sodium, potassium and silica<br />
to ground water (Garrels and Mackenzie, 1967; Stumm and Morgan, 1970).<br />
Subsurface mixing <strong>of</strong> non-<strong>the</strong>rmal waters and <strong>the</strong>rmal waters may occur<br />
because Muller and o<strong>the</strong>rs (1973, p. 55) report a conversation with Mr. Moroni<br />
Larson <strong>of</strong> Solomonsvi11e, who states that wells on <strong>the</strong> "east side <strong>of</strong> <strong>the</strong> road<br />
(San Jose Road) gradually cooled after pumping." This cooling suggests that<br />
37
~~/<br />
,~~/ -1/0'0<br />
35<br />
j>"<br />
/<br />
/<br />
"-"h.~" LR26E1F!27E,/;<br />
~.....-..~"( . / ;;,' : .<br />
"..,,';<br />
'I<br />
I_ 36° t·~<br />
3<br />
\'<br />
}, • f<br />
~3l--<br />
J;<br />
JI)"<br />
,-<br />
'~~'~<br />
, ,<br />
I<br />
~.,.,<br />
~"J'<br />
co<br />
C')<br />
..<br />
~ 29S~, ,~t/>0/I.SdI<br />
l \ iiJ', ~~496<br />
R27EIR28E '. ,<br />
t<br />
n I<br />
./'<br />
SCALE 1:62,500<br />
I inch equals I mile<br />
Figure 9.<br />
Map <strong>of</strong> fluoride distribution in <strong>the</strong> Buena Vista area.
/<br />
I<br />
/<br />
/<br />
/<br />
/<br />
/<br />
/<br />
/<br />
/<br />
/<br />
/<br />
I<br />
/<br />
/<br />
/<br />
/<br />
/<br />
/<br />
I<br />
/<br />
I<br />
/<br />
/<br />
/<br />
I<br />
2 I<br />
1·/<br />
• 3 I.<br />
I<br />
I<br />
/ Correlation Line <strong>of</strong><br />
/"'2 .. '-__- Cactus Flat-Artesia<br />
1 Wel,.<br />
.7<br />
.10<br />
"•<br />
.'8<br />
SILICA IN WELLS 5 AND 6 MAY<br />
BE IN EQUILIBRIUM WITH CHALCEDONY<br />
-4.5 +--...:/--....,-----..,.-----r-------.,----f<br />
-5.0 -4~5 -4~0 -3.5 -3.0<br />
LOG SiCOH)4<br />
EXCESS SILICA<br />
INCREASING ACTIVITY (CONCENTRATION)------_~<br />
Figure 10.<br />
Dissolved carbon dioxide versus excess silica<br />
for ground water in <strong>the</strong> Buena Vista area.<br />
39
hydraulic connection exists between <strong>the</strong> <strong>the</strong>rmal and non-<strong>the</strong>rmal waters.<br />
However, no correlation is apparent among chloride, lithium or boron concentrations.<br />
Systematic change in chloride, lithium and boron would confirm<br />
mixing because <strong>the</strong><br />
constituents are highly soluble and are probably not involved<br />
in equilibria reactions that cause mineral precipitates; <strong>the</strong>refore,<br />
if variations are observed, <strong>the</strong>y are explained by mixing <strong>of</strong> high concentration<br />
<strong>the</strong>rmal water (provided <strong>the</strong>ir concentrations are, in fact, high) with<br />
low concentration non-<strong>the</strong>rmal water.<br />
Silica and Na-K-Ca geo<strong>the</strong>rmometers are calculated for <strong>the</strong> Buena Vista<br />
<strong>the</strong>rmal waters and listed in Table 3.<br />
Reliability <strong>of</strong> <strong>the</strong> silica geo<strong>the</strong>rmometer<br />
temperatures are highly suspect because <strong>of</strong> probable non-quartz or nonchalcedony<br />
equilibria control <strong>of</strong> dissolved silica and, also, because mixing<br />
is possible.<br />
Likewise, <strong>the</strong> Na-K-Ca geo<strong>the</strong>rmometer is not believed reliable<br />
because cation exchange probably occurs among dissolved calcium and sodium<br />
contained in clay minerals which occur in <strong>basin</strong>-fill sediments.<br />
In addition,<br />
gypsum is possibly present in <strong>the</strong> <strong>basin</strong>-fill sediments and probably in <strong>the</strong><br />
underlying bedrock, which is reported to contain oxidized copper-bearing sulfides<br />
in well D-6-27-35CBB (files, USGS, Tucson). Dissolution <strong>of</strong> gypsum in<br />
ground water affects carbonate equilibria because additional calcium is introduced<br />
which may cause calcite to precipitate.<br />
In waters where calcite<br />
has precipitated, erroneously high geo<strong>the</strong>rmometer estimates result due to<br />
calcium loss.<br />
Where dissolution <strong>of</strong> gypsum occurs with no attendant calcite<br />
precipitation, calcium concentration is increased and erroneously low geo<strong>the</strong>rmometer<br />
temperatures are calculated.<br />
Geology and Reservoir Characteristics<br />
Regional heat flow studies, reconnais<strong>san</strong>ce geology and geophysics are<br />
used to tentatively infer <strong>the</strong> location, depth, and reservoir characteristics<br />
40
33<br />
34<br />
31<br />
T6S<br />
T7S<br />
<strong>of</strong> <strong>the</strong> Buena Vista <strong>geo<strong>the</strong>rmal</strong> system.<br />
Drillers' logs <strong>of</strong> area wells deeper<br />
than 60 m show <strong>the</strong> lithology <strong>of</strong> <strong>the</strong> shallow <strong>geo<strong>the</strong>rmal</strong> reservoir at Buena<br />
Vista.<br />
Figure 11 is a fence diagram constructed from geologic interpretation<br />
<strong>of</strong> drillers' logs listed in Appendix 1.<br />
Well D-7-27-llBBB is in mostly <strong>san</strong>dy<br />
clay, clay and <strong>san</strong>d to 105 m depth.<br />
These deposits are correlated with <strong>the</strong><br />
delta facies <strong>of</strong> Harbour (1966), which intertongues with <strong>the</strong> green clay facies<br />
three miles west <strong>of</strong> Buena Vista in outcrops north <strong>of</strong> <strong>the</strong> Gila River (Harbour,<br />
1966). The mostly fine-grained delta facies provides an aquiclude over permeable<br />
gravels that contain confined <strong>the</strong>rmal water.<br />
East <strong>of</strong> well D-7-27-llBBB,<br />
in wells D-7-27-2DBB and D-7-27-2AAA, <strong>the</strong> delta facies is thinned by 50 m;<br />
and it is more coarse grained and is interbedded with 3 to 6 m thick gravel<br />
tongues or lenses.<br />
The delta facies is not present in wells D-7-27-lBBA,<br />
D-7-27-2AAD and D-6-27-36CCC;<br />
instead, <strong>the</strong>se wells penetrate permeable gravel<br />
and "caliche".<br />
The absence <strong>of</strong> <strong>the</strong> delta facies is probably caused by pinchout<br />
and not by faulting because, north and south <strong>of</strong> <strong>the</strong> lithology change in wells<br />
D-6-27-35CBB and D-7-27-2CDB, bedrock depths are interpreted from drillers'<br />
logs at approximately 213 m.<br />
The shallow <strong>geo<strong>the</strong>rmal</strong> reservoir at Buena Vista<br />
is in permeable gravel below <strong>the</strong> delta facies.<br />
Top <strong>of</strong> <strong>the</strong> reservoir ranges<br />
from 105 m depth at <strong>the</strong> Sanchez Monument to less than 46 m depth 1.4 miles<br />
nor<strong>the</strong>ast <strong>of</strong> Sanchez Monument (Figure 12). The base <strong>of</strong> <strong>the</strong> shallow reservoir<br />
is 213 m depth.<br />
The permeable gravels comprising <strong>the</strong> reservoir are tentatively<br />
correlated with <strong>the</strong> lower <strong>basin</strong> fill, red facies or basal conglomerate<br />
facies, <strong>of</strong> Harbour (1966).<br />
Thermal water contained in <strong>the</strong> shallow reservoir may leak upward along<br />
buried structure from a deep reservoir.<br />
Figure 12 is a reconnais<strong>san</strong>ce geologic<br />
map <strong>of</strong> <strong>the</strong> area compiled from available published maps and from aerial<br />
U-2 photos and field reconnais<strong>san</strong>ce. A major fault, <strong>the</strong> Butte fault, crosses<br />
42
GElEIEEOl'3,53IEEa3lljO Mile<br />
E]<br />
B<br />
RECENT GILA RIVER DEPOSITS AND ARROYO<br />
DEPOSITS<br />
PLEISTOCENE TO RECENT PEDIMENT. ALLUVIAL<br />
FAN AND SLOPE DEPOSITS<br />
MID TO LATE PLEISTOCENE ANCESTRAL GILA<br />
RIVER TERRANCE DEPOSITS<br />
MID MIOCENE TO EARLY PLEISTOCENE BASIN<br />
FILL SEDIMENTS<br />
TERTIARY BASALTIC VOLCANIC ROCKS<br />
EXPLANATION<br />
/<br />
I<br />
- LATE CRETACEOUS-PALEOCENE (LARAMIDE)<br />
INTERMEDIATE VOLCANIC AND INTRlJSIVE<br />
ROCKS<br />
SCARP IN Qp SEDIMENTS AS DELINEATED<br />
FROM BLACK AND WHITE AERIAL PHOT(}<br />
GRAPHS.<br />
INFERRED BURIED "BASIN AND RANGE"<br />
FAULT ZONE BASED UPON LITHOLOGIC<br />
DISCONTINUITY AND BOUGUER GRAVITY<br />
DATA. LOCATIONS ONLY APPROXIMATE.<br />
BALL ON DOWN THROWN DIRECTION.<br />
Figure 12<br />
Reconnais<strong>san</strong>ce geologic map <strong>of</strong> <strong>the</strong> Buena Vista <strong>geo<strong>the</strong>rmal</strong> area.<br />
43
<strong>the</strong> area less than one mile north <strong>of</strong> <strong>the</strong> Buena Vista <strong>the</strong>rmal wells.<br />
Core descriptions<br />
by E.S. Davidson <strong>of</strong> <strong>the</strong> U.S. Geological Survey from well D-6-27-35CBB<br />
suggest that this well is very near <strong>the</strong> fault zone (files, USGS,<br />
Tucson).<br />
Davidson describes a conglomerate between 171 and 210 m whose bedding dips 30 0<br />
"from vertical" (files, USGS, Tucson).<br />
The bedding orientation is interpreted<br />
as ei<strong>the</strong>r evidence <strong>of</strong> drag on <strong>the</strong> hanging wall <strong>of</strong> <strong>the</strong> Butte fault zone or talus<br />
below a paleo-escarpment.<br />
Fanglomerate depositional dip is ruled out because<br />
<strong>the</strong>'observed dip is probably too steep.<br />
While conglomerates, predating highangle<br />
Basin and Range faulting, commonly have monoclinal geometry in Bonita<br />
Creek and in Eagle Creek, both east <strong>of</strong> Buena Vista, <strong>the</strong>se sediments do not<br />
contain red granite clasts.<br />
Instead, <strong>the</strong>y are angularly unconformable with<br />
overlying flat-bedded conglomerate, which consists <strong>of</strong> basaltic. and red granite<br />
clasts (Heindl, 1958).<br />
The younger bimodal gravels are post and syntectonic<br />
high-angle Basin and Range faulting such that <strong>the</strong>y fill contemporary structural<br />
<strong>basin</strong>s.<br />
Tilted gravels in D-6-27-35CBB, which contain red granite, are<br />
included in <strong>the</strong> younger suite <strong>of</strong> sediment that fill contemporary <strong>basin</strong>s;<br />
<strong>the</strong>refore, <strong>the</strong> apparently anomalous bedding orientation <strong>of</strong> gravels in D-6-27<br />
35CBB may indicate deformation proximal to a fault, albeit <strong>the</strong> Butte Fault.<br />
Below <strong>the</strong> tilted gravels in well D-6-27-35CBB, volcanic rock and volcanoclastic<br />
sediments are encountered at 211 m depth, while at 275 m depth, probable<br />
Laramide andesite is encountered.<br />
The andesite is epidotized and mineralized<br />
with copper (files, USGS, Tucson). Ano<strong>the</strong>r well, 1.5 miles south <strong>of</strong><br />
D-6-27-35CBB, also is believed to bottom in bedrock. This well, D-7-27-2CDB,<br />
reaches "red granite" at 213 m depth (files, USGS, Tucson). This "red granite"<br />
is interpreted by <strong>the</strong> writer as a red stained "Laramide" silicic tuff or a<br />
stained quartz monzonite intrusion like those exposed in <strong>the</strong> Gila Mountains<br />
near <strong>the</strong> Lone Star mine.<br />
This "red granite" is not believed to be lithology<br />
44
similar to <strong>the</strong> Precambrian granite in outcrops at Clifton, a likely source area<br />
for <strong>the</strong> red granite clasts in <strong>basin</strong>-fill gravels.<br />
An alternate interpretation<br />
explains <strong>the</strong> "red granite" ei<strong>the</strong>r as a highly indurated conglomerate<br />
with granite clasts or as a granite boulder.<br />
These alternate explanations<br />
seem more speculative, however, when considering that well D-7-2-2CDB lies<br />
astride a Bouguer gravity high which encompasses <strong>the</strong> areal extent <strong>of</strong> copper<br />
mineralization associated with "Laramide" volcanic rock and stocks (Figure 14 ) .<br />
In <strong>the</strong> Safford Basin, six miles west <strong>of</strong> Buena Vista, well D-7-26-26ABA,<br />
bottoms in 670 m <strong>of</strong> siltstone and mudstone, which are herein correlated with<br />
<strong>the</strong> green clay facies <strong>of</strong> Harbour (1966) (files, USGS, Tucson). Steep Bouguer<br />
gravity gradients between this well and Buena Vista, coupled with <strong>the</strong> much<br />
greater thickness <strong>of</strong> <strong>basin</strong> fill in well D-7-26-26AB~suggesta large normal<br />
fault zone(s) trending west-northwest (Figures 12 and 13).<br />
East <strong>of</strong> Buena Vista, ano<strong>the</strong>r fault zone is inferred from surface geology<br />
and <strong>the</strong> lithology log <strong>of</strong> well D-6-28-3lAAB.<br />
This well is in sediment to 165 m<br />
at total depth (files, USGS, Tucson). Less than a quarter <strong>of</strong> a mile east <strong>of</strong><br />
well D-6-28-3lAAB, Tertiary basaltic andesite is observed at <strong>the</strong> surface.<br />
A<br />
normal fault striking north-nor<strong>the</strong>ast whose hanging wall is west would explain<br />
<strong>the</strong> lithologic incongruity between <strong>the</strong> well and nearby surface exposures.<br />
This inferred fault may intersect <strong>the</strong> Butte fault zone 1.5 miles southwest<br />
<strong>of</strong> well D-6-28-3lAAB. A photo lineament extends south-southwest from, and<br />
on strike with, <strong>the</strong> inferred fault.<br />
Just north <strong>of</strong> San Jose Wash, a scarp<br />
facing northwest and coinciding with <strong>the</strong> lineament is easily seen in black<br />
and white U-2 photographs.<br />
Origin <strong>of</strong> <strong>the</strong> scarp is speculative; however, terracing<br />
is <strong>the</strong> stronger explanation because <strong>the</strong> present-day Gila River flood<br />
plain parallels <strong>the</strong> scarp strike.<br />
Detailed surface mapping <strong>of</strong> this area<br />
seems warranted in order to determine if <strong>the</strong> scarp has a tectonic or ero-<br />
45
sional origin.<br />
Geo<strong>the</strong>rmal systems are frequently localized by Quaternary or<br />
Recent faults.<br />
Geologic evidence shows that <strong>the</strong> <strong>the</strong>rmal well area at Buena Vista overlies<br />
a structural bench south <strong>of</strong> <strong>the</strong> Gila Mountains and bound by major fault<br />
zones on <strong>the</strong> north, south and east.<br />
Approximately 213 m <strong>of</strong> <strong>basin</strong>-filling<br />
sediments overlie<br />
<strong>the</strong> bench which is mostly composed <strong>of</strong> "Laramide" volcanic<br />
rocks and related intrusions.<br />
Nearby in <strong>the</strong> Gila Mountains, "Laramide" volcanic<br />
rocks are highly fractured with numerous nor<strong>the</strong>ast-trending shear zones<br />
and faults (Dunn, 1978; Robinson and Cook, 1966).<br />
These rocks are frequently<br />
altered pervasively and mineralized along shear zones<br />
(Dunn, 1978; Robinson<br />
and Cook, 1960).<br />
If <strong>the</strong> Laramide rocks underlying <strong>the</strong> structural bench are<br />
similarly fractured and sheared, which is an inescapable conclusion considering<br />
that <strong>the</strong> area lies astride <strong>the</strong> intersection <strong>of</strong> <strong>the</strong> Morenci lineament and a<br />
linear discontinuity <strong>of</strong> <strong>the</strong> Texas Zone, a deep <strong>geo<strong>the</strong>rmal</strong> reservoir possibly<br />
underlies <strong>the</strong> structural bench (Figure 6).<br />
The Butte fault and <strong>the</strong> San Jose<br />
fault zones may also contain a deep <strong>geo<strong>the</strong>rmal</strong> reservoir,especially near<br />
<strong>the</strong>ir intersection.<br />
A third possible <strong>the</strong>rmal water source for <strong>the</strong> shallow<br />
reservoir at Buena Vista is <strong>the</strong> Safford Basin.<br />
Thermal water may migrate upward<br />
from <strong>the</strong> <strong>basin</strong> interior through <strong>the</strong> basal conglomerate and into sediments<br />
marginal to <strong>the</strong> <strong>basin</strong> such as those at Buena Vista.<br />
In this case hydraulic<br />
connection is required between <strong>the</strong> gravels deeply buried in <strong>the</strong> <strong>basin</strong> with<br />
sediments on <strong>the</strong> structural bench.<br />
If <strong>the</strong>se later conditions exist, <strong>the</strong><br />
necessity <strong>of</strong> a deep and leaky bedrock reservoir in <strong>the</strong> structural bench or<br />
fault zones is not required and <strong>the</strong> maximum <strong>geo<strong>the</strong>rmal</strong> reservoir temperature<br />
at Buena Vista probably will not exceed 55 0 C.<br />
Reiter and Shearer, 1979, discuss <strong>the</strong> <strong>the</strong>rmal regime <strong>of</strong> a deep well 3.5<br />
miles east <strong>of</strong> Buena Vista. A heat flow <strong>of</strong> five HFU is reported for <strong>the</strong> 300-<br />
46
100<br />
+<br />
+<br />
+<br />
+<br />
300 +<br />
500 ~<br />
+<br />
+<br />
+<br />
+<br />
+<br />
+ ++<br />
:I:<br />
l ll.<br />
UJ<br />
o 700-<br />
+<br />
+<br />
+<br />
+<br />
+++++.<br />
900 - Temperature log from Reiter and Shearer, 1979<br />
1060<br />
35.0<br />
50.00<br />
TEMPERATURE °C<br />
65.0<br />
:or++<br />
I<br />
++<br />
>J'igure 13.<br />
Temperature versus depth pr<strong>of</strong>ile <strong>of</strong> deep well<br />
east <strong>of</strong> Buena Vista.<br />
47
COMPLETE BOUGUER GRAVITY ANOMALY MAP<br />
OF THE BUENA VISTA GEOTHERMAL REGION<br />
R26E R27E R28E<br />
T!5S<br />
T6S<br />
T7S<br />
R26E<br />
R27E<br />
SCALE 1:250,000<br />
+N o<br />
I<br />
E3 E3 E3<br />
o<br />
5MILES<br />
5 KILOMETERS<br />
E3 F3 F3<br />
R28E<br />
--I!50-<br />
2.5 Milligcl Contour interval<br />
[2J<br />
Bedrock (Pre Late-Miocene<br />
rock)<br />
EXPLANATION<br />
SOURCES<br />
X<br />
Copper mineralization associated<br />
with Late Cretaceous<br />
Eocene<br />
(Laramide) volcanic<br />
rocks and intrusions<br />
Gravity data from Wynn, 1981. Base map: USGS Silver City,<br />
I: 250,OOOj /970.<br />
Figure 14.<br />
Complete Bouguer gravity map <strong>of</strong> <strong>the</strong> Buena Vista<br />
area showing areas with copper mineralization.<br />
48
500 m interval, while 1.2 HFU is reported for <strong>the</strong> 950 to 1,050 m interval<br />
in this hole (Reiter and Shearer, 1979).<br />
The temperature-versus-depth pr<strong>of</strong>ile<br />
<strong>of</strong> this well (Figure 13) shows a temperature inversion below 500 m which is<br />
consistent with <strong>the</strong> heat flow data.<br />
Lateral flow <strong>of</strong> <strong>the</strong>rmal water entering<br />
<strong>the</strong> drill hole at about 600 m is a possible explanation for <strong>the</strong> temperature<br />
pr<strong>of</strong>ile below 500 m.<br />
The "Laramide" rocks believed to be encountered in this<br />
hole are inferred to have fracture permeability and have <strong>potential</strong> as a deep<br />
geo<strong>the</strong>rma1 reserV01r. 'Th' 1S we 11,whose b0ttom hIt 0 e emperat ure 1S . about 7Z o C,<br />
implies that <strong>the</strong> <strong>the</strong>rmal anomaly associated with <strong>the</strong> Buena Vista <strong>the</strong>rmal wells<br />
is more extensive and includes a larger area than is encompassed by <strong>the</strong> wells<br />
at Buena Vista.<br />
Available information points toward a deep <strong>geo<strong>the</strong>rmal</strong> system in <strong>the</strong><br />
fractured and sheared "Laramide" volcanic sequence and in <strong>the</strong> major Basin and<br />
Range fault zones transecting <strong>the</strong> subsurface in <strong>the</strong> Buena Vista area.<br />
Because<br />
no Quaternary volcanism is known in <strong>the</strong> Buena Vista region, <strong>the</strong> origin <strong>of</strong> <strong>the</strong><br />
<strong>the</strong>rmal anomaly is probably deep circulation <strong>of</strong> water through hot rock at depth<br />
which is heated by regional crustal heat flux.<br />
Additional geochemical and<br />
detailed heat flow studies are needed to adequately assess <strong>the</strong> extent and<br />
temperatures <strong>of</strong> <strong>the</strong> inferred, deep (1 to 2 km) <strong>geo<strong>the</strong>rmal</strong> system in <strong>the</strong> Buena<br />
Vista area.<br />
The known shallow, low-temperature <strong>geo<strong>the</strong>rmal</strong> reservoir at Buena<br />
Vista area has significant direct-use <strong>potential</strong> in agriculture, aquaculture,<br />
and space heating using 40 to 50 0 C water.<br />
49
Cactus Flat-Artesia Area<br />
Geology<br />
Figure 15 is a geologic map <strong>of</strong> <strong>the</strong> Cactus Flat-Artesia area.<br />
The<br />
Pinaleno Mountains, composed mainly <strong>of</strong> gneiss, form <strong>the</strong> western boundary <strong>of</strong><br />
<strong>the</strong> Safford Basin.<br />
Physiographically, <strong>the</strong>se mountains form a steep escarpment<br />
cut deeply by several nor<strong>the</strong>ast-striking canyons which follow easily<br />
eroded shear zones. These shear zones may allow significant ground water<br />
recharge and enhance <strong>potential</strong> for forced convection in <strong>the</strong> adjacent <strong>basin</strong>.<br />
During mapping <strong>of</strong> <strong>basin</strong>-fill sediments and surficial deposits, several<br />
small pediment scarps transverse to drainage and parallel to <strong>the</strong> mountain front<br />
were observed. Subsequent studies by Chris Menges (person. corom., 1980) have<br />
documented shearing in <strong>the</strong> Cenozoic <strong>basin</strong> fill exposed in an arroyo north <strong>of</strong><br />
Marijilda Canyon adjacent to and on strike with one <strong>of</strong> <strong>the</strong> mapped scarps.<br />
It<br />
is believed <strong>the</strong>se scarps represent at least one Pleistocene faulting episode.<br />
In this area, gravel caps <strong>of</strong> various ages cover Cenozoic <strong>basin</strong> fill and form<br />
<strong>the</strong> pediment surfaces.<br />
The surfaces displaced by faulting may be mid-to-late<br />
Pleistocene age, judging from <strong>the</strong>ir soil and caliche development (Morrison<br />
and Menges, 1981). Recent and probable late Pleistocene gravel caps do not<br />
have scarps.<br />
Because <strong>the</strong> scarps are related to Pleistocene tectonism, <strong>the</strong>y<br />
may have an important bearing on <strong>the</strong> location <strong>of</strong> <strong>the</strong> areas with greatest <strong>geo<strong>the</strong>rmal</strong><br />
energy <strong>potential</strong>.<br />
Pleistocene faults are frequently associated with<br />
<strong>geo<strong>the</strong>rmal</strong> systems.<br />
Apparently young faults provide good vertical permeability<br />
for flows <strong>of</strong> <strong>the</strong>rmal water.<br />
Surface mapping <strong>of</strong> <strong>the</strong> <strong>basin</strong>-filling sediments shows that <strong>the</strong> top <strong>of</strong><br />
<strong>the</strong> green clay facies <strong>of</strong> Harbour (1966)<br />
is about 3,340 feet <strong>of</strong> elevation.<br />
Roadcuts along U.S.<br />
666 near Artesia show outcrops <strong>of</strong> stratified clay and<br />
50
tN<br />
I<br />
\<br />
5 IOMiles<br />
\<br />
""1.<br />
EXPLANATION<br />
Qal ALLUVIUM. NO RED SOIL DEVELOPMENT Qdf BOULDER CONGLOMERATE. DEEPLY WEATHERED GNEISS<br />
BOULDERS.<br />
QS3<br />
CONGLOMERATE. WEAK CALICIIE DEVELOPMENT. RED SOIL DE-<br />
VELOPMENT. SURFACE BOULDERS NOT BURIED IN SOIL. QTs BASIN FILL SEDIMENT. GRADES FROM A SILTY ARKOSIC SAND-<br />
QS2 CONGLOMERATE. MODERATE CALICIIE CEMENT. FORMS GEOMOR-<br />
PHIC SURFACE WITH WELL DEVELOPED RED SOIL. SURFACE<br />
BOULDERS MOSTLY BURIED IN SOIL.<br />
QSl<br />
CONGLOMERATE. HIGHLY CEMENTED WITH CALICIIE. FOlUlS OLD-<br />
EST AND HIGHEST GEOMORPHIC SURFACE. SURFACE BOULDERS<br />
ALMOST BURIED IN SOIL.<br />
Figure 15.<br />
Gn<br />
'"<br />
STONE WITH GRAVEL LENSES NEAR MOUNTAIN FRONT TO SILT-<br />
STONE AND CLAY TOWARD VALLEY AXIS.<br />
GNEISS<br />
PLEISTOCENE PEDIMENT FAULT SCARP. BALL ON DOWN THROWN<br />
SIDE.<br />
Reconnais<strong>san</strong>ce geologic map <strong>of</strong> <strong>the</strong> Cactus F1at<br />
Artesia area.<br />
51
silt.<br />
These deposits become more coarse-grained as <strong>the</strong> mountain front is<br />
approached.<br />
Drillers' well logs are interpreted to show <strong>san</strong>ds and gravels<br />
interfingering in <strong>the</strong> clay and siltstone.<br />
The <strong>the</strong>rmal artesian aquifers in<br />
<strong>the</strong> area are believed to be <strong>san</strong>d and gravel tongues in <strong>the</strong> green clay facies<br />
<strong>of</strong> Harbour (1966).<br />
Medium- to coarse-grained and weakly stratified <strong>san</strong>ds resmbling grus<br />
overlie <strong>the</strong> green clay facies west <strong>of</strong> Artesia.<br />
Thin, discontinuous lenses<br />
<strong>of</strong> cobble to boulder conglomerate occur in <strong>the</strong>se sediments, which are correlated<br />
with Harbour's pediment facies.<br />
are in contact with'wea<strong>the</strong>red bedrock.<br />
West <strong>of</strong> Metate Peak, <strong>the</strong>se sediments<br />
Here, <strong>the</strong> highly wea<strong>the</strong>red gneiss<br />
resembles a red saprolite; <strong>the</strong> feldspars are mostly altered to red clay.<br />
The foliation and augen texture <strong>of</strong> <strong>the</strong> gneiss is distinguishable and facilitates<br />
definition <strong>of</strong> <strong>the</strong> contact with <strong>the</strong> overlying <strong>basin</strong> fill.<br />
Basin fill<br />
at Metate Peak is unusually fine-grained considering its position next to<br />
<strong>the</strong> mountain front. However, above <strong>the</strong>se <strong>basin</strong>-fill sediments, several dissected<br />
deposits <strong>of</strong> boulder conglomerate consisting <strong>of</strong> wea<strong>the</strong>red gneiss boulders<br />
occur in <strong>the</strong> mouths <strong>of</strong> canyons.<br />
It is inferred that <strong>the</strong>se deposits<br />
mostly overlie <strong>the</strong> pediment facies and are remnants <strong>of</strong> fans.<br />
A gross climatic<br />
change may be indicated in <strong>the</strong> change from grus like fan deposits next to <strong>the</strong><br />
mountain front to <strong>the</strong> overlying boulder fanglomerate.<br />
In any case, it appears<br />
that all <strong>of</strong> <strong>the</strong>se sediments are hydrologically connected and <strong>the</strong>y allow <strong>the</strong><br />
recharge <strong>of</strong> water to <strong>the</strong> gravel and <strong>san</strong>d tongues in <strong>the</strong> green clay facies and<br />
an inferred, deep, basal conglomerate below <strong>the</strong> clay deposits.<br />
The area's subsurface structure and stratigraphy is fur<strong>the</strong>r defined by<br />
geophysical data.<br />
Both gravity and aeromagnetic data (Wynn and Dansereau,<br />
1979; Sauck and Sumner, 1970) show steep gradients between U.S. Highway 666<br />
and <strong>the</strong> Pinaleno Mountain front (Figures 16 and 17). The steep gradients<br />
52
are interpreted as evidence <strong>of</strong> a major Basin and Range fault zone.<br />
The<br />
gradients are caused by density and magnetic susceptibility differences<br />
between <strong>basin</strong>-filling sediments and <strong>the</strong> crystalline bedrock exposed in <strong>the</strong><br />
mountains.<br />
Dipole-dipole resistivity pr<strong>of</strong>iling parallel to <strong>the</strong> gradient and transverse<br />
to <strong>the</strong> strike <strong>of</strong> <strong>the</strong> gravity and magnetic anomalies was done by Phoenix<br />
Geophysics for <strong>the</strong> Arizona Bureau <strong>of</strong> Geology and Mineral Technology (ABGMT)<br />
in 1979. Location <strong>of</strong> <strong>the</strong> pr<strong>of</strong>iles is shown in Figure 18. A 2,000-foot<br />
electrode spacing was used in <strong>the</strong> survey and readings taken at a maximum <strong>of</strong><br />
five-electrode spacing (10,000 ft) in order to obtain resistivity information<br />
up to 1 km depth.<br />
Additional modeling <strong>of</strong> <strong>the</strong>se data was done by William<br />
Sill <strong>of</strong> <strong>the</strong> University <strong>of</strong> Utah Research Institute (UURI).<br />
Basin stratigraphy<br />
and structure is interpreted from <strong>the</strong> resistivity data (Figure 19 ).<br />
Very low<br />
resistivity,
;"~,./(~'/' ·~sI:, .' ;~"' ~.'i"l' 1·····;~ r--+--:'-'\j--~3~~~~:::r"----:<br />
. '1' V. ,'I . '.'.' ~ '. Wells .i! 1 I '-.'~ 58.3 .'.7. • "I ".1' I, .' .,<br />
I "/:: I 12/ 'I "-lfL' aid ...., I '· ~tn i 65;;l 9);:;j 1 10/ 1 11 ~j'''J,,"1~ 1<br />
lJ!~i~~'f~.d~-~~~OZf5" .. t.W'K~~ ;0 . , I",,!'·····<br />
'1'.'_..~----<br />
,,:1'-<br />
r";'~'., f,·.·'<br />
/ f~~';\'-" ,. ~:" ." -" ,"<br />
iV'"<br />
6'W<br />
.k·· l i i .. ,·,<br />
26<br />
35<br />
""'-'-------'<br />
IMile<br />
~
LINE 7 RESISTIVITY<br />
N =2000 FEET, DIPOLE-DIPOLE ELECTRODE CONFIGURATION<br />
N lOW 8W 6W 4W 2W 0 2E 4E 6E 8E IOE 12E<br />
I<br />
PSEUDOSECTION<br />
2<br />
OF<br />
3<br />
APPARENT<br />
4<br />
RESISTIVITY<br />
Ohm-meters<br />
5l..-.__--::~---.b,...._-~......,I:_____r--_!o_--__:~---_+_---l<br />
N lOW 8W 6W 4W<br />
I<br />
2<br />
3<br />
4<br />
5<br />
PSEUDOSECTION<br />
OF MODEL<br />
APPARENT<br />
RESISTIVITY<br />
Ohm - meters<br />
~ 0<br />
~ 10,00<br />
~ 2000<br />
~<br />
j}<br />
3000<br />
'1 4000<br />
10<br />
20<br />
30<br />
o<br />
I------t<br />
2000 Feet<br />
RESISTIVITY<br />
SUBSURFACE<br />
MODEL<br />
Ohm - meters<br />
LINE 8 RESISTIVITY<br />
N lOW<br />
8W<br />
N= 2000 FEET, DIPOLE-DIPOLE ELECTRODE CONFIGURATION<br />
6W 4W2W 0 2E 4E 6E 8E 10E 12E<br />
I<br />
2<br />
3<br />
4<br />
5<br />
N lOW<br />
I<br />
2<br />
3<br />
4<br />
5<br />
8W<br />
PSEUDOSECTION<br />
OF<br />
APPARENT<br />
RESISTIVITY<br />
Ohm-meters<br />
PSEUDOSECTION<br />
OF MODEL<br />
APPARENT<br />
RESISTIVITY<br />
Ohm - meters<br />
...... 0<br />
~ 1000<br />
~ 2000<br />
~ 3000<br />
~<br />
~ 4000<br />
"""301<br />
20 20<br />
I<br />
10 r5<br />
I<br />
50 30<br />
I I 3 I L!-<br />
I<br />
10<br />
5 I<br />
1<br />
I 0.4<br />
0 2000 FEET I I 5<br />
I---j<br />
RESISTIVITY<br />
SUBSURFACE<br />
MODEL<br />
Ohm-meters<br />
Figure 19.<br />
Subsurface resistivity models and pseudosections<br />
<strong>of</strong> resistivity pr<strong>of</strong>iles 7 and 8.<br />
55
subsurface temperatures and depths to zones producing artesian water flow.<br />
Temperature gradients were estimated by subtracting mean annual temperature<br />
(MAT)<br />
from surface discharge temperatures <strong>of</strong> <strong>the</strong> wells and dividing this<br />
difference by <strong>the</strong> well depths.<br />
By multiplying this quotient by 1,000, an<br />
estimated temperature gradient in °C/km is obtained, provided °c is used<br />
for temperature and meters is used for well depths.<br />
In this area, artesian<br />
wells ranging 79 to 400 m depth have surface discharge temperatures ranging<br />
20 to 36°C and have calculated gradients ranging 29 0 C/km to over l30 o C/km.<br />
Histograms shown by Witcher (1979) indicate that most wells have estimated<br />
temperature gradients between 50 and 60 o C/km.<br />
In order to delineate water-producing intervals, Witcher (1979)<br />
reviewed<br />
drillers' comments reported by Knechtel (193S) and depths which drillers reported<br />
increases in water flow.<br />
These depths are shown in a summary table<br />
<strong>of</strong> <strong>the</strong>se data (Table 4) which clearly shows five different depth intervals<br />
that produce artesian water flow.<br />
gradients for wells below 140 m.<br />
Also evident are similar temperature<br />
This suggests a systematic increase in<br />
temperature with depth.<br />
Conductive heat flow through <strong>the</strong> <strong>basin</strong>-fill sediments<br />
and <strong>the</strong>ir contained aquifers probably causes <strong>the</strong> observed consistency in<br />
gradients.<br />
Reinterpretation <strong>of</strong> <strong>the</strong> temperature and depth data (Figure 20) confirms<br />
<strong>the</strong> linear change in temperature with depth.<br />
When only wells in <strong>the</strong> Cactus<br />
Flat area are used, a correlation <strong>of</strong> 0.93206 is obtained.<br />
The slope or temperature<br />
gradient is 45 0 C/km with an intercept (or surface temperature)<br />
<strong>of</strong> 19.9 0 C, which is slightly above <strong>the</strong> MAT (lSoC). Because water will cool<br />
during flow to <strong>the</strong> surface, <strong>the</strong> actual gradient is probably slightly higher.<br />
If cooling effects are accounted, <strong>the</strong> surface intercept or <strong>the</strong> correct temperature-versus-depth<br />
graph is closer to <strong>the</strong> MAT.<br />
Anomalously warm wells at<br />
56
100<br />
200<br />
0...---..."...-----------------------------------...<br />
• •<br />
10~/(M<br />
-<br />
-+<br />
+<br />
- • -+<br />
t+<br />
-<br />
'1$0<br />
• " ~.ff • •<br />
• :.<br />
•<br />
•<br />
• I<br />
..<br />
+<br />
---<br />
400<br />
500<br />
Temperature vs Depth for Artesian Wells<br />
In <strong>the</strong> Cactus Flat-Artesia Area<br />
• Wells in <strong>the</strong> Cactus Flat Area<br />
+ Wells in Sections 32 and 33, 0-8-26<br />
at Artesia<br />
CACTUS FLAT DATA<br />
Correlation 0.93206<br />
Slope 44.9<br />
Intercept 19.9<br />
•<br />
•<br />
•<br />
•<br />
19 20 21 22 23 24 25 26 ZT 28 29 30 31 32 33 34 35 36<br />
Temperature (DC)<br />
Figure 20.<br />
Temperature versus depth well data in <strong>the</strong> Cactus<br />
Flat-Artesia area.<br />
57
, i.<br />
,-<br />
"<br />
- ,<br />
35<br />
•<br />
M53<br />
'i'/ho<br />
EXPLANATION<br />
'th estlma , ted temperature gra d' Ient °C/km<br />
Well WI ed well . 0C/km<br />
Temperature IO~~ature grad.ent ture gradients<br />
Measured t~mp timated tempera<br />
Area WI'th high es<br />
Figure 21. 'n <strong>the</strong> area<br />
Map show~ g ia area.<br />
~n ' <strong>the</strong> Artes<br />
<strong>of</strong> h~g ' h temperature<br />
gradients<br />
58
Artesia in D-8-26-32 and 33 have estimated temperature gradients over lOOoC!km<br />
(Figure 21). No well data is available south <strong>of</strong> this area. This area may<br />
have <strong>potential</strong> for <strong>geo<strong>the</strong>rmal</strong> <strong>resource</strong>s exceeding 1000C at reasonably drillable<br />
depths (1 to 2 km).<br />
The high-temperature gradients may indicate a convective<br />
<strong>geo<strong>the</strong>rmal</strong> system beneath confining clays.<br />
Mercury Soil Survey<br />
A mercury soil survey was conducted in <strong>the</strong> area with high estimated temperature<br />
gradients.<br />
Because mercury soil sampling has been shown to be a<br />
useful exploration technique to define <strong>geo<strong>the</strong>rmal</strong> anomalies with no surface<br />
expression, it is used herein to help define <strong>the</strong> sou<strong>the</strong>rn closure <strong>of</strong> <strong>the</strong><br />
anomalous temperature gradient anomaly at Artesia. Matlick and Buseck (1975)<br />
have used <strong>the</strong> technique in Long Valley, California, Summer Lake and Klamath<br />
Falls, Oregon, with success.<br />
In this survey, two soil samples at each location, five to ten feet apart<br />
and from five to ten cm depth, were collected in 3x5-inch ziplock plastic<br />
bags, sealed and placed in a styr<strong>of</strong>oam cooler.<br />
Consequently, back in <strong>the</strong> lab,<br />
<strong>the</strong> samples were dried and screened through a -80 stainless steel mesh sieve.<br />
Mercury analysis <strong>of</strong> <strong>the</strong> sieved fines was done by atomic absorption.<br />
No apparent correlation exists between lithologic units and different<br />
surficial deposits in <strong>the</strong> area surveyed.<br />
The background mercury concentration<br />
is 225 parts per billion (ppb) mercury (Hg) ± 99 ppb.<br />
This is a relatively<br />
high background concentration, which may reflect <strong>the</strong> geologic setting<br />
<strong>of</strong> <strong>the</strong> surveyed area.<br />
Unusually high soil mercury contents are defined by values exceeding<br />
303 ppb, which is <strong>the</strong> statistical mean plus one standard deviation.<br />
High concentrations <strong>of</strong> soil mercury exist south <strong>of</strong> Artesia and adjacent<br />
to <strong>the</strong> area <strong>of</strong> high estimated temperature gradients. Two east-nor<strong>the</strong>ast-<br />
59
Figure 22. Map showing distribution <strong>of</strong> soil mercury in<br />
<strong>the</strong>. Cactus Flat-Artesia ?rea.<br />
60
trending 1.5 km 2 closures with soil mercury exceeding 350 ppb Hg occur in <strong>the</strong><br />
anomalous areas (Figure 22).<br />
zone is trending northwest.<br />
The general configuration <strong>of</strong> <strong>the</strong> anomalous<br />
This northwest trend corresponds with <strong>the</strong> geophysically<br />
defined extent <strong>of</strong> <strong>the</strong> <strong>basin</strong>-bounding fault zone and <strong>the</strong> trend <strong>of</strong><br />
identified Pleistocene fault scarps to <strong>the</strong> north and south <strong>of</strong> <strong>the</strong> surveyed<br />
area.<br />
The superposed east-nor<strong>the</strong>ast trending mercury anomalies are on strike<br />
with shear zones, mapped by Thorman (in press), in <strong>the</strong> Pinaleno Mountains to<br />
<strong>the</strong> west.<br />
The mercury anomalies may indicate a <strong>geo<strong>the</strong>rmal</strong> system in a basement<br />
structural intersection and may indicate <strong>the</strong> sou<strong>the</strong>rn closure <strong>of</strong> <strong>the</strong> hign<br />
estimated temperature gradients at Artesia.<br />
Ground Water Geochemistry and Geo<strong>the</strong>rmometry<br />
Ground water in <strong>the</strong> Cactus Flat-Artesia area is one <strong>of</strong> three types <strong>of</strong><br />
chemistry.<br />
Shallow non-artesian wells penetrating unconsolidated <strong>san</strong>d and<br />
gravel nearest <strong>the</strong> Pinaleno Mountains are sodium bicarbonate water, while<br />
deeper wells tapping confined aquifers and unconfined aquifers adjacent or<br />
east <strong>of</strong> U.S. Highway 666 discharge sodium chloride-sulfate water.<br />
The sodium<br />
bicarbonate waters have <strong>the</strong> lowest temperatures, total dissolved solids (TDS)<br />
and fluoride contents; conversely, <strong>the</strong> sodium chloride-sulfate waters show<br />
temperatures up to 46 o C, TDS is between 1,000 milligrams per liter (mg/l) and<br />
9,000 mg/l, and fluoride contents range between 1.0 and 14 mg/l. A third type<br />
<strong>of</strong> water discharges from some shallow artesian wells and has an intermediate<br />
sodium sulfate-bicarbonate-chloride composition with TDS<br />
o<br />
Temperatures <strong>of</strong> <strong>the</strong> latter type water range from 28 to 34 C.<br />
less than 2,000 mg/l.<br />
A possible mechanism for <strong>the</strong> intermediate composition water is mixing<br />
<strong>of</strong> sodium bicarbonate water with sodium chloride-sulfate water; however,<br />
mixing may not be a dominant mechanism because intermediate composition<br />
61
tl<br />
0 0<br />
(f)<br />
u<br />
1.5<br />
1.0<br />
+ + rtl<br />
U 0 0.5 u<br />
:I:<br />
C)<br />
9<br />
0.0<br />
·0.5<br />
It_<br />
I<br />
I<br />
I<br />
I<br />
I<br />
I<br />
/<br />
I<br />
I<br />
I<br />
I<br />
I<br />
I<br />
, I<br />
I<br />
I<br />
I<br />
.016<br />
I<br />
I<br />
" -15<br />
CORRELATION<br />
SLOPE<br />
INTERCEPT<br />
7__ 25 /<br />
12__8 /<br />
6-_<br />
-10 /<br />
" I<br />
I<br />
/ - 31<br />
I<br />
I<br />
I<br />
I<br />
I<br />
I<br />
I<br />
,.,<br />
I<br />
18<br />
I<br />
" _33<br />
,'-5<br />
-23<br />
-13 - I<br />
'441 I I<br />
17 /<br />
- I I<br />
I<br />
I<br />
I<br />
I<br />
I<br />
0.93145<br />
0.628<br />
1.555<br />
I<br />
I<br />
I<br />
/ _32<br />
I<br />
I<br />
Concentrations in milliequivalents<br />
-1.0<br />
LOG U<br />
-0.5 0.0<br />
Figure 23.<br />
Anion ratios versus lithium <strong>of</strong> ground water in<br />
Cactus Flat-Artesia area.<br />
62
waters occur in confined or artesian aquifers.<br />
Confined aquifers have limited<br />
hydrologic connection with underlying or overlying aquifers.<br />
Ano<strong>the</strong>r mechanism<br />
is <strong>the</strong>refore preferred to explain th~<br />
apparent continuum in ground water<br />
chemistry in <strong>the</strong> Cactus Flat-Artesia area.<br />
In order to fur<strong>the</strong>r delineate ground water chemistry and test for mixing,<br />
milliequivalent ratios <strong>of</strong> anions are compared to lithium concentrations.<br />
Chloride, sulfate, and bicarbonate were selected because <strong>the</strong>y represent major<br />
constituents in <strong>the</strong> Cactus Flat-Artesia ground waters; and <strong>the</strong>y are not likely<br />
to be involved in ion exchange with clay.<br />
Lithium concentration is used as<br />
a comparison to <strong>the</strong> anion ratios because it is not likely to be involved in<br />
equilibria reactions due to its high solubility in <strong>the</strong> presence <strong>of</strong> chloride.<br />
While lithium may be acquired in ground waters by ion exchange, <strong>the</strong> reverse<br />
is unlikely due to its low electron negativity compared to similar-sized<br />
ions.<br />
The green clay facies and <strong>the</strong> evaporite facies are geologically inferred<br />
as <strong>the</strong> source <strong>of</strong> lithium, chloride, and sulfate due to <strong>the</strong> probable presence<br />
<strong>of</strong> evaporite minerals.<br />
Mixing <strong>of</strong> sodium bicarbonate water with sodium chloridesulfate<br />
water is possible; but it is tentatively ruled out because <strong>the</strong> correlation<br />
<strong>of</strong> high chloride-sulfate waters with high concentration lithium waters<br />
is not observed until <strong>the</strong> logarithmic concentrations are compared (Figure 23).<br />
Mixing generally shows a linear correlation instead <strong>of</strong> <strong>the</strong> observed exponential<br />
relationship.<br />
An exponential relationship suggests that equilibria or<br />
exchange reactions are responsible for <strong>the</strong> variation in ground water chemistry.<br />
Also, lithium and anion ratios show no correlation to temperature or TDS,<br />
which would be expected if mixing were occurring between a deep homogeneous<br />
sodium chloride-sulfate water and <strong>the</strong> shallow sodium bicarbonate water.<br />
Because differences in ground water chemistry due to equilibria or exchange<br />
reactions are indicated, Na-K-Ca geo<strong>the</strong>rmometry on <strong>the</strong>se ground waters<br />
63
may be erroneous. However, silica concentration is frequently used in <strong>geo<strong>the</strong>rmal</strong><br />
exploration to infer deep <strong>geo<strong>the</strong>rmal</strong> reservoir temperatures with <strong>the</strong><br />
assumption that silica concentration in shallow <strong>the</strong>rmal wells and spring waters<br />
is<br />
derived from leakage <strong>of</strong> water out <strong>of</strong> a <strong>geo<strong>the</strong>rmal</strong> reservoir and that <strong>the</strong><br />
silica concentration has not been diluted by mixing, or that if mixing has<br />
occurred, <strong>the</strong> mixing ratio can be determined in order to calculate silica<br />
concentration before mixing (Fournier and o<strong>the</strong>rs, 1974; Fournier and Truesdell,<br />
1974). The main requirements for silica geo<strong>the</strong>rmometry are that silica in<br />
solution is determined by temperature-dependent equilibrium with a solid form<br />
<strong>of</strong> silica in <strong>the</strong> reservoir and that no<br />
equilibration occurs after <strong>the</strong> <strong>the</strong>rmal<br />
waters leak from <strong>the</strong> <strong>geo<strong>the</strong>rmal</strong> reservoir and cool.<br />
This latter requirement<br />
is reasonable because water flow or leakage rates probably exceed <strong>the</strong> kinetics<br />
<strong>of</strong> quartz equilibria in water at lower temperatures.<br />
Because Cactus Flat-Artesia <strong>the</strong>rmal waters originate from confined aquifers<br />
which are apparently heated in a conductive heat regime, silica concentrations<br />
should be in temperature-dependent equilibrium with ei<strong>the</strong>r quartz,<br />
chalcedony, or alpha-cristobalite.<br />
Silica concentrations for ground waters in <strong>the</strong> Cactus Flat-Artesia area<br />
are all supersaturated with respect to quartz at measured temperatures.<br />
In<br />
addition, inspection <strong>of</strong> <strong>the</strong> chemical analyses <strong>of</strong> Cactus Flat-Artesia ground<br />
waters listed in Table 2 shows relatively high concentrations <strong>of</strong> dissolved<br />
silica (up to 50 mg/l) in cold sodium bicarbonate ground waters, which have<br />
high bicarbonate concentrations and neutral pH.<br />
Several studies <strong>of</strong> low-temo<br />
perature «50 C)<br />
ground waters in contact with felsic rocks or sediment derived<br />
from <strong>the</strong>se rocks have shown that silica concentration is a function <strong>of</strong><br />
dissolved carbon dioxide concentration following <strong>the</strong> reaction in equation 1<br />
(Garrels, 1967; Garrels and MacKenzie, 1967; Paces, 1972).<br />
64
Equation (1)<br />
Alumino-silicate + H 2<br />
C0 3<br />
(solid)<br />
Cations + HC0 3<br />
+ Si (OH)4 + kaolinite<br />
(solid)<br />
where H 2<br />
C0 3<br />
= CO (g) 2<br />
+ H29<br />
Si (HO)4 is dissolved silica<br />
Comparisons <strong>of</strong> calculated dissolved carbon dioxide concentrations with silica<br />
concentrations in all three types <strong>of</strong> ground water in <strong>the</strong> Cactus Flat-Artesia<br />
area suggest that a steady-state disequilibrium with alumino-silicates and<br />
quartz has a more important influence on silica concentration than does temperature-dependent<br />
equilibrium with quartz (Figure 24).<br />
Calculation <strong>of</strong> dissolved<br />
carbon dioxide was accomplished using equation (2) from Paces (1972).<br />
Equation (2)<br />
-log pC0 2<br />
= pH-log HC0 - 3<br />
7.689 - (4.22 x lO-3T) - (3.54 x lO-5T2)<br />
where T = Temperature<br />
a<br />
C<br />
and concentration :<br />
activity<br />
Silica analyses were corrected for ionization at higher pH because analyses<br />
report total silica.<br />
Silica (Si(OH)4) derived from dissolution <strong>of</strong> quartz<br />
or alumino-silicates dissociates to form SiO (OH);, which at higher pH becomes<br />
an important form <strong>of</strong> dissolved silica.<br />
The following equation is used to<br />
correct for silica ionization:<br />
Equation (3)<br />
log Si (OH)4<br />
corrected<br />
log Si (OH)4<br />
analyzed<br />
log Si (OR);<br />
dissociated<br />
where log Si (OH);<br />
equation (4)<br />
and concentration ~<br />
= - 720.15 - 7.3 + pH + log Si (OH)4<br />
273.15 + TOC<br />
analyzed<br />
activity<br />
Equation (4) is derl\Ted in Appendix 2.<br />
65
-2.0<br />
/<br />
15·<br />
/<br />
/<br />
-2.5<br />
-3.5<br />
-4.0 ·27<br />
.25 /<br />
/<br />
/<br />
/<br />
•<br />
/<br />
• 34<br />
/<br />
.26 .1<br />
28 .2<br />
• 21<br />
CORRELATION<br />
SLOPE<br />
INTERCEPT<br />
0.6998<br />
1.5157<br />
3,18<br />
-4.5-1--......:.-..-.....,.-----"'T""'------r------r---'"<br />
-5.0 -4.5 -4.0 -3.5<br />
LOG Si(OH)4<br />
Excess Silica<br />
INCREASING ACTIVITY (CONCENTRATlON)I------.......<br />
-3.0<br />
Figure 24.<br />
Dissolved carbon dioxide versus excess silica <strong>of</strong><br />
ground water in Cactus Flat-Artesia area.<br />
66
Silica concentration in Figure 24 is in excess <strong>of</strong> <strong>the</strong> concentration<br />
predicted by equilibrium at well discharge temperature for solid silica<br />
species, quartz, chalcedony or alpha-cristobalite.<br />
Excess silica is determined<br />
by subtracting pH-corrected silica from <strong>the</strong> largest predicted concentrations<br />
<strong>of</strong> <strong>the</strong> three species that <strong>the</strong> pH-corrected concentration exceeds.<br />
Silica<br />
disequilibrium generally increases with carbon dioxide concentration.<br />
Samples 24, 25, and 27 may have equilibrated with chalcedony.<br />
These later<br />
waters have low pC0 2<br />
concentrations and high pH.<br />
Waters with high carbon<br />
dioxide concentrations readily attack alumino-silicate minerals, releasing<br />
silica to solution faster than it (dissolved silica) can equilibrate with<br />
quartz or chalcedony.<br />
The dissolved carbon dioxide content <strong>of</strong> shallow sodium bicarbonate<br />
waters is introduced by meteoric waters whose initial carbon dioxide content<br />
is in equilibrium with <strong>the</strong> atmosphere.<br />
Because <strong>the</strong> artesian ground waters<br />
are in contact with gypsum (hence <strong>the</strong>ir high sulfate contents) and probably<br />
carbonate minerals such as calcite, <strong>the</strong>ir dissolved carbon dioxide content<br />
may be controlled by carbonate equilibria in a system closed to additional<br />
atmospheric carbon dioxide where gypsum and calcite are both available in<br />
sufficient quantities for saturation or near saturation to occur.<br />
Ion exchange<br />
on clay minerals between calcium and sodium may also influence carbonate<br />
equilibria.<br />
Meteoric water recharging shallow aquifers near <strong>the</strong> Pinaleno Mountain<br />
front has high carbon dioxide content, which attacks alumino-silicate minerals<br />
to form sodium bicarbonate chemistry water and a solid residue (kaolinite).<br />
As <strong>the</strong> ground water flows deeper and outward into <strong>the</strong> confined aquifers in <strong>the</strong><br />
green clay facies, evaporite minerals in <strong>the</strong> clay dissolve to transform <strong>the</strong><br />
67
sodium bicarbonate waters into sodium chloride-sulfate water.<br />
Since <strong>the</strong><br />
sodium chloride-sulfate waters may be saturated with gypsum and calcite, <strong>the</strong><br />
calcium concentration is probably regulated by carbonate equilibria and probably<br />
ion exchange with sodium in <strong>the</strong> clay.<br />
Therefore, <strong>the</strong> Na-K-Ca geo<strong>the</strong>rmometer<br />
is useless in this area to predict <strong>geo<strong>the</strong>rmal</strong> <strong>potential</strong>.<br />
Likewise,<br />
silica concentration in <strong>the</strong>se ground waters is not controlled by temperaturedependent<br />
solution <strong>of</strong> quartz, but ra<strong>the</strong>r by dissolution <strong>of</strong> alumino-silicate<br />
minerals.<br />
Therefore, silicageo<strong>the</strong>rmometry is not applicable.<br />
Conclusion<br />
Temperature and depth data for flowing wells in <strong>the</strong> Cactus Flat-Artesia<br />
o<br />
area show a background temperature gradient <strong>of</strong> 45 C/km.<br />
Continuation <strong>of</strong> a<br />
45 0 C/km gradient to 1 km depth may be reasonable because resistivity data indicate<br />
at least 1 km <strong>of</strong> clayey and silty <strong>basin</strong>-fill sediments.<br />
Anomalous temperature gradients in D-6-26-32 and 33 may indicate <strong>potential</strong><br />
o<br />
for intermediate-temperature <strong>resource</strong>s (100 to 120 C).<br />
Because no well information<br />
is available south <strong>of</strong> this area, <strong>the</strong> extent <strong>of</strong> high-temperature<br />
gradients can only be inferred.<br />
A mercury soil survey in this area suggests<br />
<strong>the</strong> anomaly extends several miles to <strong>the</strong> south along U.S. Highway 666.<br />
In<br />
this area, anomalous mercury concentrations are observed, which may indicate<br />
mercury gas leakage from a <strong>geo<strong>the</strong>rmal</strong> system.<br />
The highest mercury concentrations<br />
occur where geologic evidence points toward major structural intersections.<br />
Heat flow studies are needed to evaluate <strong>the</strong> mercury and temperature<br />
gradient anomalies.<br />
All <strong>of</strong> this area has considerable <strong>potential</strong> for<br />
direct use <strong>of</strong> low-temperature <strong>geo<strong>the</strong>rmal</strong> water (30 to lOoC)<br />
from wells 150 m<br />
to 1.2 km depth.<br />
68
San Simon<br />
Introduction<br />
The San Simon area lies astride Interstate 10 in <strong>the</strong> sou<strong>the</strong>rn Safford-<br />
San Simon Basin and includes <strong>the</strong> small farming and railroad community <strong>of</strong><br />
San Simon.<br />
Prior to extensive ground water withdrawal and attendant water table<br />
lowering, <strong>the</strong> area had numerous <strong>the</strong>rmal artesian wells, which were used for<br />
irrigating crops.<br />
Because <strong>the</strong> upper static water table was relatively deep<br />
and <strong>the</strong> means for pumping from this aquifer was not feasible during <strong>the</strong> early<br />
1900s, deep wells were drilled to tap an artesian aquifer, which was discovered<br />
during drilling for water by <strong>the</strong> Sou<strong>the</strong>rn Pacific Railroad.<br />
Schwennessen<br />
(1917) studied <strong>the</strong> geohydrology in this area and published data on <strong>the</strong>se artesian<br />
wells.<br />
Thermal Regime<br />
Schwennessen's data are used to determine <strong>the</strong> <strong>the</strong>rmal regime <strong>of</strong> <strong>the</strong> area<br />
prior to extensive ground water withdrawal. Figure 25 is a plot <strong>of</strong> well depth<br />
versus surface discharge temperature <strong>of</strong> artesian wells reported by Schwennessen<br />
(1917).<br />
Wells with flow rates less than 10 gpm and an artesian head less than<br />
3 m above <strong>the</strong> surface are not used. A linear relationship between <strong>the</strong> well<br />
depths and <strong>the</strong> measured discharge temperatures exists, which has a slope or<br />
temperature gradient <strong>of</strong> 46.6°C/km.<br />
o<br />
The surface intercept temperature is 18.5 C,<br />
which is close to <strong>the</strong> mean annual temperature, l7 o C.<br />
In <strong>the</strong> San Simon area,<br />
<strong>the</strong>se data indicate <strong>the</strong> general <strong>the</strong>rmal regime <strong>of</strong> <strong>the</strong> <strong>basin</strong> is created by conductive<br />
flow <strong>of</strong> heat through <strong>the</strong> <strong>basin</strong>-filling sediments.<br />
This means that <strong>the</strong><br />
temperature <strong>of</strong> <strong>the</strong> confined aquifers increases systematically with depth.<br />
69
1000<br />
AVERAGE TEMPERATURE GRADIENT OF THE SAN<br />
, SIMON AREA USING ARTESIAN WELL DATA FROM<br />
\<br />
• \<br />
SCHWENNESEN, 1917 AND ASSUMING DISCHARGE<br />
TEMPERATURE IS BOTTOM HOLE TEMPERATURE<br />
, ,,<br />
•<br />
-en a:<br />
w<br />
I W<br />
~-..J<br />
W<br />
><br />
W<br />
..J<br />
«<br />
w900 en<br />
w<br />
> oaJ<br />
«<br />
J:<br />
I<br />
a.<br />
w<br />
c<br />
•<br />
..<br />
•<br />
•<br />
•<br />
•<br />
•<br />
•<br />
•<br />
Slope 46.6 °C/km<br />
Sea level temperature 70.44°C ,<br />
Approximate surface temperature IS.5°C (3650"<br />
Mean annual temperature I'ZO° C "<br />
COffe/ation QS2527 ,<br />
·Well with flow rate greater than 10 gpm "<br />
and head greater tt,an 10 feet. \<br />
\<br />
\<br />
800 \<br />
\<br />
22 23 24 25 26 27 28 29 30 31 32 33 34 35<br />
TEMPERATURE (OC)<br />
Figure 25.<br />
Temperature versus depth data for artesian wells<br />
in <strong>the</strong> San Simon area.<br />
70
Geology<br />
Subsurface geology controls <strong>the</strong> distribution <strong>of</strong> <strong>the</strong> confined aquifers.<br />
These confined aquifers are contained in permeable sediment, which is overlain<br />
by an impermeable cap rock.<br />
Drillers' logs <strong>of</strong> <strong>the</strong> San Simon area were<br />
interpreted to delineate subsurface stratigraphy and locate <strong>the</strong> thickness and<br />
lateral extent <strong>of</strong> <strong>the</strong> confining cap rock.<br />
In <strong>the</strong> San Simon area, artesian wells<br />
tap water contained in <strong>san</strong>d and gravels, which are below a blue clay.<br />
This<br />
blue clay is probably correlative with <strong>the</strong> green clay facies <strong>of</strong> Harbour (1966)<br />
at Safford.<br />
Fortunately, <strong>the</strong> blue clay is easily distinguished from o<strong>the</strong>r<br />
<strong>basin</strong>-filling sediments; as a result, drillers' logs are highly useful in mapping<br />
its subsurface extent and thickness. Figure 26 is a structure contour map<br />
at <strong>the</strong> base <strong>of</strong> <strong>the</strong> blue clay.<br />
The blue clay is deposited in a wedge-shaped<br />
depositional <strong>basin</strong> bounded by steep structure contours oriented NNW<br />
and WNW.<br />
A structure contour map <strong>of</strong> <strong>the</strong> top <strong>of</strong> <strong>the</strong> blue clay (Figure Zn exhibits <strong>the</strong><br />
same geometry as that seen at <strong>the</strong> base <strong>of</strong> <strong>the</strong> blue clay except that <strong>the</strong> contours<br />
delineating <strong>the</strong> margins <strong>of</strong> <strong>the</strong> deposition <strong>basin</strong> are not as steep.<br />
The<br />
closure over <strong>the</strong> lowest elevation at <strong>the</strong> top <strong>of</strong> <strong>the</strong> blue clay is displaced to<br />
<strong>the</strong> south from <strong>the</strong> site <strong>of</strong> <strong>the</strong> lowest elevation at <strong>the</strong> base <strong>of</strong> <strong>the</strong> blue clay;<br />
<strong>the</strong> closure is adjacent to steep contours oriented WNW.<br />
The well showing <strong>the</strong><br />
lowest elevation for <strong>the</strong> top <strong>of</strong> <strong>the</strong> blue clay records a significant evaporite<br />
occurrence. At this location, evaporites overlie <strong>the</strong> blue clay. The evaporite<br />
sequence may represent deposition during <strong>the</strong> dessication <strong>of</strong> a lake in<br />
closed <strong>basin</strong> conditions.<br />
Structural and tectonic inferences are tentatively drawn from <strong>the</strong> structural<br />
contour maps.<br />
The steep structure contours <strong>of</strong> <strong>the</strong> blue clay may correlate<br />
with faults that control <strong>the</strong> location <strong>of</strong> <strong>the</strong> depositional <strong>basin</strong>.<br />
In<br />
addition, faulting contemporaneous with dessication <strong>of</strong> a late Tertiary lake<br />
71
.- ... -<br />
-<br />
~<br />
0 ,<br />
~<br />
."<br />
17 to ~,<br />
'. ..<br />
" -" "<br />
2' j ELEVATION AT THE BASE OF THE "BLUE CLAY"<br />
Elevation above sea level (Feet).<br />
o<br />
I Mile<br />
L.'__---'I<br />
" - ' .<br />
...<br />
"<br />
Figure 26.<br />
Structure contour map <strong>of</strong> <strong>the</strong> base <strong>of</strong> <strong>the</strong> blue<br />
clay unit in San Simon area.-<br />
72
"<br />
"<br />
'"",.-<br />
~---<br />
,....~,<br />
~. 7 '1.v-~.<br />
, -f"'~ 0<br />
.s'<br />
••••• :;;~ I<br />
"'~<br />
10 ~;,<br />
11 .11<br />
r',<br />
L<br />
I<br />
.8 1-<br />
17<br />
\~<br />
u<br />
----- " y .y<br />
" ~<br />
ELEVATION AT THE BASE OF THE "BLUE CLAY"<br />
Elevation above sea level (Feet~<br />
...<br />
lḄ...<br />
"<br />
0 IMile<br />
I<br />
3600<br />
\ 3614-<br />
\<br />
.,<br />
,. ..<br />
,~,<br />
"<br />
\~~_.<br />
...<br />
·3590<br />
'26 ry '"<br />
.'~<br />
1"~111l<br />
'0<br />
+N<br />
I<br />
Figure 27.<br />
Structure contour map <strong>of</strong> <strong>the</strong> top <strong>of</strong> <strong>the</strong> blue<br />
clay unit in <strong>the</strong> San Simon area.<br />
73
may displace <strong>the</strong> last remnants <strong>of</strong> this lake to <strong>the</strong> location adjacent to <strong>the</strong><br />
~~W-oriented structure contours, <strong>the</strong>reby localizing <strong>the</strong> evaporite sediments.<br />
As an analogy, sag ponds or small lakes sometimes occur on <strong>the</strong> downthrown<br />
block adjacent to large Holocene faults.<br />
Geohydrology<br />
The blue clay apparently influences <strong>the</strong> geohydrology <strong>of</strong> <strong>the</strong> area.<br />
Figure<br />
28 is a piezometric surface map <strong>of</strong> <strong>the</strong> confined aquifer.<br />
The shape <strong>of</strong><br />
<strong>the</strong> piezometric surface coincides with <strong>the</strong> shape <strong>of</strong> <strong>the</strong> structure contour<br />
map at <strong>the</strong> base <strong>of</strong> <strong>the</strong> blue clay.<br />
Steep contours on <strong>the</strong> piezometric surface<br />
map indicate a damming effect on subsurface water flow to create rapidly<br />
changing hydraulic pressure.<br />
Low-permeability sediments or an impermeable<br />
fault zone can cause ground water falls or steep hydraulic gradients.<br />
Because<br />
<strong>the</strong> blue clay thickens rapidly at <strong>the</strong>se ground water falls, it is believed<br />
that ground water flow is forced downward beneath <strong>the</strong> low-permeability<br />
blue clay.<br />
Estimated average temperature gradients <strong>of</strong> individual wells, using surface<br />
discharge temperature, mean annual temperature and well depth, are plotted<br />
in Figure 29.<br />
Wells with temperature gradients less than 40 o C/km coincide with<br />
ground water falls.<br />
Downward-flowing water would transport heat, causing lower<br />
temperature gradients.<br />
Chemistry<br />
Most <strong>the</strong>rmal waters encountered in artesian wells are sodium bicarbonate<br />
composition.<br />
In <strong>the</strong> nor<strong>the</strong>rn portion <strong>of</strong> <strong>the</strong> study area, sodium chloridesulfate<br />
water with TDS up to 5,400 mg/l is encountered. Fluoride and boron<br />
contents <strong>of</strong> <strong>the</strong>se later waters are exceptionally high, with fluroide concentrations<br />
over 25 mg/l.<br />
74
o<br />
1 Mile<br />
'2,<br />
WATER LEVEL OF WELLS IN THE SAN SIMON AREA, 1915<br />
3698 Water level above sea level, elevation in feet<br />
•<br />
>-<br />
-;'6-~-'~~<br />
~,<br />
Figure 28.<br />
Map <strong>of</strong> water level <strong>of</strong> artesian wells in <strong>the</strong> San<br />
Simon area in 1915.<br />
75
',~<br />
---...-..--_.-<br />
.-<br />
Figure 29.<br />
Estimated temperature gradients <strong>of</strong> artesian wells<br />
in <strong>the</strong> San Simon area in 1915.<br />
76
Conclusion<br />
Geo<strong>the</strong>rmal <strong>potential</strong> at depths greater than 1 km in <strong>the</strong> San Simon area<br />
may be good.<br />
In 1938 a deep oil and gas test, <strong>the</strong> Bunk Benevolent 1 Fee,<br />
was completed to 2,032 m depth.<br />
In a 1940 memorandum, E.D. Wilson <strong>of</strong> <strong>the</strong><br />
Arizona Bureau <strong>of</strong> Mines gave an account <strong>of</strong> a visit to this well site where<br />
he was told that 134°C water was encountered in <strong>the</strong> lower 100 m <strong>of</strong> <strong>the</strong> hole<br />
(see Appendix 3).<br />
If this temperature accurately describes bottom conditions,<br />
<strong>the</strong> estimated temperature gradient is 57 o C/km.<br />
This temperature gradient is<br />
above <strong>the</strong> 46.6°C/km average, estimated using shallow (300 m) well data.<br />
Because <strong>the</strong> oil test gradient is above normal, lies in a possible fault zone<br />
(in a zone <strong>of</strong> steep WNW-trending structural contours <strong>of</strong> <strong>the</strong> blue clay) and<br />
reportedly encountered water at 2 km depths, <strong>the</strong> San Simon area may have good<br />
<strong>potential</strong> for 1 to 2.5 km depth <strong>geo<strong>the</strong>rmal</strong> <strong>resource</strong>s between 100 and 140 o C.<br />
77
Bowie Area<br />
Introduction<br />
At least 20 irrigation wells in <strong>the</strong> area surrounding Bowie pump 30 to<br />
37°C water from depths <strong>of</strong> 183 to 610 m (Table 1, Figure 1). Chemical quality<br />
<strong>of</strong> <strong>the</strong> <strong>the</strong>rmal water is good; TDS <strong>of</strong> <strong>the</strong>se waters ranges mostly between 250<br />
and 500 mg/l (Table 2). Fluoride concentrations are generally less than 3.0<br />
mg/l; although a few wells produce water with fluoride over 7.0 mg/l.<br />
These<br />
<strong>the</strong>rmal waters are useful for irrigation and a few are suitable for drinking<br />
because <strong>the</strong>ir fluoride contents are less than 1.4 mg/l.<br />
Geochemistry<br />
A wide variation <strong>of</strong> dissolved constituents occurs in <strong>the</strong> <strong>the</strong>rmal waters<br />
at Bowie.<br />
Most <strong>of</strong> <strong>the</strong>se waters are ei<strong>the</strong>r sodium bicarbonate or sodium chloridesulfate<br />
chemistry, and <strong>the</strong>y have no readily distinguishable correlation among<br />
chemical type and measured temperature.<br />
This may indicate that <strong>the</strong> variability<br />
in compositions is due to contact <strong>of</strong> <strong>the</strong>se waters with different kinds <strong>of</strong> rock<br />
in shallow «600 m)<br />
aquifers.<br />
Chemical geo<strong>the</strong>rmometer calculations are also highly variable; <strong>the</strong>rmal<br />
waters which have very low calcium and magnesium concentrations have <strong>the</strong> highest<br />
Na-K-Ca geo<strong>the</strong>rmometer temperatures (Table 3).<br />
Waters with relatively very<br />
low magnesium concentrations are frequently associated with <strong>the</strong> higher temperature<br />
zones <strong>of</strong> known <strong>geo<strong>the</strong>rmal</strong> systems (Ellis and Mahon, 1977).<br />
The<br />
sodium bicarbonate chemistry <strong>of</strong> <strong>the</strong>se waters suggests that <strong>the</strong> reservoir is<br />
contained in basement rock composed <strong>of</strong> ei<strong>the</strong>r fractured volcanic or felsic<br />
crystalline rocks.<br />
A deep reservoir temperature <strong>of</strong> l24°C is inferred by <strong>the</strong><br />
Na-K-Ca geo<strong>the</strong>rmometer.<br />
In o<strong>the</strong>r waters, all <strong>of</strong> which have relatively high<br />
calcium concentration and which are trending toward sodium chloride-sulfate<br />
o<br />
chemistry, <strong>the</strong> calculated Na-K-Ca temperatures are all below 95 C.<br />
The Na-K-Ca<br />
78
geo<strong>the</strong>rmometry for waters containing higher calcium, chloride, and sulfate<br />
concentrations are believed unreliable due to possible mixing, dissolution <strong>of</strong><br />
gypsum,<br />
and cation exchange reactions with clay in <strong>the</strong> <strong>basin</strong>-fill sediments.<br />
Na-K-Ca geo<strong>the</strong>rmometry assumes that temperature-dependent equilibrium with<br />
silicate minerals in <strong>the</strong> reservoir has occurred and that no additional reactions<br />
have changed <strong>the</strong> ratios <strong>of</strong> sodium, potassium, and calcium after <strong>the</strong><br />
<strong>the</strong>rmal water leaves <strong>the</strong> deep reservoir (Fournier and o<strong>the</strong>rs, 1974).<br />
Figure<br />
30 is a map <strong>of</strong> <strong>the</strong> Bowie area showing <strong>the</strong> distribution <strong>of</strong> <strong>the</strong> Na-K-Ca geo<strong>the</strong>rmometer<br />
temperatures.<br />
Wells with <strong>the</strong> highest Na-K-Ca temperatures may<br />
overlie fractured basement, which is leaking <strong>the</strong>rmal water into shallow<br />
«600 m) aquifers. Additional studies are required to confirm <strong>the</strong> high Na-K<br />
Ca geo<strong>the</strong>rmometer temperatures obtained using <strong>the</strong> low magnesium,<br />
sodium bicarbonate<br />
waters because <strong>the</strong> sodium, potassium and calcium ratios may also<br />
reflect shallow nontemperature-dependent dissolution <strong>of</strong> silicate minerals<br />
in a high dissolved carbon dioxide environment (Paces, 1975).<br />
Structure and Stratigraphy<br />
Geophysical studies by Eaton (1972)<br />
and drillers' logs provide a basis<br />
to describe <strong>the</strong> subsurface geology in <strong>the</strong> Bowie area.<br />
Eaton (1972) published<br />
a subsurface model <strong>of</strong> structure based upon an accompanying gravity pr<strong>of</strong>ile.<br />
Figure 31 shows Eaton's structural model and gravity pr<strong>of</strong>ile.<br />
His pr<strong>of</strong>ile<br />
locations are shown in Figure 32, Gravity interpretation by Eaton (1972) shows a<br />
graben, which is about five miles wide and filled with up to 760 m <strong>of</strong> clastic<br />
sediment.<br />
Tertiary volcanic rock, 300 to 600 m thickness, are modeled to<br />
underlie <strong>the</strong> <strong>basin</strong>-fill sediments.<br />
Drillers' logs published in 'fuite (1963) and White and Smith (1965) show<br />
<strong>the</strong> stratigraphy <strong>of</strong> <strong>the</strong> upper portion <strong>of</strong> <strong>the</strong> <strong>basin</strong>-filling sediments in <strong>the</strong><br />
Bowie graben (see drillers' logs in <strong>the</strong> appendix),<br />
A "blue clay" strata,<br />
79
MAP SHOWING DISTRIBUTION OF Na-K-Ca GEOTHERMOMETER TEMPERATURES - BOWIE AREA<br />
')<br />
to<br />
10 .' \<br />
\<br />
~."<br />
"n<br />
',.<br />
21 \<br />
" ;!i<br />
"'-:<br />
;-<br />
....
GRAVITY MODEL OF THE BOWIE AREA<br />
Modified from Eaton, 1972.<br />
Location <strong>of</strong> Gravity Pr<strong>of</strong>ile Shown in Figure 32<br />
o A<br />
A'<br />
LITHOLOGY<br />
DENSITY<br />
c:=J f=2.259/cm 3<br />
~ 500<br />
~<br />
Q)<br />
~ 1000<br />
.s=<br />
a.<br />
~ 1500-<br />
2000<br />
-15LI-__-<br />
West<br />
OBSERVED<br />
GRAVITY~<br />
MODEL<br />
~GRAVITY<br />
East<br />
++++++++++\\<br />
+ + + + + + + + + +.v<br />
+ + + + + + + + + +\<br />
++++++++++\<br />
++++++++++<br />
+++++++++++<br />
+++++++++++++<br />
~~~++++++++++++++<br />
+++++++++++++ I<br />
+++ ++++++++++++++<br />
+++++++++++++++++++<br />
++ +++++++++++++++++++<br />
++++++++++++++++++++++<br />
+ + VERTICAL EXAGGERATION 5.28 + + +<br />
LATE TERIARY- QUATE RNARY<br />
BASIN FILL SEDI MENT<br />
[=2.70 9/cm3<br />
PRE-TERTIARY BASEMENT<br />
FAULT ARROW ON<br />
DOWN<br />
DROPPED<br />
SIDE<br />
o<br />
o<br />
!<br />
5 Mil••<br />
I<br />
5 Kilom.t...<br />
,<br />
Figure 31. A gravity subsurface model <strong>of</strong> <strong>the</strong> Bowie area.<br />
81
(X)<br />
N<br />
BOUGUER GRAVITY MAP OF BOWIE' AREA WITH<br />
WATER FALLS AND PROFILE USED TO MODEL<br />
'I I<br />
,/:~----7~\-~;iR<br />
... ~«-- .I<br />
_t\/\>~ . /<br />
):fte1lC1-~ •<br />
r~~I<br />
l~,~':J<br />
, -,,,.<br />
fi~~?\:- -~-J<br />
,<br />
1\ C' .<br />
-:?'~4 ./1<br />
.; ';' '.ii.,~'b \"<br />
{<br />
- ' j 1,\<br />
\1<br />
,I "'/,\ \<br />
-"r I,<br />
'<br />
",,'<br />
J<br />
,~..~. II _ .. " ~.l'~<br />
, .~.<br />
t--"-'--t-'<br />
1 \ I~I W~-ldl'ljI:<br />
\ I<br />
t~v><br />
Center<br />
LOCATIONS OF GROUND<br />
SUBSURFACE STRUCTURE<br />
GA<br />
<strong>of</strong> Bouguer Gravity<br />
Anomaly East <strong>of</strong> BOWIe<br />
Bouguer Gravity contour<br />
Contour interval is 5 mi lIigals<br />
1975, Ground-water fall (See<br />
Figure 34, Ground-water Table<br />
Map <strong>of</strong> <strong>the</strong>.Bowie area,)<br />
A<br />
AI<br />
Gravity pr<strong>of</strong>ile used to model<br />
subsurface geology, (See Figure 31<br />
Gravity<br />
DATA<br />
Model <strong>of</strong> Bowie Area.)<br />
SOURCES:<br />
(I) 'GRAVITY-Wynn and Dansereau, 1979.<br />
(2) PROFI LE - Eaton t<br />
1972.<br />
(3}GROUND-WATER TABLE -Information<br />
for 1975 j Wilson and White, 1976.<br />
BASE:<br />
N<br />
--160-<br />
-r-<br />
US, Geological Survey 1:25Q!000, Silver City, 1970,<br />
SCALE: 1:250,000 0 6 Miles<br />
I I I « , I I<br />
Figure 32.<br />
Bouguer gravity map <strong>of</strong> Bowie area compared to' locations <strong>of</strong> ground-water falls.
TRANSVERSE TOPOGRAPHIC PROALES ACROSS THE<br />
SAN SIMON VALLEY<br />
AFTER EATON, 1972<br />
330'r----16----------rT---'~ 8 _<br />
• Willcox<br />
e;,<br />
A<br />
•<br />
Bowie<br />
Duncan:<br />
a<br />
~<br />
':~<br />
I~<br />
~,~<br />
4l:1<br />
~I<br />
ll::,<br />
"1:,<br />
I<br />
Lordsburg'l<br />
3~1...-----------~""-----<br />
o<br />
25 Mil••<br />
I I I<br />
25Kllom.'."<br />
o<br />
I ! I I ! I<br />
.....<br />
r<br />
r<br />
.J ARROWS POINT TO CONVEX<br />
~5 $ C TOPOGRAPHY<br />
~4 sri<br />
3 st'IIIII<br />
~<br />
2<br />
VERTICAL EXAGGERATION<br />
X26<br />
METERS<br />
122[<br />
61~<br />
o 2 4MILES<br />
ALL PROFILES EXCEPT 4 AND 5 SHOW CONCAVITY.<br />
PROFILES 4 AND 5 CROSS GRAVITY ANMOMALY (GA) SHOWN<br />
IN FIGURE 32<br />
Figure 33.<br />
Topographic pr<strong>of</strong>iles across <strong>the</strong> San Simon Valley.<br />
83
1975, GROUND-WATER TABLE MAP OF THE BOWIE, ARIZONA AREA After Wilson and White (1976).<br />
........<br />
,.. I."ll-"<br />
'.-;.<br />
/<br />
" /<br />
I<br />
I<br />
.~ I<br />
" I<br />
....<br />
"J<br />
\<br />
\<br />
\<br />
31 ~'"<br />
1 "<br />
"'"<br />
32<br />
l I... t~~~l "<br />
\<br />
, ,.<br />
rio /<br />
. 0. --;-.<br />
N<br />
-)-<br />
2Mil..<br />
6===='===='1<br />
'00-<br />
___ "!>~<br />
Groundwater table elevation<br />
contaur (in feet abave sea level!<br />
Figure 34. Map <strong>of</strong> water table in <strong>the</strong> Bowie area in 1975.<br />
84
probably correlative with <strong>the</strong> "blue clay" at San Simon and possibly <strong>the</strong> green<br />
clay facies <strong>of</strong> Harbour (1967) at Safford, overlies water-bearing <strong>san</strong>d and<br />
gravel.<br />
The blue clay is over 120 m thick in a well two miles nor<strong>the</strong>ast <strong>of</strong><br />
Bowie, but it pinches out or thins considerably near Interstate 10.<br />
South<br />
<strong>of</strong> Interstate 10 <strong>the</strong> blue clay is absent or very thin «15 m).<br />
The blue<br />
clay is an aquaclude; and ground water below <strong>the</strong> clay had artesian pressure<br />
before extensive ground water development in <strong>the</strong> area lowered <strong>the</strong> water table<br />
(piezometric surface) in <strong>the</strong> deeper aquifers (White, 1963).<br />
By 1975, ground water pumpage had created a ground water depression beneath<br />
this area (Wilson and White,1975).<br />
Zones <strong>of</strong> steep water table contours<br />
on <strong>the</strong> west, south and east sides <strong>of</strong> <strong>the</strong> depression may indicate zones <strong>of</strong> lower<br />
permeability caused by faults (Figure 34).<br />
These ground water falls roughly<br />
correspond with <strong>the</strong> margins <strong>of</strong> <strong>the</strong> graben as deduced from Bouguer gravity<br />
data (Figure 33).<br />
Active Tectonism<br />
Recent tectonic deformation is inferred in <strong>the</strong> Bowie area.<br />
While no<br />
Recent or Quaternary fault scarps are identified in <strong>the</strong> Bowie area, studies<br />
by Eaton (1972) and Holzer (1980) point towards tectonic uplift, during<br />
Recent time, <strong>of</strong> <strong>the</strong> horst bounding <strong>the</strong> east side <strong>of</strong> <strong>the</strong> Bowie graben.<br />
Eaton<br />
(1972) presents first-order leveling data, which shows uplift, between 1902<br />
and 1952, <strong>of</strong> this horst relative to bedrock benchmarks on ei<strong>the</strong>r side <strong>of</strong> <strong>the</strong><br />
San Simon <strong>basin</strong>.<br />
In addition, Eaton (1972) discusses topographic pr<strong>of</strong>iling<br />
in <strong>the</strong> Safford-San Simon <strong>basin</strong> (Figure 33).<br />
All pr<strong>of</strong>iles except those traversing<br />
<strong>the</strong> Bowie area are concave, while <strong>the</strong> Bowie topographic pr<strong>of</strong>iles are<br />
convex.<br />
The anomalous convex Bowie pr<strong>of</strong>iles could be interpreted as evidence<br />
<strong>of</strong> tectonic uplift (Eaton, 1972).<br />
Holzer (1980) has mapped earth fissures and cracks, resulting from sub-<br />
85
sidence that was created by ground water removal.<br />
Additional leveling data<br />
reported by Holzer (1980) show up to 1.25 m <strong>of</strong> subsidence since 1972 over<br />
<strong>the</strong> graben, but no net uplift over <strong>the</strong> horst.<br />
However, Holzer (1980) pointed<br />
out that aerial photographs taken in 1935 over <strong>the</strong> Bowie area show many polygonal<br />
earth fissures over <strong>the</strong> horst. No significant ground water withdrawal occurred<br />
before 1935; <strong>the</strong>refore, <strong>the</strong>se fissures may not be subsidence related.<br />
As to<br />
whe<strong>the</strong>r or not <strong>the</strong> 1935 earth fissures are definitely related to uplift <strong>of</strong><br />
<strong>the</strong> horst, it is speculative, because earth fissuring in many areas <strong>of</strong> sou<strong>the</strong>astern<br />
Arizona is reported by DuBois and Smith (1981) during <strong>the</strong> 1887 Sonoran<br />
earthquake.<br />
Therefore, <strong>the</strong> fissures seen in 1935 photographs may have originated<br />
during <strong>the</strong> Sonoran earthquake and may not indicate local tectonism.<br />
Conclusion<br />
A spatial coincidence <strong>of</strong> wells, producing sodium bicarbonate water with<br />
low magnesium, high Na-K-Ca geo<strong>the</strong>rmometers, and an apparent structural intersection,<br />
which is inferred from ground water falls and gravity data, support<br />
<strong>the</strong> hypo<strong>the</strong>sis that a deep (>2 km)<br />
moderate-temperature <strong>geo<strong>the</strong>rmal</strong> reservoir<br />
o<br />
(~124 C) occurs south <strong>of</strong> Bowie. Well D-13-28-l5DCC, which has <strong>the</strong> highest Na-<br />
K-Ca temperature (124°C), is <strong>the</strong> most anomalous well from a temperature and<br />
depth standpoint.<br />
o<br />
This well, 145 m deep, has a discharge temperature <strong>of</strong> 35 C<br />
and an estimated average temperature gradient <strong>of</strong> l24°C/km.<br />
All o<strong>the</strong>r wells in<br />
<strong>the</strong> area have estimated temperature gradients between 30 and 80 o C/km and a mean<br />
temperature gradient <strong>of</strong> 49 0 C/km.<br />
Fur<strong>the</strong>r studies are advised before drilling a deep test into this possible<br />
deep reservoir.<br />
Heat flow studies and geochemical modeling are needed to site<br />
a deep hole.<br />
A shallow «600 m) <strong>geo<strong>the</strong>rmal</strong> <strong>resource</strong> does exist at B~wie and it has a<br />
reservoir temperature ranging between 35 and 45 0 C.<br />
The <strong>geo<strong>the</strong>rmal</strong> water has<br />
86
excellent chemical quality suitable for most agricultural uses.<br />
Aquaculture,<br />
greenhouses, and space heating are <strong>potential</strong> uses <strong>of</strong> this water.<br />
87
Whitlock Mountains Area<br />
In 1927 and 1928 <strong>the</strong> Pinal Oil Company Whitlock Oil #1 State was unsuccessfully<br />
drilled for oil in D-10-28-36AD. However, <strong>the</strong> hole encountered a<br />
strong artesian flow <strong>of</strong> <strong>the</strong>rmal water (4l o C)<br />
from conglomerate below 440.4 m<br />
to total depth at 586.7m.<br />
Today artesian flow <strong>of</strong> <strong>the</strong>rmal water from<br />
this well continues.<br />
An additional oil and gas test, <strong>the</strong> Bear Springs Oil<br />
#1 Allen, formerly discharged "lukewarm" water (Knechtel, 1938). This well,<br />
drilled to 473.9m, has since been destroyed.<br />
The Badger Den well, D-10<br />
29-20AC, discharged 34.l o C water in <strong>the</strong> late 1970s (Swanberg and o<strong>the</strong>rs, 1977).<br />
Presently, this well is inoperative due to pump removal.<br />
These <strong>the</strong>rmal wells at <strong>the</strong> sou<strong>the</strong>rn terminous <strong>of</strong> <strong>the</strong> Whitlock Mountains<br />
indicate a significant low-temperature «100 o e) <strong>geo<strong>the</strong>rmal</strong> <strong>resource</strong> suitable<br />
for direct-heat use in agricultural applications.<br />
Total dissolved solids (TDS)<br />
between 1,100 and 700 milligrams per liter (mg/l) are reported for water discharging<br />
from <strong>the</strong>rmal wells in <strong>the</strong> area (Table 2).<br />
These <strong>the</strong>rmal waters are<br />
sodium chloride-sulfate composition and <strong>the</strong>y contain fluoride concentrations<br />
exceeding five mg/1 (see Table 2) •<br />
Siltstone and clay to 440m provide a confining cap rock over conglomerate<br />
aquifers in <strong>the</strong> vicinity <strong>of</strong> <strong>the</strong> Whitlock #1 well.<br />
Fractured Tertiary<br />
volcanic rock may host <strong>the</strong> <strong>the</strong>rmal aquifer for <strong>the</strong> Badger Den well.<br />
Chemical geo<strong>the</strong>rmometry, using <strong>the</strong> Na-K-Ca geo<strong>the</strong>rmometer, predicts 104<br />
o<br />
to 132 C deep subsurface temperature.<br />
Caution is advised, however, in using<br />
<strong>the</strong>se results because fur<strong>the</strong>r geochemical and geophysical studies are required<br />
to confirm a deep intermediate-temperature (100-150 o C) <strong>resource</strong>. Additional<br />
wells 457 to 610m depth are likely to encounter 40 to 50 0 C water and<br />
may produce artesian flow exceeding 200 gallons per minute.<br />
88
Table 1<br />
Wells With Measured Temperatures >30 o C In The Safford-San Simon Basin<br />
Depth Temperature<br />
Location Temperature (oC) (Meters) Gradient (oCjkm) Source<br />
D-5-24-16 CB 4803 183 166 1,4<br />
D-5-24-17 AD 48 03 183 166 4, 12<br />
D-6-24-4 CBB 47.8 18 1655 4, 12<br />
D-6-24-13 AB 58.9 1148 36 4, 5, 6<br />
D-6-25-36 CBB 46.0 660 42 4, 9, 10, 12<br />
D-7-24-17 BD 30 0 6 11 1145 4<br />
D-7-25-22 DDD 43.3 416 61 7<br />
D-7-27-1 BBA 37.8 76 260 9<br />
D-7-27-2 AAA 37.2 122 157 9<br />
D-7-27-2 ACD 38 0 0 122 164 8, 10<br />
0'1<br />
D-7-27-2 ADD 41.0 122 188 9, 12 co<br />
D-7-27-2 CC 35.6 91 193 5, 9<br />
D-7-27-11 BBB 43.5 122 209 10<br />
D-7-27-11 BBB 49.0 133 233 14<br />
D-8-25-1 DDD 36.0 213 85 5, 6<br />
D-8-25-12 AA 30.6 305 41 6<br />
D-8-25-12 AA 36 07 320 58 4, 5<br />
D-8-25-12 AAA 39.0 366 57 9, 10, 14<br />
D-8-25-12 ABA 30.0 180 67 7<br />
D-8-25-12 AC 34.4 320 51 4<br />
D-8-25-12 AD 32.2 244 58 6<br />
D-8-25-12 AD 32.2 274 52 6<br />
D-8-25-12 AD 34.4 122 134 5,9
Table 1 cont.<br />
Wells With Measured Temperatures >30 o C In The Safford-San Simon Basin<br />
Depth Temperature<br />
Location Temperature (oC) (Meters) Gradient (oC/km) Source<br />
D-8-26-7 DA 41.5 488 48 9, 10<br />
D-8-26-7 DDA 39.0 421 50 9, 14<br />
D-8-26-7 DDB 35 0 0 381 45 9, 14<br />
D-8-26-7 DDB 38.0 387 52 9, 14<br />
D-8-26-8 BDC 39 0 4 195 110 10, 16<br />
D-8-26-18 AC 33.9 274 58 6<br />
D-8-26-18 DDA 42.0 463 52 9, 10<br />
D-8-26-20 AB 30.6 213 59 6<br />
D-8-26-20 DBC 45 0 0 390 69 10, 6<br />
D-8-26-28 ABC 31 244 53 7<br />
D-8-26-32 CB 32 0 2 110 129 6<br />
D-8-26-32 DB 32 0 2 122 116 6<br />
D-8-26-32 DC 32.8 122 121 6<br />
D-8-26-33 AC 32.8 226 65 6<br />
D-8-26-33 CA 32.8 122 121 6<br />
D-8-26-33 CA 33.3 152 100 6<br />
D-8-26-33 CCC 31.0 132 99 9, 14<br />
D-8-26-6 CCB 31.0 227 57 9<br />
D-9-30-11 DD 72.2 98 553 4<br />
D-10-28-25 DD 36 0 0 474 38 4, 6, 12<br />
D-10-28-36 AAC 41.1 587 39 1, 4, 5, 6, 10, 12, 13<br />
D-10-29-20 AC 34.1 160 101 10, 15<br />
........ D-11-29-36 CBB 32.2 207 69 2, 10, 13<br />
0<br />
0"\
Table 1 cont.<br />
Wells With Measured Temperatures >30 o C In The Safford-San Simon Basin<br />
Location Temperature (oC)<br />
Depth Temperature<br />
(Meters) Gradient (oC/km) Source<br />
D-8-25-12 DA 31.4 161 83 6, 9<br />
D-8-25-12 DBD 30 213 56 7<br />
D-8-26-7 ABA 42.0 467 51 7<br />
D-8-26-7 AB 30.0 253 47 6<br />
D-8-26-7 ACC 30.0 274 44 7<br />
D-8-26-7 AC 35.0 329 52 6<br />
D-8-26-7 AC 30.0 213 56 6<br />
D-8-26-7 ADD 34 305 52 7<br />
D-8-26-7 AD 30 0 6 274 46 6<br />
D-8-26-7 ADC 32.0 243 58 9, 10, 14<br />
.-l<br />
D-8-26-7 BAA 41.5 463 51 9, 10<br />
D-8-26-7 BA 35.6 344 51 6<br />
D-8-26-7 BBB 34 262 61 6, 10<br />
D-8-26-7 BB 35.8 320 56 6<br />
D-8-26-7 BDB 32.0 335 42 7<br />
D-8-26-7 BDB 38.0 476 55 7<br />
D-8-26-7 BDB 34.4 464 35 9<br />
D-8-26-7 BDB 32.0 415 34 7<br />
D-8-26-7 BD 33.3 396 39 6<br />
D-8-26-7 BD 35 366 46 6<br />
D-8-26-7 BD 33.9 299 53 6<br />
D-8-26-7 CA 37 0 0 244 78 6, 10<br />
D-8-26-7 CD 33.9 290 55 6<br />
'"
Table 1 cont.<br />
Wells With Measured Temperatures >30 o C In The Safford-San Simon Basin<br />
Depth Temperature<br />
Location Temperature ( C) (Meters) Gradient (oC/km) Source<br />
°<br />
D-12-28-10 CCC 35.5 305 58 10, 14, 15<br />
D-12-28-22 CDC 31. 5 200 68 2, 4, 12<br />
D-12-28-23 CCC 32.2 305 47 9<br />
D-13-28-1 BB 30.0 218 55 12<br />
D-13-28-3 C 37.2 244 79 2, 4<br />
D-13-28-4 DDB 37.2 253 76 12, 13<br />
D-13-28-9 BCC 31.0 213 61 12, 13<br />
D-13-28-10 BC 36.0 305 59 9, 10<br />
D-13-28-15 CCC 31.7 139 99 9 N<br />
Cl'\<br />
D-13-29-6 CCC 31.1 255 51 12<br />
D-13-29-6 CC 31.1 214 61 4<br />
D-13-29-24 CD 40.6 293 77 5<br />
D-13-29-24 DCC 40.6 293 77 2, 8, 12, 13<br />
D-'13-29-27 ACC 33.3 311 49 3<br />
D-13-29-36 AD 43.3 305 83 11<br />
D-13-29-36 ACC 35.6 305 58 11<br />
D-13-29-36 ADC 36.7 229 82 11<br />
D-13-30-3 B 42.8 262 95 8<br />
D-13-30-3 BeC 33.5 262 59 12<br />
D-13-30-3 BDe 33.3 262 58 13<br />
D-13-30-9 ACD 34.0 274 58 5, 8, 9, 12<br />
D-13-30-11 BCC 32.2 290 49 5, 8, 12, 13<br />
D-13-30-13 A 31.1 232 56 8
Table 1 cant.<br />
Wells With Measured Temperatures >30 o C In The Safford-San Simon Basin<br />
Depth Temperature<br />
Location Temperature (oC) (Meters) Gradient (oC/km) Source<br />
D-13-30-14 DDD 32.2 284 50 5, 8, 9, 12, 13<br />
D-13-30-15 DAA 35.0 397 43 5, 8, 12, 13<br />
D-13-30-23 ACC 30.6 274 46 12, 13<br />
D-13-30-23 B 33.3 274 56 4, 8<br />
D-13-30-25 ACD 30.5 268 47 5, 12<br />
D-13-30-27 AD 134.4 1952 60 4<br />
D-13-30-30 B 40.6 284 80 8<br />
D-13-30-30 BCB 40 293 75 5, 13<br />
D-14-30-36 AA 75.6 2312 25 4<br />
('1")<br />
D-13-30-36 DDD 41. 7 610 39 3 m<br />
D-14-30-12 ADB 30.6 279 45 9, 12, 13<br />
D-14-31-16 DCC 31.6 610 22 2, 9, 12, 13<br />
D-14-31-21 BCC 32.2 217 65 9, 12, 13<br />
D-16-31-10 AA 54.4 1657 22 1, 4<br />
Sources<br />
(1) Conley, J.N., and Stacey, D.A., 1977 (10) Swanbere, C.A., and O<strong>the</strong>rs, 1977<br />
(2) DeCook, K.J., 1952 (11) Harold Wardlaw, Pres. Carom.<br />
( 3) Dut t, G. R. , and McCreary, T.W., 1970 (12) WATSTORE<br />
(4) Giardina, S, 1978 (13) White, N.D., 1965<br />
(5) Hem, J. D. , 1950 (14) This Report<br />
(6) Knechtel, M.M., 1938 (15) Wilson, R.P., and White, N.D., 1976<br />
(7) City <strong>of</strong> Safford (16) Witcher, 1979<br />
(8) Schwennesen, 1918<br />
(9) State Land Department
Table 2<br />
Chemical analysis <strong>of</strong> ground waters in <strong>the</strong> Safford~SanSimon<strong>basin</strong><br />
area<br />
Results in milligrams per liter except as noted (see data sources)<br />
Temperature in degrees celsius<br />
Remarks:<br />
S - spring<br />
W- well<br />
Data Sources: 1. Arizona Bureau <strong>of</strong> Geology and Mineral Technology<br />
2. Dutt and McCreary, 1970<br />
3. Hem, 1950<br />
4. Muller and o<strong>the</strong>rs, 1973<br />
5. Swanberg and o<strong>the</strong>rs, 1977<br />
6. Files, U.S. Geological Survey Tucson, Arizona<br />
7. White and Smith, 1965<br />
Location Key:<br />
D-3-3l-3 ADCC<br />
Quadrant<br />
Township<br />
Range Section Quarter<br />
94
Table 2A.<br />
Analyses <strong>of</strong> Gila Valley-Indian Hot Springs ground waters<br />
Number 8amp1e Location Temperature TD8 pH Na K Ca Mg c1 8°4 HC0 3<br />
+C0 3<br />
810 2<br />
Li B F Remarks Data Source<br />
Na+K<br />
1 57 D-6-25-36CBBB 46 4431 6.8 1390 13.1 64 7.6 4011 672 64 55 2.3 0.6 6.7 W 1<br />
2 53W86 D-5-24-17ADDCA 46 2967 7.5 670 13 39 7.2 1430 365 69 45 1.41 1.64 2.8 8 1<br />
3 54W80 D-5-24-17ADDDB 45 2929 7.5 540 14 38 7.1 1414 348 98 48 1.42 0.94 5.2 8 1<br />
4 55W80 D-5-24-17ADDBB 47 7.5 610 14 38 8.0 1257 325 120 49 1.25 1.64 4.0 8 1<br />
5 1817 D-5-24-17AD 47.8 2570 - 879 78 9.6 1195 348 105 - - 2.0 3.9 8 3<br />
6 1818 D-5-24-17AD 40 2970 - 1027 83 11 1400 395 106 - - 0.8 4.8 8 3<br />
7 1822 D-5-24-17AD 47.8 2970 - 1023 81 14 1400 402 101 - - - 3.4 8 3<br />
8 1823 D-5-24-17AD 47.8 2960 - 1026 80 12 1400 393 100 - - 0.8 4.6 8 3<br />
9 2600 D-6-24-13AB 58.9 3530 - 1220 74 8.7 1660 416 101 - - 7.0 6.0 W 3<br />
10 2683 D-7-24-17BD 30.0 2740 - 739 226 33 1250 426 116 - - 8.0 1.4 W 3<br />
11 AZ10 D-5-24-17A 47 2672 7.9 837 13.6 80 9.0 1196 323 107 44 1.30 0.58 3.4 8 5 If)<br />
m<br />
12 AZ11 D-5-24-17A 46.5 3004 7.9 10Z3 12.9 93 10.3 1382 361 101 44 - 0.70 3.8 8 5<br />
13 AZ14 D-6-25-36C 43.5 8292 7.9 3027 10.9 135 7.9 4517 787 81 66 2.77 1.65 7.2 W 5<br />
14 AZ21 D-5-24-17AD 33 3048 7.5 921 12.9 81 8.0 1412 338 109 57 - 0.84 3.9 8 5<br />
15 AZ155 D-7-25-7CCC 29.5 9288 8.1 3072 14.5 133 28 3956 1455 46 27.5 4.05 2.33 6.27 W 5<br />
16 AZ156 D-7-24-14DD 25.5 1804 8.3 709 2.7 9.2 0.7 688 452 107 27.0 - 1.62 7.8 W 5<br />
. Ii,
Table 2B.<br />
Analyses <strong>of</strong> Buena Vista area ground waters<br />
Number Sample Location Temperature TDS pH Na K Ca Mg C1 S04 HC0 3<br />
+C0 3<br />
Si0 2<br />
Li<br />
Na+K<br />
B F Remarks Data Source<br />
3548 D-7-27-10AAD 792 7.7 163 69 15 218 70 244 1.0 W 4<br />
1<br />
58<br />
D-7-27-11BBB<br />
49<br />
1094 7.5 333 3.9 1<br />
0.1 212 272<br />
205<br />
62 0.4
Table 2B.<br />
Analyses <strong>of</strong> Buena Vista area ground waters. continued<br />
Number Sample Location Temperature TDS pH Na K Ca Mg C1 S04 HC0 3<br />
+C0 3<br />
Si0 2<br />
Li B F Remarks Data Source<br />
Na+K<br />
3449 D-7-27-8DBB -- 1371 7.6 280 --- 124 29.2 370 200 366 -- -- -- 2.10 W 4<br />
3453 D-7-27-2ACA -- 1096 7.6 256 -- 80 16.4 342 130 264 -- -- - 2.05 W 4<br />
3458 D-6-28-31DAC -- 817 7.6 167 --- 70 18.0 252 70 237 -- -- -- 1.32 W 4<br />
3464 D-7-27-16CBA -- 1315 7.7 215 -- 92 23.0 350 240 427 -- -- -- 2.85 W 4<br />
3465 D-7-27-09ABB -- 1248 7.5 235 -- 114 27.4 332 160 356 -- -- -- 1.55 W 4<br />
3471 D-7-27-0lBBA -- 786 8.8 264 -- 4.0 0.24·216 75 214.4 --- - - 2.9 W 4<br />
3484 D-7-27-lOABC -- 1106 8.3 365 -- 16.8 3.7 256 230 222.2 --- - -- 7.5 W 4<br />
3514 D-6-28-3lADA -- 985 8.6 193 -- 100 21 372 80 210 --- -- -- 1.3 W 4<br />
3519 D-7-27-1BAC -- 875 7.8 285 --- 1.35 1.5 195 120 256 -- - -- 4.85 W 4<br />
3543 D-7-27-lADD -- 1144 8.4 359 --- 6.2 1.34 250 250 265.6 --- -- -- 7.3 W 4<br />
3488 D-6-27-35DDD -- 814 8.7 237 -- 3.6 0.49 228 120 212 -- -- 7.0 W 4<br />
3489 D-7-27-1BBB -- 830 8.4 283 -- 5.2 0.49 200 90 16.6 --- - - 4.3 W<br />
3501 D-7-27-20AAA -- 1383 7.7 315 -- 68.8 16.5 320 250 390 --- -- -- 3,4 W 4<br />
3502 D-7-27-17DBA -- 1169 9.0 192 -- 129 29.0 236 170 386 --- -- -- 1.8 W 4<br />
3503 D-7-27-17DDA -- 1265 7.5 283 -- 120 25.3 246 170 395 -- -- - 2.0 W 4<br />
3506 D-7-27-02AAA -- 830 8.5 241 --- 6.2 0.73 194 120 247.4 -- - - 7.0 W 4<br />
3511 D-7-27-01BAB -- 623 8.5 260 --- 4.0 0.36 232 80 243.6 -- -- -- 2.85 W 4<br />
4<br />
l'<br />
0\
Table 2C<br />
Analyses <strong>of</strong> Cactus Flat-Artesia area ground waters<br />
Number Sample Location Temperature TDS pH Na K Ca Mg C1 S04 HC0 3<br />
+C0 3<br />
S10 2<br />
Li B F Remarks Data Source<br />
Na+K<br />
1 25 D-8-25-12AAA 39 2447 8.6 881 7.7 50 0.9 941 535 32 17.6 - - - W 1<br />
2 26 D-8-26-7DDA 39 1345 8.8 470 3.5 15 0.2 503 335 33 18.5 W 1<br />
3 27 D-8-26-8BDCC 39 2866 8.5 1152 10.6 31 4.3 1066 607 90 14.1 W 1<br />
4 28 D-8-26-20DBCC 45 1358 8.4 579 5.8 17 0.6 510 290 79 18.4 W 1<br />
5 29 D-8-26-6CBB 31 1767 7.5 644 2.7 1 0.5 538 330 223 17 0.8 2.5 8.6 W 1<br />
6 33 D-8-26-7BBB 34 1402 7.7 444 3.0 9 0.4 457 313 42 18 1.3 0.7 10.2 W 1<br />
7 34 D-8-25-12AAA 39 2803 7.1 810 5...:1 26 0.8 965 542 31 20 2.1 0.3 7.8 W 1<br />
8 - 52 D-8-25-1DDD 36 1774 7.4 605 .3.1 19 0.6 655 392 42 20 1.7 0.6 11.0 W 1<br />
9 53 D-8-26-7ADC 32 1315 7.7 474 2.6 2 0.5 483 309 129 15 1.0 0.6 8.3 W 1<br />
10 54 D-8-26-7DDA 39 1367 7.5 449 2.4 15 0.2 505 300 38 22 1.3 0.1 12.5 W 1<br />
11 55 D-8-26-7DDB 35 1325 7.6 448 2.2 13 0.2 424 325 40 22 1.5 0.1 12.0 W 1<br />
12 56 D-8-26-7DDB 38 1634 7.5 539 2.8 22 0.2 580 377 38 23 1.6 0.3 11.5 W 1<br />
13 75 D-8-26-33CCCC 31 685 7.9 171 4.3 75 2.8 82 345 110 33 0.3 4.8 5.2 W 1 00<br />
14 76 D-8-26-32DCC 28 523 8.3 161 1.6 3.4 0.6 111 265 113 28 0.3 5.1 9.8 W 1<br />
0\<br />
15 94 D-8-26-19DCCB 27 231 7.3 21 2.1 8 3.9 16 5 132 50 0.1 0.4 1.1 W 1<br />
16 95 D-8-26-19CDDA 27 243 7.5 23 2.2 7 4.1 19 6 116 47 0.1 0.2 1.2 W 1<br />
17 96 D-8-26-19CDDB 27 429 8.0 48 3.1 14 2.7 108 58 104 36 0.3 0.5 1.0 W 1<br />
18 97 D-8-26-19CDDBC 29 679 8.0 60 2.8 10 2.0 201 95 96 34 0.5
Table 2C.<br />
Analyses <strong>of</strong> Cactus Flat-Artesia area ground waters, continued<br />
Number Sample Location Temperature TDS pH Na K Ca Mg C1 S04 HC0 3<br />
+C0 3<br />
Si0 2<br />
Li B F Remarks Data Source<br />
Na+K<br />
25 AZ23 D--8-25-12AAA 39 2660 8.5 783 5.5 65 1.1 1024 497 34 28 2.40 1.18 8.4 W 5<br />
26 AZ24 D--8-26-7AC 37 1160 8.8 384 2.3 18 0.2 418 294 54 31.7 - 0.8 11.7 W 5<br />
27 AZ25 D-8-26-7BA 34.5 1116 9.0 379 2.3 7.2 0.2 399 247 82 28 - 0.94 13.95 W 5<br />
28 AZ26 D--8-26-7BB 33.5 900 8.9 306 1.6 9.2 0.1 294 195 60 29 - 0.60 14.55 W 5<br />
29 AZ28 D-9-26-5BA 33 504 8.5 161.9 1.2 4.6 0.1 109 106 146 28 - 0.28 10.35 W 5<br />
30 AZ29 D-9-26-5BA 33 740 8.2 249 2.3 17.2 1.0 151 172 218 29 - 0.30 14.55 W 5<br />
31 AZ59 D-8-26-8CA 39.4 3000 7.9 1025 6.2 42.1 5.7 1125 585 117 22 2.32 1.78 9.45 W 5<br />
32 AZ60 D--8-26-9BC 29.4 9048 7.6 3283 14.1 67.9 20.7 4097 1688 165 30 5.16 8.40 1.17 W 5<br />
33 AZ61 D--8-26-9BC 38.9 1464 7.9 442.8 6.2 37.7 11.4 365 410 172 20 0.93 2.06 5.40, W 5<br />
34 AZ119 D--8-26-20DC 39.4 816 8.8 303.5 1.2 7.2 0.1 260 203 95 28 - 0.84 14.54 W 5<br />
'"<br />
r) :"") ....}! ..-...<br />
/'<br />
/ j .'
Table 2D.<br />
Analyses <strong>of</strong> SaIl Simon area ground waters<br />
Number Sample Location Temperature TDS pH Na K Ca Mg C1 S04 HC0 3<br />
+C0 3<br />
Sia 2<br />
Li B F Remarks Data Source<br />
Na+K<br />
1 47W80 D-11-29-36CBBB 31 563 8.1 140 4.5 2.4 0.65 91 70 141 21 0.16 0.91 2.5 W 1<br />
2 48W80 D-12-30-2CCAB 28 612 6.5 120 4.7 1.9 1.3 30 65 153 34 0.12 1.27 3.5 W 1<br />
3 49W80 D-1l-30-15CCBA 23 909 8.2 110 10.3 2.9 2.2 143 220 242 22 0.32 0.55 1.05 W 1<br />
4 50W80 D-11-29-10AAAA 25 5408 8.0 1000 9.6 2.2 1.27 1383 655 484 23 0.25 4.18 28 W 1<br />
5 51W80 D-11-29-14AAAA 27 1255 8.9 320 2.2 0.1 0.01 127 295 320 25 0.03 1.82 25 W 1<br />
6 8342 D-13-30-36DDD 41.7 - 9.3 212 0.1 6 1 92 188 120 32 0.146 0.23 18 W 2<br />
7 - D-11-29-36CBB 32.2 550 196 10 0.9 86 154 198 - - - 3.0 W 7<br />
8 - D-13-30-3BDC 33.3 - - 112 - - 15 85 86 62 - - 14.0 W 7<br />
9 - D-13-30-11BCC 32.2 268 - 97 4.5 4.4 8 58 170 - - 11.0 W 7<br />
10 - D-13-30-14DDD 32.2 267 - 88 8.5 4.8 9 78 122 - - - 7.0 W 7<br />
11 D-13-30-15DAA 35 289 - 113 1.8 0.2 12 69 121 - - 0.4 9.9 W 7<br />
0<br />
12<br />
- D-13-30-30BCB 40 355 - 128 4.0 6.6 13 80 196 - - - 6.' W 7 0<br />
13 - D-14-31-16DCC 31. 7 293 - 72 22 1.6 6 81 138 31 - - 4.0 W 7<br />
14 - D-14-31-21BCC 32.2 305 7.6 73 20 2.6 14 69 147 51 - - 2.4 W 7<br />
15 319 D-13-30-9AD 33.3 289 :.. 105 3.0 3.9 14 86 127 - - - 14 W 3<br />
16 322 D-13-30-14DD 32.2 267 88 8.5 4.8 9 78 147 - - - 7.0 W 3<br />
17 323 D-13-30-15AD 35 285 - 100 6.0 5.2 10 71 164 - - - 12 W 3<br />
18 330 D-13-30-30BC 40 355 - 128 4.0 6.6 13 80 239 - - - 6.8 W 3<br />
19 330 D-13-29-24CD 40.6 31,0 - 128 2.0 4.8 11 67 248 - - - 5.5 W 3<br />
20 AZ18 D-13-31-33AD 26.5 280 7.9 40 2.3 39 2.9 6 67.2 149 41 - 0 1.25 W 5<br />
.-I<br />
)/ .•/
Tabl~ 2E. Analyses <strong>of</strong> Bowie area ground waters<br />
Number Sample Location Temperature TDS pH Na K Ca Mg C1 S04 HC0 3<br />
+C0 3<br />
Si0 2<br />
Li B F Remarks Data Source<br />
Na+K<br />
1 90 D-12-28-34CCC 37 645 7.9 185 6.9 19 1.5 163 140 80 25 0.3 3.7 2.2 W 1<br />
2 91 D-12-28-27CCC 25 248 8.0 62 1.9 11 1.3 34 115 74 25 0.1 3.7 1.1 W 1<br />
3 92 D-12-28-27BBB 26 334 7.9 70 2.1 19 2.2 68 65 94 26 0.1 4.1 0.9 W 1<br />
4 93 D-12-28-10CCC 35 686 8.0 2.5 3.4 16 0.4 183 115 88 33 0.4 3.7 2.4 W 1<br />
5 20W80 D-'-13-28-10BCCC 37 247 7.7 156 8.9 12.~ 1.8 31 36 191 - 0.5
Table 2F.<br />
Analyses <strong>of</strong> Whitlock Mountains area ground water<br />
Number Sample Location Temperature TDS pH Na K Ca Mg C1 S04 HC0 3<br />
+C0 3<br />
S10 2<br />
Li B F Remarks Data Source<br />
Na+K<br />
1 31W80 D-10-28-36ADABA 41 1050 8.1 315 3.5 1.0 0.3 201 260 98 55 0.4 0.55 5.2 I( 1<br />
2 521(80 D- 8-28-22CCBCA 30 985 8.2 260 5.1 1.2 0.12 198 275 168 36 0.4 0.73 12 I(<br />
1<br />
3 - D- 8-28-36AAC 41 - - - - - .,. 200 - 195 - - - 11 W 7<br />
4 335 D-10-29-31BB? 41.1 962 - 334 12 7.4 195 301 205 - - - 11 I( 3<br />
5 AZ62 D-10-28-36AD 41.1 960 8.3 351 3.5 6.6 0.4 200 284 192 59 0.48 0.50 9.9 w 5<br />
6 AZ63 D-10-29-20AC 34.1 720 9.0 253 4.3 2.2 0.2 111 207 152 36 - 0.30 4.95 W 5<br />
7 AZ64 D- 8-29-22CAA 30.8 860 8.3 237 9.8 35.8 9.5 184 274 117 45 - 0.24 1.14 I( 5<br />
8 AZ65 D- 8-29-21AB 32.8 1000 8.5 332 5.1 5.4 0.5 190 269 194 59 - 0.44 8.25 W 5<br />
N<br />
;:;.<br />
, ,<br />
-',
Table 3A<br />
Geo<strong>the</strong>rmometers for <strong>the</strong> Gila Valley-Indian Hot Springs area<br />
G E a THE ~ H n H E T E R V A L U E S<br />
NUN9fR S AI-lf'l 1. UV;,\ TION IE HP < RATIP E NA-1(-CA CHALCEDONY aUARTllCONOUCTIVEI ALPHA-CRISIOBALITE<br />
( CI l CI l CI I C I I Cl<br />
1 57 1)',2, 36C81"- 'tf.,.OO 99.09 76.',3 10&.23 55.75<br />
2 5 3H ~') D52~1 Honr. 4b.no 82.'n 66.26 96.5& 4&.28<br />
3 51,''; -:() O')2',17AOOD 45.~0 82.18 "9.42 99.52 49.) 7<br />
4 55"'(1 ~72(, 171\DD9 47.no 7b.05 70.43 100.4& ')0.09<br />
5 lei 7 051Q 7AD 47.PO<br />
b IHH 0>;2417AO 40.~0<br />
7 1 i'l.? ll'iU+l7AG 47.flO<br />
"- Inll 052417AO 47. PO<br />
'! 2~) (}O D/,24 11 Art 58.'10<br />
10 2~" I D7,?411Bfj 10.1)0<br />
It AIt:l f)52417A 47.f)0 101.35 64.51 ')4.92 44.68<br />
12 AlII ')52417A 41>.50 99.82 &4.51 '}4.93 44.68<br />
13 All4 'O/,253bC 43.>;0 70.29 85.22 114.1& 63.58<br />
14 AllI il>;?417AD B.OO 101.93 7"-.21 107.69 57.19<br />
t', A71. ~'J 07/57CCC 29.50 79.16 41.20 74.78 25.16<br />
16 All,!> 07241400 2'i. 5 0 70.90 4 L. 89 73.53 23.9b<br />
('f)<br />
o<br />
r-l
Table 3B.<br />
Geo<strong>the</strong>rrnometers for <strong>the</strong> Buena Vista area<br />
G EaT HER ~ n H E T E R v A l U E S<br />
NUHIl"R SAI"tPlf U)C~TlllN Tri'1pr.~f\TlJ?E NA-K-CA CHAlCEOONY ~UARTl(CllNOUCTIVEI ALPHA-CRISTOAALIIE<br />
( C 1 ( CI ( CI ( C 1 ( CI<br />
I ~p. DU7IIAAH 49.no 152.61 82.51 111.67 61.12<br />
2<br />
~Q<br />
0717nco ]~.OO ·8R .19 81.118 111.08 60.?4<br />
3 74 Dh772':>00DO ·27.00 BO.43 73.60 103.41 52. 'I'i<br />
4 17 WI\D ll7?7ZAAOC 3h.()O 66.18 40.97 72 .66 23.12<br />
5 1 ?,'-iriC n7Z711~1l~~ '.. *).00 96.P2 48.52 79.84 3C.04<br />
b l'h,;'1() D7272A:JeB ltD.DO 82.81 43.12 74.71 25.0·.<br />
7 30W'\0 !)7Z7ZADDCA J9.00 127.36 AI.11l nO.43 59.90<br />
8 811) 7 D7277 4 ~J. 1 0 67.56 7'1.32 108.71 58.20<br />
.~ QZ7 07272CC 35.hO ------- ------- ------- -------<br />
10 ·fJ I ~ 1)7?7I1RBB 41. ~O 90.11 H2.4b 111.&2 bl.!)?<br />
11 All (l lJ 7.7 7Z ACA 37. '0 94.52 83.B3 112.88 02.11<br />
-.::1<br />
o<br />
r-l
Table 3C.<br />
Geo<strong>the</strong>rmorneters for <strong>the</strong> Cactus Flat-Artesia area<br />
GEOTHE R 11 f) 11 E T E R V A L U E S<br />
htU/"l13 [I{ SA"';~)l[ LOCATION T"';oER~ TURE NA-K-CA C~ALCfOUNY OUARTlICONOUCT1VEI ALPHA-CR1STIJRAL1TE<br />
( C I I C I ( CI I Cl ( CI<br />
2~ DqZ'12AAA 31.00 91.44 22.61 54.97 I> .23<br />
21, 1)~7'.7DOA 39.no 85.~2 22.02 54.41 5. /)'1<br />
3 27 OM?~l ~ ~DCC n.oo 9'>.63 15.44 48.00 -0.38<br />
4 zn QP?~20::JBCC 45."0 17.73 . 2 5.46 57.74 B. B&<br />
19 C 11 ~ --) be B ~ Jl.OO 75.55 24.'10 57.20 8.14<br />
" ]3 11~2', 7P~B ··Pt.OO 84.~7 Z6.R~ ')'1.11 10.16<br />
7 14 D~25l?AAA VI.oo 84.2a 31.2 ') 6).33 14.18<br />
9 5(' D'17>lOfJO Jr,.OO 74.79 31.14 6).22 14.08<br />
9 ~) Oq2~ 7ADC 12.00 86.74 20.14 52.58 3.9b<br />
10 54 O"2~7f)OA ]Q.OO 74.22 34. ~2 66.76 17.47<br />
11 55 DQZh 700a 35. () 0 72.27 34.77 66.71 17.41<br />
12 56 D3?~ 7UUg 3a.oo 73.22 16. h 1 68.49 1'1.11<br />
13 75 0~2(>31CCCC Jl.?O 50.45 ~1.4'1 02.66 32. 7~<br />
14 7f, oeZh3Z0ce 2".00 '10.47 43.34 74.'11 25. Z'I<br />
15 '14 11 QU>1 "IDee R Z 7.0 a 51.57 71.'>8 101.6) 51.23<br />
Ib 15 IJil?"I'ICD?A ?l.00 57.27 6R.50 93.66 41\ .))<br />
17 96 O~?(, 19CiJOB Z7.00 60.'15 55.26 8b.22 3b.21<br />
le '17 D8lh19CODR ?'1.CO &6.84 52.65 8J.7~ )J.83<br />
11 '1P i)~?I',3]eCO 14.00 6'1.36 41.01 7Z .69 23.1')<br />
ZO lO"l il R? ~3lf)C 13.10 ------- ------- ------- -------<br />
21 AlLZ 00.1" 700 I'f?OO 84.9) )5.1 'I 67.l2 17.el<br />
Z2 ~llJ 'lUh7t9 4'). ;10 80.)2 30.01 62.14 13.04<br />
2J All 7 D~?"lOCO 44.00 91.01 31.08 70.84 21.37 LJ')<br />
24 Anl 08",IOt 41. 50 78.90 41.52 73 .18 23. Cl 0<br />
15 All) IJq2~12A~t 3'1.00 8l. 17 41.67 73. )2 2). 7~ ..-1<br />
16 AU4 [JR2..,7AC 17.00 75.?2 43.45 75.0Z 25.39<br />
27 All') n q ?67f!A )f•• C;O 80.46 34.4) 01,.)'1 17.10<br />
21\ AI,") n~?6 7~->3 33. '>0 72.06 3q.38 70.17 20.73<br />
29 bl Z fi 09?!>5BA 33.00 80.17 42.02 73.65 24.07<br />
)0 All'! r;T?~5~A 33.00 84.97 45.0~ 7b.5,) 26.87<br />
)1 " I')'} [I1\16~CA 3'1.40 81.5'1 34.)4 '>6.30 17.02<br />
32 A7~O OA7 / l "}BC 1'1.40 c4.'15 47.70 79.06 29.29<br />
.\3 A7'>l OP.?I)q]C 3Q.OO 62.48 10.1>0 02.70 13.58<br />
34 AlII" D811',ZOOC 1'1 .. 40 64.64 37.'19 69.81 20.38<br />
,'~<br />
"'J'<br />
(\"~ )
Table 3D.<br />
Geo<strong>the</strong>rmometers for <strong>the</strong> San Simon area<br />
G E o THE R H fJ H E T E R VALUES<br />
'fUMBER S ~ MOL I: LOCATION T~11PEP~TU:;E NA-l(-CA CHALCEDONY aUARTZ(CONOUCTIVEI ALPHA-CRISTUBALITE<br />
( C I ( C I « C I ( Cl « Cl<br />
I' 4lHAG Dll?936CR~ 31.110 92.20 32.71 64.25 15.06<br />
Z 49~30 IH1102CCA'1 Z~ .00 H.07 51.56 64.62 34.bb<br />
3 4q'M~ 0 lJIIHJI5CCa Z3.GO 51.73 33."5 65.9) 16.bb<br />
4 ~OH9!) Olll'llOAAA 25.00 80.61 36.14 ba.03 18.66<br />
, t;111'10 011 ?'Jl4AAA 27.00 215.10 33.36 ti5.3o 16.1J<br />
6 B)'t l Iil1303"DfJO 41.7'") 8.97 21.ilO 54.19 5.4'1<br />
1 f)1l?936CS~ 32.20 ------- ------- ------- -------<br />
IJ11303R'iC 33. ·10 ------- RJ. () 1 IlZ.12 61.77<br />
"I Cl130119CC V.ZO<br />
III OI11:Jl4DfJD 12. Z 0<br />
II CJIJ1(!lSDAA 1~.()0<br />
12 Dll1030BCI\ 40.00<br />
11 !J14l1160CC H.70 ------- 4'1.4'1 80.7" 30.93<br />
14 OI'o11218CC 32.10 ------- 7Z.44 102.3J 51.n<br />
IS 31° ClnO'}AD 13. 30<br />
10 372
Table 3E.<br />
Geo<strong>the</strong>rmometers for <strong>the</strong> Bowie area<br />
G E 0 THE RHO H E T ~ R VAL'JES<br />
NUHB E R SA t'PLE LOCATION TEI·PERATU'lE NA-K-CA CHALCEDONY OUARTIICONOUCTIVEI ALPHA-CRISTORALITE<br />
I CI I C 1 I CI I CI I CI<br />
1 '10 DIU83~CCC 17.00 9~.~7 19.54 71.29 21.BO<br />
2 '11 DllZ827CCC 25.00 51.91 19.53 71.28 21.79<br />
1 'l? 01ll Rl7B!\q 21,.00 ~7. 7~ ~1. 31 72.93 21.42<br />
~ 93 DIU~10CCC J5.00 ------- 51.22 8l.~O 32.51<br />
5 linno D1128109CC 37.00 101.15 ------- ------- -------<br />
6 2 1 ~ HO OlllP,I?OCC 15.00 124.17 b?04 95.42 45.10<br />
7 .lZk~1l 0IllRl?AOO 14. 00 122.67 69.40 99.?0 49.1?<br />
8 21HiW {)U~815RDC 15.00 124.19 70.58 100. "0 50.23<br />
~ 24kAO 01178'JBCCC 33.00 54.62 57.10 87.97 J7.91<br />
10 2?HEO o 122326CCD 37.00 45.49 4B .16 79.50 29.71<br />
11 2&"RO D122834BCB 31.00 82.42 41.7\> 73.~ 1 23.84<br />
12 l7Wfi0 0122827ABB 14.'10 41.68 52.15 83.2~ 33.37<br />
lJ lOW'tO D_H925COO 37.00 43.85 57.12 B3.2b B.H<br />
14 29H'!'l o 13l925COO )~.IjO 97.28 52.70 83.81 33.87<br />
15 ~lQtl OlJ2927ACC D.30 76.01 36.01 67.91 18.56<br />
1" (] III 94DOB J7.20 ------- 50.8il 82.09 32.21<br />
17 01llBncc 11.70 ------- 00.41 91.08 40.91<br />
1,1 01379240CC 41.70 ------- ------- ------- ------<br />
19 ADa DllZd34ec 31.00 41.53 4R.54 79.67 30.00<br />
20 A711 01U834RA 2'1.00 H.29 54.42 35.44 35.~5<br />
21 Al37 0122 R34AA 36. ao 76.10 44.11 75.65 26.00<br />
22 AI J:\ 01il~10Cq 36.00 47.79 ~0.72 72.41 22.88<br />
2J AI14 ill77810CC )5.~0 66.66 46.77 78.17 2 8. ~4<br />
l~ H3'J 01l29369R 30."0 90.06 61.41 92.02 ~1.85<br />
r---<br />
l~ Alk fJn3030B 21.00 58.22 81.36 110.00 60.0b<br />
0<br />
2b AZ 17<br />
.--l<br />
DLB015 27.')0 78.04 20.46 52.89 4.25
Table 3F.<br />
Geo<strong>the</strong>rrnorneters for <strong>the</strong> Whitlock Mountains area<br />
G E 0 THE RHO h f T E R ~ A L U E S<br />
.... Uh--2 (R SH;PLF LflCATION T3 35.6"<br />
3 !J~Z;D6H.C 41. GO<br />
4 330, 0IfJZ'HISB "1.10<br />
5 Alb? DI')?~)6AO 41. 10 'J7.23 77 .65 107.17 56.6e<br />
6 A71,) OIoznOAC 34.10 13Z.80 4".~b 76.3b l6.be<br />
7 Al!>" DB2"Z2CAA )o.~o 67.51 64.58 '14.99 4".7't<br />
8 Al ~}'J Dolo2lAB 32.1'0 11'1.78 76.60 IOb.lO 55.73<br />
co<br />
o<br />
,.--l
Table 4.<br />
Summary table showing aquifers in <strong>the</strong> Cactus Flat area with temperatures<br />
and estimated temperature gradients<br />
t<br />
N<br />
I<br />
a<br />
5 Miles<br />
-- .... İ<br />
I I<br />
L_..., ,<br />
IL ; I<br />
~<br />
STUOY~<br />
AREA-"\.,<br />
T8S<br />
1<br />
I<br />
I<br />
I<br />
IR24E<br />
lOS<br />
R25E<br />
R27E<br />
TEMPERATURE<br />
ESTIMATED<br />
TEMPERATURE<br />
GRADIENT<br />
AVERAGE<br />
TEMPERATURE<br />
GRADIENT<br />
en a:<br />
1JJ<br />
I<br />
1JJ<br />
~<br />
:r:<br />
1001-<br />
Ii: 200<br />
1JJ<br />
CI<br />
25°C 58.3°Clkm 58.3°Clkm<br />
1_ 28.9°C -30.O"C 55.8-60.9°C'km 58.4°C/km<br />
29.4°C - 32.8°C 50.9- 64BOClklT 57.9°Clkm<br />
CONFINED A()(JIFER<br />
CONFINED Ar;tJIFER<br />
COIFINED AQUIFER<br />
300<br />
-<br />
35.6°C -35.8°C 54.0-58.eoClkm 56:4°Clkm<br />
CONFINED A()(JIFER<br />
DIAGRAM SHOWING AQUIFERS IN THE CACTUS FLAT<br />
AREA WITH TEMPERATURES AND ESTIMATED TEMP<br />
ERATURE GRADIENTS. AQUIFERS DETERMINED BY<br />
DRILlERs' COMMENTS DOCUMENTED IN KNECHTEL,I938<br />
109
APPENDIX 1<br />
Selected Drillers Logs<br />
110
Summary <strong>of</strong> description <strong>of</strong><br />
Core Lithology by E.S.<br />
Davidson, U.S. Geological<br />
Survey, Tucson<br />
Test Hole<br />
0-6-27-35cbb<br />
Thickness<br />
(feet)<br />
Depth<br />
(feet)<br />
No Record<br />
Conglomerate, "Dipping 30 0<br />
from vertical," Red Granite<br />
Clasts "Tertiary" volcanic<br />
rock and volcanoclastic rock<br />
"Laramide" andesite, epidotised,<br />
mineralized with copper<br />
560<br />
129<br />
3<br />
308<br />
560<br />
689<br />
692<br />
1000<br />
Driller's log<br />
Gravel<br />
Gravel and Caliche<br />
in alternating 3 foot layers<br />
0-6-27-35dda<br />
Thickness<br />
15<br />
235<br />
Depth<br />
15<br />
250<br />
Driller's log<br />
Gravel<br />
Gravel and Caliche in<br />
alternating 3 feet beds<br />
0-6-27-36ccc<br />
Thickness<br />
15<br />
235<br />
Depth<br />
15<br />
250<br />
Driller I slog<br />
Gravel<br />
Gravel and Caliche<br />
in alternating layers<br />
3 feet apart<br />
0-7-27-lbba<br />
Thickness<br />
15<br />
235<br />
Depth<br />
15<br />
250<br />
Driller's log<br />
0-7-27-2aaa<br />
Thickness<br />
Depth<br />
Boulders<br />
Clay<br />
Sand-water<br />
Clay<br />
Clay<br />
Sandy clay<br />
Clay<br />
Sandy clay<br />
Clay<br />
Gravel<br />
Clay<br />
Gravel and warm water<br />
Clay<br />
Gravel and water raised to<br />
18 feet <strong>of</strong> top<br />
Clay<br />
Gravel<br />
Clay<br />
Boulders and gravel<br />
Gravel<br />
Clay<br />
Gravel<br />
Clay<br />
Gravel and clay<br />
18<br />
27<br />
7<br />
13<br />
7<br />
13<br />
12<br />
8<br />
12<br />
8<br />
20<br />
12<br />
8<br />
12<br />
23<br />
6<br />
6<br />
20<br />
11<br />
4<br />
101<br />
9<br />
43<br />
18<br />
45<br />
52<br />
65<br />
72<br />
85<br />
97<br />
105<br />
117<br />
125<br />
145<br />
157<br />
165<br />
177<br />
200<br />
206<br />
212<br />
232<br />
243<br />
247<br />
348<br />
357<br />
400<br />
111
Driller's log<br />
Brown <strong>san</strong>d and dirt<br />
Boulders<br />
Yellow clay<br />
Gravel<br />
Clay<br />
Gravel, conglomerate<br />
Yellow clay<br />
Conglomerate, last<br />
10 feet hard<br />
D-7-27-2aab 2<br />
Thickness<br />
16<br />
8<br />
101<br />
55<br />
10<br />
40<br />
20<br />
150<br />
Depth<br />
16<br />
24<br />
125<br />
180<br />
190<br />
330<br />
350<br />
500<br />
Driller's log<br />
D-7-27-2aca<br />
Thickness<br />
Depth<br />
Top soil 10'<br />
Boulders 15<br />
OQ<br />
U<br />
Gravel 8<br />
Clay 26<br />
Fine <strong>san</strong>d 6<br />
Clay 20<br />
Fine <strong>san</strong>d 5<br />
OQ 8<br />
Fine <strong>san</strong>d 6<br />
Clay and <strong>san</strong>d 37<br />
Clay and gravel 8<br />
Clay 20<br />
Sand 6<br />
Clay 4<br />
Gravel 7<br />
Sandy clay 5<br />
OQ 6<br />
Sand 6<br />
Sand and gravel, water flowed 12<br />
Clay and gravel 66<br />
Sand 9<br />
Gravel 11<br />
Clay 4<br />
Sand and gravel 8<br />
OQ 6<br />
Gravel and clay 7<br />
Clay 15<br />
Course <strong>san</strong>d 4<br />
Boulders 12<br />
Boulders and clay 21<br />
Clay 3<br />
Boulders 7<br />
10<br />
25<br />
44<br />
52<br />
78<br />
84<br />
104<br />
109<br />
117<br />
123<br />
160<br />
168<br />
188<br />
194<br />
198<br />
205<br />
210<br />
216<br />
222<br />
234<br />
300<br />
309<br />
320<br />
324<br />
332<br />
338<br />
345<br />
350<br />
354<br />
366<br />
387<br />
392<br />
525<br />
Driller's log<br />
Top soil<br />
Gravel<br />
Clay<br />
Sand clay and water<br />
Clay<br />
Gravel<br />
Clay<br />
Sand and gravel<br />
Clay<br />
Gravel<br />
Clay<br />
Gravel<br />
Clay<br />
Sand and gravel<br />
Clay<br />
Gravel and <strong>san</strong>d<br />
Clay<br />
Gravel<br />
Clay<br />
Sand and gravel<br />
Clay<br />
Sand anc.. gravel<br />
Clay<br />
Gravel and boulders<br />
D-i-27-2acd<br />
Thickness<br />
8<br />
7<br />
10<br />
13<br />
7<br />
7<br />
25<br />
11<br />
7<br />
15<br />
3<br />
7<br />
9<br />
11<br />
6<br />
20<br />
13<br />
16<br />
17<br />
10<br />
12<br />
13<br />
10<br />
38<br />
Depth<br />
8<br />
15<br />
25<br />
38<br />
45<br />
52<br />
77<br />
88<br />
95<br />
110<br />
118<br />
125<br />
134<br />
145<br />
151<br />
171<br />
184<br />
200<br />
217<br />
227<br />
239<br />
252<br />
262<br />
400<br />
112
D-7-27-2cdb<br />
Driller's log<br />
Surface soil<br />
Boulders<br />
Yellow clay<br />
Gravel<br />
Yellow clay<br />
Gravel<br />
Yellow clay<br />
Gravel<br />
Yellow clay<br />
Gravel<br />
Clay<br />
Gravel<br />
Clay<br />
Conglomerate<br />
Yellow clay<br />
Water gravel<br />
Yellow clay<br />
Water gravel<br />
Yellow clay<br />
Water gravel<br />
Yellow clay<br />
Sand and Boulders<br />
Yellow clay<br />
Water Gravel and Sand<br />
Bedrock "Red Granite"<br />
Thickness<br />
(feet)<br />
16<br />
32<br />
82<br />
12<br />
16<br />
14<br />
25<br />
18<br />
7<br />
15<br />
11<br />
7<br />
5<br />
41<br />
6<br />
108<br />
3<br />
84<br />
6<br />
27<br />
3<br />
22<br />
6<br />
134<br />
2<br />
Depth<br />
(feet)<br />
16<br />
48<br />
130<br />
142<br />
158<br />
172<br />
197<br />
215<br />
222<br />
237<br />
248<br />
255<br />
260<br />
301<br />
307<br />
415<br />
418<br />
502<br />
508<br />
535<br />
538<br />
560<br />
566<br />
700<br />
702<br />
Driller's log<br />
Boulders<br />
Clay<br />
Sand and Water<br />
Clay and Sand<br />
Gravel<br />
Clay and Sand<br />
Sandy clay<br />
Clay and Sand<br />
Sandy clay<br />
Clay<br />
Gravel (water flowed)<br />
Clay<br />
Sand and Gravel<br />
Clay<br />
Sand<br />
Clay<br />
Coarse <strong>san</strong>d<br />
D-7-27-llbbb(1)<br />
Thickness<br />
(feet)<br />
18<br />
24<br />
4<br />
64<br />
2<br />
17<br />
16<br />
157<br />
37<br />
5<br />
12<br />
5<br />
37<br />
11<br />
7<br />
4<br />
15<br />
Depth<br />
(feet)<br />
18<br />
42<br />
46<br />
110<br />
112<br />
129<br />
145<br />
302<br />
339<br />
344<br />
356<br />
361<br />
398<br />
409<br />
416<br />
420<br />
435<br />
D-7-27-llbbb(2)<br />
(East Well)<br />
Driller's log<br />
Boulders<br />
Clay and Water<br />
Sand<br />
Clay<br />
Sand and Clay<br />
Sand and Clay<br />
Gravel<br />
Clay<br />
Gravel<br />
Clay<br />
Sandy clay<br />
Gravel<br />
Sandy clay<br />
Malapai <strong>san</strong>d<br />
Clay<br />
Gravel<br />
Malapai <strong>san</strong>d<br />
Clay<br />
Thickness<br />
(feet)<br />
22<br />
21<br />
2<br />
28<br />
8<br />
210<br />
4<br />
7<br />
5<br />
3<br />
28<br />
9<br />
11<br />
11<br />
5<br />
6<br />
3<br />
25<br />
Depth<br />
(feet)<br />
22<br />
43<br />
45<br />
73<br />
81<br />
291<br />
295<br />
302<br />
307<br />
310<br />
338<br />
347<br />
358<br />
369<br />
374<br />
380<br />
383<br />
408<br />
113
D-7-27-2dbb<br />
Driller's log Thickness Depth<br />
Water-loam 14 14<br />
Gravel rock 21 35<br />
Rock and clay 10 45<br />
Clay 10 55<br />
Clay and Gravel 20 75<br />
Water Gravel (water at 6 feet 1 76<br />
<strong>of</strong> top)<br />
Clay 29 105<br />
Gravel 7 112<br />
Clay 30 142<br />
Gravel 6 148<br />
Clay 7 155<br />
Gravel 5 160<br />
Clay 6 166<br />
Gravel 3 169<br />
Clay 11 180<br />
Gravel 7 187<br />
Clay 6 193<br />
Gravel 5 198<br />
Clay 12 210<br />
Gravel 22 232<br />
Clay 6 238<br />
Gravel 19 257<br />
Clay 11 268<br />
Gravel 8 276<br />
Clay 6 282<br />
Gravel 5 287<br />
Clay 4 291<br />
Gravel 6 297<br />
Clay 11 308<br />
Gravel 7 315<br />
Clay 7 322<br />
Gravel 5 327<br />
Clay 7 334<br />
Gravel 8 342<br />
Clay 6 348<br />
Gravel flowing water 8 356<br />
Clay 8 364<br />
Gravel 9 373<br />
Clay 8 381<br />
Gravel 12 393<br />
Gravel 40 433<br />
114
APPENDIX 2<br />
pH Correction for <strong>the</strong> Silica Geo<strong>the</strong>rrnorneters<br />
115
APPENDIX 2<br />
.pH· Correction for·· <strong>the</strong>·· Silica Geo<strong>the</strong>rmometers<br />
Dissolved silica (Si(OH)4 concentrations in ground water are largely<br />
temperature dependent.<br />
Quartz or chalcedony (Si02) is dissolved in water<br />
to form <strong>the</strong> Si(0H)4 species:<br />
Equation 1<br />
However, when pH is high, <strong>the</strong> silica analyzed in <strong>the</strong> laboratory includes<br />
dissociated silicic acid:<br />
Equation 2<br />
Si(OH)4 = SiO(OH)a + H+<br />
The~~fore,<br />
excess silica introduced by ionization or dissociation <strong>of</strong><br />
silicic acid must be subtracted from analyzed silica before geo<strong>the</strong>rmometer<br />
calculations are performed.<br />
Such a correction may be called a pH correction<br />
since <strong>the</strong> ionization <strong>of</strong> silicic acid is dependent largely upon pH.<br />
The equilibrium constant (K)<br />
for <strong>the</strong> dissociation <strong>of</strong> Si(OH) 4 in<br />
water is 10- 9 • 7<br />
at 2S o C (29S o K):<br />
Equation 3<br />
Equation 3 reduces to:<br />
Equation 4<br />
-9.70 = 10g[SiO(OH)3J + 10g&+] - 10g [Si(OH)J<br />
116
By converting milligrams per liter to molal concentration <strong>of</strong> analyzed silica,<br />
<strong>the</strong> silica correction (C Si02<br />
) is:<br />
Equation 5<br />
lOX<br />
C Si02<br />
=<br />
_s<br />
1.04l6667XlO<br />
where:<br />
X = 9.7 + pH + lOg~Analyzed silica) (1.04l6667XlO- s 2)<br />
An additional refinement to this correction is needed because <strong>the</strong> dissociation<br />
constant (K) varies with temperature. By using <strong>the</strong> Vanlt H<strong>of</strong>f equation,<br />
this constant may be calculated at any temperature.<br />
The value <strong>of</strong> heat <strong>of</strong><br />
ionization (~H) used is 3.3 kcal/mole at 25 0 C.<br />
Equation 6<br />
dlnK ~H<br />
--=-2<br />
RT<br />
at<br />
Rewritten as:<br />
Equation 7<br />
or:<br />
Equation 8<br />
S S<br />
~HSdT ~H<br />
dInK = InK = - .- = - - + C<br />
K T2 RT<br />
log K = -<br />
~H<br />
.00458T + C<br />
For known values <strong>of</strong> K, ~H,<br />
and T, C is calculated as follows:<br />
Equation 9<br />
C = (.Oo~5~)(299) - 9.70 = - 7.30<br />
117
o<br />
Therefore, <strong>the</strong> ionization constant at any temperature ( K)<br />
is:<br />
Equation 10<br />
K.r=<br />
-720.5 -7.30<br />
T<br />
o<br />
Thus, a complete pH silica correction for any insitu temperature ( K)<br />
may<br />
be calculated using milligrams per liter <strong>of</strong> analyzed silica as follows:<br />
Equation 11<br />
1.0416667X10- S<br />
where:<br />
x = t-7~0. 5J-7.3 + pH + log ~Ana1yzed silica) (1.0416667X10-52J<br />
The silica correction value (C Si02<br />
) is subtracted from analyzed silica before<br />
geo<strong>the</strong>rmometer calculations are performed.<br />
A silica correction for pH may<br />
be necessary only for pH exceeding 7.8 and is generally not important until<br />
pH exceeds 8.5.<br />
118
APPENDIX 3<br />
Arizona Bureau <strong>of</strong> Mines Memorandum<br />
119
Memorandum to·· Dt"ljI<br />
Ohapman<br />
copy<br />
SUBJECT I<br />
'I'BIP TO THE SAN SIMON OR Ft1NK WELt.<br />
On ju.l1 25. 1940, a.t <strong>the</strong> invitation <strong>of</strong> Mr. G. II. Ebeen, Bnd for<br />
reasons explained by <strong>the</strong> attaohed oorrespondenoe, I visited <strong>the</strong> San<br />
Simon or Funk Wolle<br />
Upon aniTUg <strong>the</strong>N I found Mr. Ebsen TOry' willing to turn1ah<br />
samples ot drill cores and cuttings and all poatdble information for<br />
our reoords, He seemed well plo8.80d that <strong>the</strong> Arizona Eureau <strong>of</strong> Mines<br />
had responded promptly to hie inntat10n to via1 t <strong>the</strong> proporty"<br />
This well 1s trIO mUos west at San Simon, 200 teet trom <strong>the</strong> 9 E<br />
Gomer. Sec. 27, T.13S., rooE•. The following 1nformation ooncer:n,....<br />
1118 it was furnished b1 Mr. !J,'b8lJJ1,<br />
The drilllng has beont1naneed by <strong>san</strong>e 1600 people who havD 1n<br />
'fested sums <strong>of</strong> ~.OO to $100 eaoh. Started in 1928, it hs8 reached<br />
a depth ot 6657 teet at a coat <strong>of</strong> approximatol1 $200,000. S. W. Funk,<br />
ot Oharter Oak, Calif., is trustee.<br />
Mr. Ebsen suggested that U;r. Funk would gladly furnish <strong>the</strong><br />
. Arisona Blreau 01' .Mines nth <strong>the</strong> drillers' log. Until we obtain that<br />
10it we' have <strong>the</strong> following statements which !l.r. Ebeen took fl'om memory:<br />
Valley 1'111 material, eons1st1ng ot more or less firmly oonsolidated<br />
gravel, saud. and s11t. was penetrated fram <strong>the</strong> eurfsce to a<br />
depth <strong>of</strong> soms"hat mOM than 2000 feet, below whioh stratified <strong>san</strong>d...<br />
atone, oODglomerate, arkose and shale (<strong>of</strong> ~retaceou8 aspeot) have<br />
continued to ,.he bottan <strong>of</strong> <strong>the</strong> hole. Abundant artas1an water Was<br />
enoountered above <strong>the</strong> ~retaceOuB, Q~oo1al1y at a dopth ot 1260 feet.<br />
In <strong>the</strong> lowest 200-300 teet <strong>of</strong> <strong>the</strong> hole this water haa a temperature<br />
<strong>of</strong> 274 ,<br />
0 J'.<br />
Mr. Ebsonstatas that 011 <strong>san</strong>d was encountered at 6643-6647 feet.<br />
and that gas which burns 10 feet high abavo <strong>the</strong> collar is produced<br />
4uri~~iVabb1%l£'<br />
CONCLUstONS ~ Possibly <strong>the</strong> 011 <strong>san</strong>d is genuine, -Qo6 Graph1ta dllS'"<br />
!,oeitJ CJoaur in <strong>the</strong> 8.retaoeoug ot <strong>the</strong> Chir1aahua rl~ountaina, soma 14<br />
milf'l8 farthor south. On tha o<strong>the</strong>r hand, 1t oannot bf3 deniod that<br />
such hot water (274 0 F) would stew oonsiderable grease <strong>of</strong>f <strong>of</strong> GOOOfeet<br />
ot drill oable.<br />
The drill oores given me by Mr. Ebaan arc <strong>of</strong> rock ot ~etnceaus<br />
aspect. Heret<strong>of</strong>ore, W8 had no proot ot <strong>the</strong> presonoe ot this formation<br />
beneath <strong>the</strong> San Simon Valley.<br />
Although this rock 1s not unfavorable, it is 1mpoonible to predict<br />
if or where favorable 011 struotures may ex1at in <strong>the</strong> tretaoeOUB be.<br />
neath <strong>the</strong> valley fill. From a oammaro1al standpoint, <strong>the</strong> search for<br />
oil under such condit~ons 15 a wildoat venture.<br />
To be ad.ded later: stayanow1s rSJ)ort on <strong>the</strong> fossil fragments<br />
in tho drill corea. .\lao H!O analysis.<br />
120
BIBLIOGRAPHY<br />
Aiken~ C. L. V., 1978, Gravity and aeromagnetic anomalies <strong>of</strong> sou<strong>the</strong>astern Arizonain<br />
Callender, J. E., Wilt, J. C., and Clemons, R. E., eds., Land <strong>of</strong> Cochise, <br />
New Mexico Geological Society Guidebook, 29th field conference, pp. 301-313.<br />
Aiken, C. L. V., and Sumner, J. S., 1974, A geophysical and geological investigation<br />
<strong>of</strong> <strong>potential</strong>ly favorable areas for petroleum exploration in sou<strong>the</strong>astern<br />
Arizona, Arizona: Oil and Gas Conservation Commission Report <strong>of</strong> Investigation<br />
3.<br />
Andreasen, G. E., and Galot, G. A., 1966, Aeromagnetic map <strong>of</strong> Safford and<br />
vicinity, Graham and Greenlee Counties, Arizona: U. S. Geological Survey<br />
Open-File Report, scale 1:125,000.<br />
Andreasen, G. E., and Galot, G. A., 1966. Aeromagnetic map <strong>of</strong> <strong>the</strong> San Simon<br />
valley area, Cochise, Graham, and Greenlee Counties, Arizona and Hidalgo<br />
County, New Mexico: U. S. Geological Survey Open-File Report, scale:<br />
1:125,000.<br />
Arizona Bureau <strong>of</strong> Mines, 1959, Geologic map <strong>of</strong> Coch1se County, Arizona:<br />
Bureau <strong>of</strong> Mines. U <strong>of</strong> A.<br />
Arizona<br />
Arnorsson, S., 1975, Application <strong>of</strong> <strong>the</strong> silica geo<strong>the</strong>rmometer in low temperature<br />
hydro<strong>the</strong>rmal areas in Iceland: American Journal <strong>of</strong> Science, vol. 275,<br />
pp. 763-784.<br />
Armstrong, A. K., and Silberman, M. L., 1974, Geologic map <strong>of</strong> <strong>the</strong> central<br />
Peloncillo Mountains, Hidalgo County, New Mexico: U. S. Geological<br />
Open File Report 74-11.<br />
Berry, R. C., 1976, Mid-Tertiary volcanic history and petrology <strong>of</strong> <strong>the</strong> White<br />
Mountains volcanic province, sou<strong>the</strong>astern Arizona: unpub. Ph.D. Thesis,<br />
Princeton University, 317 p.<br />
Blacet, P. M. and Miller, S. T., 1978, Reconnais<strong>san</strong>ce geologic map <strong>of</strong> <strong>the</strong><br />
Jackson Mountain quadrangle, Graham County, Arizona: U. S. Geological<br />
Survey Miscellaneous Field Studies Map MF-939.<br />
Blackwell, D. D., and Chapman, D. S., 1977, Interpretation <strong>of</strong> <strong>geo<strong>the</strong>rmal</strong><br />
gradient and heat flow data for Basin and Range <strong>geo<strong>the</strong>rmal</strong> systems:<br />
Geo<strong>the</strong>rmal Resources Council, Transactions, vol. 1, May 1977, p. 19-20.<br />
Burkham, D. E., 1970, Surface water: in objectives, methods, and environment<br />
Gila River Phreatophyte Project, Graham County, Arizona: U. S. Geological<br />
Survey Pr<strong>of</strong>essional Paper 655-A, p. 11-16.<br />
Bodvarsson, G., 1964, Physical characteristics <strong>of</strong> natural heat <strong>resource</strong>s in<br />
Iceland: in Geo<strong>the</strong>rmal Energy I, proceedings United Nations Conference<br />
on New Sou~es <strong>of</strong> Energy, Rome, 1961, vol. 2, pp. 82-90.<br />
Chapin, C. E., Chamberlin, R. M., Osburn, G. R., Sanford, A. R., and White<br />
D. W., 1978, Exploration framework <strong>of</strong> <strong>the</strong> Socorro Geo<strong>the</strong>rmal area, New<br />
Mexico: in Field guide to selected cauldrons and mining districts <strong>of</strong><br />
<strong>the</strong> Datil-Mogollon volcanic field, New Mexico, New Mexico Geological<br />
Society Special Publication 7, p. 115-129.<br />
121
-2-<br />
Clay, D. W., 1960, Late Cenozoic stratigraphy in <strong>the</strong> Dry Mountain area, Graham<br />
County, Arizona: unpub. MS Thesis, University <strong>of</strong> Arizona, 68 p.<br />
Coney, P. J., 1978, The plate tectonic setting <strong>of</strong> sou<strong>the</strong>astern Arizona: in<br />
Callender, J. F. Wilt, J. C., and Clemons, R. E., eds., Land <strong>of</strong> Cochise,<br />
New Mexico Geological Society Guidebook, 29th Field Conference, pp. 285<br />
290.<br />
Conley, J. N., and Stacey, O. A., 1977, Temperature-data tabulation to accompany<br />
temperature map <strong>of</strong> subsurface basement rocks map number GT-3A and temperature<br />
map <strong>of</strong> subsurface supra-basement rocks map number GT-3B: Arizona Oil and<br />
Gas Conservation Commission, 9 p.<br />
Cook, A., and Robinson, F. R., 1962, Geology <strong>of</strong> Kennecott Copper Corporation's<br />
Safford copper deposit: in Weber, R. H., and Peirce, H. W., eds., Mogollon<br />
Rim Region east central Arizona, New Mexico Geological Society Guidebook,<br />
13th Field Conference, pp. 143-148.<br />
Cooper, J. R., 1959, Reconnais<strong>san</strong>ce geologic map <strong>of</strong> sou<strong>the</strong>astern Cochise<br />
County, Arizona: U. S. Geological Survey Miscellaneous Field Studies<br />
Map MF-2l3.<br />
Cooper, J. R., 1960, Reconnais<strong>san</strong>ce<br />
and Graham Counties, Arizona:<br />
Studies Map MF-23l.<br />
map <strong>of</strong> Willcox, Fisher Hills, Cochise<br />
U. S. Geological Survey Miscellaneous Field<br />
Cushman, R. L., Jones, R. S., and Hem, J. D., 1947, Geology and groundwater<br />
<strong>resource</strong>s <strong>of</strong> <strong>the</strong> San Simon <strong>basin</strong>, Cochise and Graham Counties, Arizona:<br />
U.S. Geological Survey Mimeo Rep., 27 p.<br />
Cushman, R. L., and Halpenny, C. C., 1955, Effect <strong>of</strong> western drought on <strong>the</strong><br />
water <strong>resource</strong>s <strong>of</strong> Safford valley, Arizona: American Geophysical Union<br />
Transactions, vol. 36, no. 1, p. 87-94.<br />
Damon, P. E., Erickson, R. C. and Livingston, D. E., 1963, K-AR dating <strong>of</strong> Basin<br />
and Range uplift, Catalina Mountains, Arizona: in Nuclear Geophysics,<br />
Woods Hole Conference on Nuclear Geophysics, NAS-NRC Publ. 1075, p. 113<br />
121.<br />
Damon, P. E., and Bikerman, M., 1967, Potassium-Argon dating <strong>of</strong> Post<br />
Laramide plutonic and volcanic rocks within <strong>the</strong> Basin and Range Province<br />
<strong>of</strong> sou<strong>the</strong>astern Arizona and adjacent areas: Arizona Geological Society<br />
Digest, vol. 7, p. 63-78.<br />
Davidson, E. S., 1960, Geology <strong>of</strong> <strong>the</strong> eastern part <strong>of</strong> <strong>the</strong> Safford Basin, Graham<br />
County, Arizona (A preliminary report): Arizona Geological Society Digest,<br />
vol. 3, p. 123-126.<br />
Davidson, E. S., 1961, Facies distribution and hydrology <strong>of</strong> intermontane <strong>basin</strong><br />
fill, Safford <strong>basin</strong>, Arizona: U. S. Geological Survey Pr<strong>of</strong>essional Paper<br />
424C, p. 151-153.<br />
Davidson, E. S., 1962, Origin <strong>of</strong> sediments in <strong>the</strong> intermontane Safford <strong>basin</strong>,<br />
Graham County, Arizona: Geological Society <strong>of</strong> America Special Paper 68,<br />
p. 18.<br />
122
-3-<br />
Davidson, E. S., and Cooley, M. E., 1964, Stratigraphy and structure <strong>of</strong> Tertiary<br />
and Quaternary rocks <strong>of</strong> sou<strong>the</strong>astern Arizona (ABS): Geological Society<br />
<strong>of</strong> America Special Paper 76, p. 270.<br />
Davidson, E. S., and Weist, W. G., Jr., 1970, Geohydrology: in objectives,<br />
methods and environment-Gila River Phreatophyte Project, Graham County,<br />
AZ: U. S. Geological Survey Pr<strong>of</strong>essional Paper 655-A, p. 8-11.<br />
Davis, G. H., and Coney, P. J., 1979, Geologic development <strong>of</strong> <strong>the</strong> Cordilleran<br />
metamorphic core complexes: Geology, Vol. 7, p. 120-124.<br />
Deal, E. G., Elston, W. E., Erb, E. D., Peterson, S. L., Reiter, D. E., Damon,<br />
P. E., and Shafiqullah M., 1978, Cenozoic volcanic geology <strong>of</strong> <strong>the</strong> Basin<br />
and Range Province in Hidalgo County, southwestern New Mexico: in<br />
Callender, J. E., Wilt, J. C., and Clemons, R. E., eds., Land <strong>of</strong> Cochise,<br />
New Mexico, Geological Society Guidebook, 29th Field Conference, pp. 219<br />
229.<br />
De Cook, K. J., 1952, San Simon <strong>basin</strong>, Cochise County: ~ Groundwater in <strong>the</strong><br />
Gila River <strong>basin</strong> and adjacent areas, Arizona- A summary by Halpenny, L.<br />
C., and o<strong>the</strong>rs, 1952: U. S. Geological Survey Open-File Report p. 59-68.<br />
Drewes, H., 1971 Geologic Map <strong>of</strong> <strong>the</strong> Mount Wrightson Quadrangle, sou<strong>the</strong>ast <strong>of</strong><br />
Tucson, Santa Cruz and Pima Counties, Arizona: U. S. Geological Survey<br />
Miscellaneous Investigation Map I-6l4.<br />
Drewes, H., 1972, Structural geology <strong>of</strong> <strong>the</strong> Santa Rita Mountains, southwest<br />
<strong>of</strong> Tucson, Arizona: U. S. Geological Survey Pr<strong>of</strong>essional Paper 748, 35 p.<br />
Drewes, H., 1976, Laramide Tectonics from Paradise to Hells Gate, sou<strong>the</strong>astern<br />
Arizona: in Wilt, J. C., and Jenney, J. P., eds., Tectonic Digest, Arizona<br />
Geological Society Digest, Vol. 10, pp. 151-168.<br />
Drewes, H. and Thorman, C. H., 1978, Major geologic structures between Lordsburg,<br />
New Mexico and Douglas and Tucson, Arizona: in Callender, J. E., Wilt,<br />
J. C., and Clemons, R. E., eds., Land <strong>of</strong> Cochise, New Mexico Geological<br />
Society Guidebook, 29th Field Conference, pp. 291-295.<br />
Drewes, H., and Williams, F. E., 1973, Mineral <strong>resource</strong>s <strong>of</strong> <strong>the</strong> Chiricahua<br />
Wilderness Area, Cochise County, Arizona: U. S. Geological Survey<br />
Bulletin l385-AM, 53 p.<br />
DuBois, S. M., and Smith, A. W., 1980, <strong>the</strong> 1887 earthquake in San Bernardino<br />
valley, Sonora: Arizona Bureau <strong>of</strong> Geology and Mineral Technology Special<br />
Paper no. 3, 112 p.<br />
Dunn, P. G., 1978, Regional structure <strong>of</strong> <strong>the</strong> Safford District, Arizona:<br />
Geological Society Digest, Volume XI, pp. 9-16.<br />
Arizona<br />
Dutt, G. R., and McCreary, T. W., 1970, The quality <strong>of</strong> Arizona's. domestic,<br />
agricultural, and industrial waters, University <strong>of</strong> Arizona Agricultural<br />
Experiment Station Report 256, 83 p.<br />
Eaton, G. P., 1966, Geophysical investigation <strong>of</strong> a <strong>basin</strong>-fill aquifer in<br />
sou<strong>the</strong>astern Arizona Cabs): Geological Society <strong>of</strong> America Special Paper<br />
87, p. 49.<br />
123
-4-<br />
Eaton, G. P., and Timmons, C. E., 1966, Principal facts for gravity stations<br />
in <strong>the</strong> Safford and San Simon valleys, Arizona: U. S. Geological Survey<br />
Open-File Report.<br />
Eaton, G. P., 1969, Recent elevation changes in San Simon valley, Arizona<br />
(abs): Geological Society <strong>of</strong> America Abstracts with programs 1969, Part<br />
5, Rocky Mountain Section, p. 21.<br />
Eaton, G. P., 1972, Deformation <strong>of</strong> Quaternary deposits in two intermontane<br />
<strong>basin</strong>s <strong>of</strong> sou<strong>the</strong>rn Arizona, U. S. A. 24th IGC, section 3, p. 607-616.<br />
Ellis, A. J., and Mahon, W. A. J., 1977, Chemistry and Geo<strong>the</strong>rmal Systems:<br />
Academic Press, New York, 392 p.<br />
Elston, W. E., 1958, Burro uplift, nor<strong>the</strong>astern limit <strong>of</strong> sedimentary <strong>basin</strong> <strong>of</strong><br />
southwestern New Mexico and sou<strong>the</strong>astern Arizona: American Association<br />
<strong>of</strong> Petroleum Geologists Bulletin, Vol. 42, p. 2513-2517.<br />
Elston, W. E., Damon, P. E., Coney, P. J., Rhodes, R. C., Smith, E. I., and<br />
Bikerman, M. E., 1973, Tertiary volcanic rocks, Mogollon-Detil Province,<br />
New Mexico, and surrounding region: K-AR dates patterns <strong>of</strong> eruption,<br />
and periods <strong>of</strong> mineralization, Geological Society <strong>of</strong> American Bulletin,<br />
Vol. 84, p. 2259-2274.<br />
Erickson, R. C., 1968, Geology and geochronology <strong>of</strong> <strong>the</strong> Dos Cabezas Mountains,<br />
Cochise County, Arizona: . ·in Sou<strong>the</strong>rn Arizona, Guidebook III, Arizona<br />
Geological Society, p. 192~198.<br />
Arizona Geo<br />
Fair, C. L., 1961, Geohydrology <strong>of</strong> <strong>the</strong> Safford inner valley:<br />
logical Society Digest, vol. 4, p. 125-131.<br />
Feth, J. H., 1952, Safford <strong>basin</strong>, Graham County! in groundwater in <strong>the</strong> Gila<br />
River <strong>basin</strong> and adjacent areas, Arizona-A summary by Halpenny and o<strong>the</strong>rs,<br />
1952: U.S. Geological Survey Open-File Report, p. 45-58.<br />
Feth, J. H., and Hem, J. D., 1963, Reconnais<strong>san</strong>ce <strong>of</strong> headwater springs in <strong>the</strong><br />
Gila River drainage <strong>basin</strong>, Arizona: U.S. Geological Survey Water-Supply<br />
Paper l6l9-H, 54 p.<br />
Fournier, R. 0., 1977, Chemical geo<strong>the</strong>rmometers and m~x~ng models for <strong>geo<strong>the</strong>rmal</strong><br />
systems: Pergamon Press, Geo<strong>the</strong>rmics, Vol. 5, p. 441-50.<br />
Fournier, R. 0., 1979, Geochemical and hydrologic considerations and <strong>the</strong> use<br />
<strong>of</strong> enthalpy-chloride diagrams in <strong>the</strong> prediction <strong>of</strong> underground conditions<br />
in hot springs systems: Journal <strong>of</strong> Volcanology and Geo<strong>the</strong>rmal Research,<br />
Vol. 5, p. 1-16.<br />
Fournier, R. O. and Potter, R. W., 1978, A magnesium correction for <strong>the</strong> Na-K-Ca<br />
chemical geo<strong>the</strong>rmometer: U.S. Geological Survey Open-File Report 78-986,<br />
23 p.<br />
Fournier, R. O. and Rowe, J. J., 1966, Estimation <strong>of</strong> underground temperatures<br />
from silica content <strong>of</strong> water from hot springs and wet steam wells:<br />
American Journal <strong>of</strong> Science, Vol. 264, p. 685-697.<br />
124
-5-<br />
Fournier, R. O. and Truesdell, A. H., 1973, An empirical Na-K-Ca geo<strong>the</strong>rmometer<br />
for neutral waters: Geochem et Cosmochim Acta, Vol. 37, p. 1255-1275.<br />
Fournier, R. O. and Truesdell, A. H., 1974, Geochemical indicators <strong>of</strong> subsurface<br />
temperature-part 2, estimation <strong>of</strong> temperature and fraction <strong>of</strong> hot<br />
water mixed with cold water: U. S. Geological Survey Journal <strong>of</strong> Research,<br />
Vol. 2, No.3, p. 263-270.<br />
Fournier, R. O. and White, D. E., and Truesdell, A. H., 1974, Geochemical indicators<br />
<strong>of</strong> subsurface temperature-part 1, basic assumptions: U. S.<br />
Geological Survey Journal <strong>of</strong> Research, Vol. 2, No.3, p. 259-262.<br />
Garrels, R. M. and Mackenzie, F. T., 1967, Origin <strong>of</strong> <strong>the</strong> chemical compositions<br />
<strong>of</strong> some springs and lakes: in equilibrium concepts in natural water<br />
systems: American Chemical Society, Washington, D.C., p. 222-242.<br />
Gerlach, T., Norton, D., DeCook, K. J., and Sumner, J. S., 1975, Geo<strong>the</strong>rmal<br />
water <strong>resource</strong>s in Arizona: A feasibility study, project completion<br />
report, U.S. Department <strong>of</strong> Interior, Office <strong>of</strong> Water Resources Research<br />
Project A-054-Ariz., Washington, D. C., 36 p.<br />
Giardina, S., and Conley, J. N., 1978, Thermal gradient anomalies:<br />
Oil and Gas Conservation Commission Report <strong>of</strong> Investigation 6.<br />
Arizona<br />
Gillerman, E., 1958, Geology <strong>of</strong> <strong>the</strong> Central Peloncillo Mountains, Hidalgo<br />
County, New Mexico, and Cochise County, Arizona: New Mexico Bureau <strong>of</strong><br />
Mines and Mineral Resources Bulletin 57, 152 p.<br />
Haigler, Leon B., 1969, Geo<strong>the</strong>rmal <strong>resource</strong>s, in Mineral and Water Resources<br />
<strong>of</strong> Arizona: Arizona Bureau <strong>of</strong> Mines Bulletin 180, p. 575-580.<br />
Halpenny, L. C., and Cushman, R. L., 1947, Groundwater <strong>resource</strong>s and problems<br />
<strong>of</strong> Cactus Flat-Artesia, San Simon <strong>basin</strong>, Arizona, with section on water<br />
quality by Hem, J. D.: U.S. Geological Survey Mimeo Report, 14 p.<br />
Halpenny, L. C., 1952, Groundwater in <strong>the</strong> Gila River <strong>basin</strong> and adjacent areas,<br />
Arizona-A summary: U.S. Geological Survey Open-File Report, 224 p.<br />
Harbour, J., 1960, Sedimentology and stratigraphy <strong>of</strong> <strong>the</strong> <strong>basin</strong>-fill sediments<br />
in <strong>the</strong> <strong>basin</strong>-fill sediments in <strong>the</strong> Safford valley: Arizona Geological<br />
Society Digest, vol. 3, p. 131-132.<br />
Harbour, J., 1966, Stratigraphy and sedimentology <strong>of</strong> <strong>the</strong> upper Safford <strong>basin</strong><br />
sediments: unpub. Ph.D. Thesis, University <strong>of</strong> Arizona, 242 p.<br />
Heindl, L. A., 1958, Cenozoic alluvial deposits <strong>of</strong> <strong>the</strong> upper Gila River area,<br />
New Mexico and Arizona: unpub. Ph.D. Thesis, University <strong>of</strong> Arizona,<br />
249 p.<br />
Heindl, L. A., 1962, Should <strong>the</strong> term "Gila Conglomerate" be abandoned?:<br />
Arizona Geological Society Digest, Vol. V, p. 73-88.<br />
Heindl, L. A., 1967, Groundwater in fractured volcanic rocks in sou<strong>the</strong>rn<br />
Arizona: in Hydrology <strong>of</strong> fractured rocks-Dubrovnik symposium, 1965<br />
proc. Vol.-Z, International Association <strong>of</strong> Sci. Hydrol. Pub. 74, p. 503<br />
513.<br />
125
-6-<br />
Heindl, L. A., and McCullough, R. A., 1961, Geology and availability <strong>of</strong> water<br />
in <strong>the</strong> Lower Bonita Creek Area, Graham County, Arizona: U.S. Geological<br />
Survey Water Supply Paper 1589, 56 p.<br />
Hem, J. D., 1950, Quality <strong>of</strong> water <strong>of</strong> <strong>the</strong> Gila River above Coolidge Dam,<br />
Arizona: U.S. Geological Survey Water-Supply Paper 1104, 230 p.<br />
Hollander, J. T., 1960, Geology and aquifer characteristics <strong>of</strong> <strong>the</strong> innervalley<br />
alluvium in <strong>the</strong> Safford valley, Arizona: Arizona Geological<br />
Society Digest, vol. 3, pp. 133-135.<br />
Holzer, T. L., 1980, Reconnais<strong>san</strong>ce maps <strong>of</strong> earth fissures and land subsidence,<br />
Bowie and Willcox areas Arizona: U.S. Geological Survey Miscellaneous<br />
Field Studies Map MF-1156.<br />
Jones, R. W., 1963, Structural evolution <strong>of</strong> part <strong>of</strong> sou<strong>the</strong>ast Arizona: in<br />
Backbone <strong>of</strong> <strong>the</strong> Americas-Tectonic History from Pole to Pole, American<br />
Association Petroleum Geologists Memoir 2, pp. 140-151.<br />
Johnson, P. W., 1959, Test holes in ou<strong>the</strong>rn Arizona valleys: in Sou<strong>the</strong>rn<br />
Arizona Guidebook III, Arizona Geological Society, p. 62-6~<br />
Keith, S. B. and Barrett, L. F., 1976, Tectonics <strong>of</strong> <strong>the</strong> central Dragoon<br />
Mountains, a new look: in Wilt, J. C. and Jenney J. P. eds., Tectonic<br />
Digest, Arizona Geological Society Digest, Vol. 10, pp. 169-204.<br />
Knechtel, M. M., 1935, Indian Hot Springs, Graham County Arizona: Washington<br />
Academy <strong>of</strong> Science Journal, Vol. 25, p. 409-413.<br />
Knechtel, M. M., 1936, Geologic relations <strong>of</strong> <strong>the</strong> Gila Conglomerate in sou<strong>the</strong>astern<br />
Arizona: American Journal <strong>of</strong> Science, 5th ser., vol. 31, p. 81-92, map.<br />
Knechtel, M. M., 1938, Geology and ground-water <strong>resource</strong>s <strong>of</strong> <strong>the</strong> valley <strong>of</strong><br />
<strong>the</strong> Gila River and San Simon Creek, Graham County, Arizona: U. S. Geological<br />
Survey Water-Supply Paper 796, p. 222.<br />
Livingston, D. E., Maucer, R. L., and Damon, P. E., 1968, Geochronology <strong>of</strong> <strong>the</strong><br />
emplacement, enrichment, and preservation <strong>of</strong> Arizona porphyry copper<br />
deposits: Economic Geology, vol. 63, pp. 30-36.<br />
Luedke, R. G. and Smith, R. L., 1978, Map showing distribution, composition<br />
and age <strong>of</strong> late Cenozic volcanic centers in Arizona and New Mexico,<br />
1:1,000,000: U.S. Geological Survey Miscellaneous Investigation Series<br />
Map I-l091-A.<br />
Lutton, R. J., 1958, Some structural features in sou<strong>the</strong>rn Arizona:<br />
M.S. Thesis, University <strong>of</strong> Arizona, 138 p.<br />
unpub.<br />
Lysonski, J. C., Sumner, J. S., Aiken, C. and Schmidt, J. S., 1980, The complete<br />
residual Bouguer gravity anomaly map <strong>of</strong> Arizona (IGSN71), 1:500,000:<br />
Arizona Bureau <strong>of</strong> Geology and Mineral Technology.<br />
Mariner, R. H., Presser, D. D. and Evans, W. C., 1977, Chemical, isotopic,<br />
and gas compositions <strong>of</strong> selected <strong>the</strong>rmal springs in Arizona, New Mexico<br />
and Utah: U.S. Geological Survey Open-File Report 77-654, 42 p.<br />
126
7<br />
Marjaniemi, ,D. K., 1968, Geologic history <strong>of</strong> an ash-flow sequence and its source<br />
area in <strong>the</strong> Basin and Range Province <strong>of</strong> sou<strong>the</strong>astern Arizona: unpub. Ph.D.<br />
Thesis, University <strong>of</strong> Arizona, 176 p.<br />
Marjaniemi, D. K., 1968, Tertiary volcanism in <strong>the</strong> nor<strong>the</strong>rn Chiricahua Mountains,<br />
Cochise County, Arizona: in Sou<strong>the</strong>rn Arizona, Guidebook III,<br />
Arizona Geological Society, p. 209-214.<br />
Marlowe, J. I., 1960, Late Cenozic geology <strong>of</strong> <strong>the</strong> lower Safford valley-A preliminary<br />
report: Arizona Geological Society Digest, vol. 3, p. 127-129.<br />
Marlowe, J. I., 1961, Late Cenozoic geology <strong>of</strong> <strong>the</strong> lower Safford <strong>basin</strong> on <strong>the</strong><br />
San Carlos Indian Reservation, Arizona: unpub. Ph.D. Thesis, University<br />
<strong>of</strong> Arizona, 184 p.<br />
Marvin, R. R., Naeser, C. W., Mehnert, H. H., 1978, Tabulation <strong>of</strong> radiometric<br />
ages:-including unpublished K-Ar and fission-track ages-For rocks in<br />
sou<strong>the</strong>astern Arizona and southwestern New Mexico: 'in Callender, J. F.,<br />
Wilt, J. C., and Clemons, R. E., eds., Land <strong>of</strong> Cochise, New Mexico Geological<br />
Society Guidebook, 29th Field Conference, p. 243-252.<br />
Mathias, W. R., 1960, Detrital mineral studies <strong>of</strong> some Cenozoic sediments,<br />
Safford Valley, Arizona: unpub. M.S. Thesis, University <strong>of</strong> Arizona, 39 p.<br />
Matlock, J. S. III, and Buseck, P. R., 1976, Exploration for <strong>geo<strong>the</strong>rmal</strong> areas<br />
using mercury: a new geochemical technique: in Proceedings 2nd U.N.<br />
Symposium on Development and Use <strong>of</strong> Geo<strong>the</strong>rmal Resources, U.S. Government<br />
Printing Office, vol. 1, p. 785-792.<br />
Geo<br />
McKee, E. D., 1951, Sedimentary <strong>basin</strong>s <strong>of</strong> Arizona and adjoining area:<br />
logical Society <strong>of</strong> America Bulletin, vol. 62, p. 481-506.<br />
Melton, Mark A., 1966, The geomorphic and paleoclimatic significance <strong>of</strong> alluvial<br />
deposits in sou<strong>the</strong>rn Arizona: Journal <strong>of</strong> Geology vol. 73, no. 1,<br />
p. 1-38, discussion; vol. 74, no. 1, p. 102-106.<br />
Morrison, R. B., and Babcock, H. M., 1942, Duncan-Virden Valley, Greenlee<br />
County', Arizona, and Hidalgo County, New Mexico-Records <strong>of</strong> wells and<br />
springs:, well logs', water analyses and map showing locations <strong>of</strong> wells<br />
and springs, U.S. Geological Survey Mimeo Report, 29 p.<br />
Morrison, R. B., and McDonald, H. R., and Stuart, W. T., 1942, Safford Valley,<br />
Graham County, Arizona-Records <strong>of</strong> wells and springs, well logs, and water<br />
analyses: Arizona State Water Commission, 102 p., map.<br />
M0rrison, R. B., 1965, Geologic map <strong>of</strong> <strong>the</strong> Duncan and Canador Peak Quadrangles,<br />
Arizona and New Mexico: U. S. Geological Survey Map 1-442, scale<br />
1:48,000. Text 7 p.<br />
Muller, A. B., Battai1e, J. F., Bond, L. A., and Lamson, P. W., 1973, An<br />
analysis <strong>of</strong> <strong>the</strong> water quality problems <strong>of</strong> <strong>the</strong> Safford Valley, Arizona:<br />
Technical Report No. 15, Department <strong>of</strong> Hydrology and Water Resources,<br />
University <strong>of</strong> Arizona, 126 p.<br />
My'rick, R~ M., 1970, Ground water: in objectives, methods and environment<br />
Gila River Phreatophyte project-,-Graham County, Arizona: U.S. Geological<br />
Survey Pr<strong>of</strong>essional Paper 655-A, p. 16-17.<br />
Paces, T., 1972, Chemical characteristics and equilibrium in natural waterfelsic<br />
rock-C0 2<br />
system: Geochimica et Cosmochimica Acta, Vol. 36,<br />
p. 217-240.<br />
127
-8-<br />
Pashley, E. F., 1966, Structure and stratigraphy <strong>of</strong> <strong>the</strong> central, nor<strong>the</strong>rn,<br />
and eastern parts <strong>of</strong> <strong>the</strong> Tucson <strong>basin</strong>, Arizona: unpub. Ph.D. Thesis<br />
University <strong>of</strong> Arizona, 273 p.<br />
Peirce, H. W., 1976, Elements <strong>of</strong> Paleozoic tectonics in Arizona:<br />
Geological Society Tectonic Digest, Vol. X, p. 37-57.<br />
Arizona<br />
Phoenix Geophysics Incorporated, 1979, Report on <strong>the</strong> reconnais<strong>san</strong>ce resistivity<br />
and VLF-EM surveys <strong>of</strong> <strong>the</strong> Safford valley area, Graham County, Arizona<br />
for State <strong>of</strong> Arizona Bureau <strong>of</strong> Geology and Mineral Technology: Arizona<br />
Bureau <strong>of</strong> Geology and Mineral Technology Open-File Report 81-23.<br />
Rantz, S. E. and Eakin, T. E., 1971, A summary <strong>of</strong> methods for collection and<br />
analysis <strong>of</strong> basic hydrologic data for arid regions: U.S. Geological<br />
Survey Open-File Report, 125 p.<br />
Raydon, G. T., 1952, Geology <strong>of</strong> <strong>the</strong> nor<strong>the</strong>astern Chiricahua Mountains, Arizona:<br />
unpub~ M.S. Thesis, University <strong>of</strong> California<br />
Reeder, H. 0., 1957, Groundwater in Animas valley, Hidalgo County New Mexico<br />
with a section on Geology by Spiegel, Z. E.: New Mexico State Engineer<br />
Report 11, 101 p.<br />
Reiter, M. and Shearer, C., 1979, Terrestrial heat flow in eastern Arizona,<br />
A first report: Journal <strong>of</strong> Geophysical Research, vol. 84, no. Bll,<br />
p. 6115-6120.<br />
Richter, D., U. S. Geological Survey, Denver, personnel communication.<br />
Robinson, R. F. and Cook, A., 1966, The Safford Copper Deposit, Lone Star<br />
mining district, Graham County, Arizona: in Tit1ey, S. R. and Hicks,<br />
C. L., eds., Geology <strong>of</strong> <strong>the</strong> Porphyry Copper Deposits, southwestern<br />
North America, University <strong>of</strong> Arizona Press, pp. 251-266.<br />
Ross, C. A., 1973, Pennsylvanian and early Permian depositional history,<br />
sou<strong>the</strong>astern Arizona: American Association <strong>of</strong> Petroleum Geologists<br />
Bulletin, Vol. 57, p. 887-912.<br />
Sabins, F. F., 1957, Stratigraphic relations in Chiricahua and Dos Cabezas<br />
Mountains, Arizona: American Association Petroleum Geologists Bulletin,<br />
vol. 41, p. 466-510.<br />
Sabins, F. F., 1957, Geology <strong>of</strong> <strong>the</strong> Cochise Head and western part <strong>of</strong> Vanar<br />
Quadrangles, Arizona: Geological Society <strong>of</strong> American Bulletin, vol. 68,<br />
p. 1315-1342.<br />
Sabins, Floyd, F., Jr., 1965, Road log from San Simon valley to Blue Mountain:<br />
in southwest New Mexico, New Mexico Geological Society Guidebook, 16th<br />
Field Conference, p. 81-84.<br />
Safford, City <strong>of</strong>, groundwater files, City Engineers Office.<br />
Sauck, H. A., and Summner, J. S., 1970, Residual aeromagnetic map <strong>of</strong> Arizona,<br />
1;1,00.0,000; Department <strong>of</strong> Geosciences, The University <strong>of</strong> Arizona, Tucson.<br />
128
-9-<br />
Scarborough, R. B., 1975, Chemistry <strong>of</strong> late Cenozoic air-fall ashes in Sou<strong>the</strong>astern<br />
Arizona: unpub.M.S. Thesis, University <strong>of</strong> Arizona, 107 p.<br />
Scarborough, R. B. and Peirce, H. W., 1978, Late Cenozoic <strong>basin</strong>s <strong>of</strong> Arizona:<br />
in Callender, J. F., Wilt, J. C., and Clemons, R. E., eds., Land <strong>of</strong><br />
Cochise, New Mexico Geological Society Guidebook, 29th Field Conference,<br />
p. 253-259.<br />
Schmitt, H. A., 1966, The porphyry copper deposits in <strong>the</strong>ir regional setting:<br />
in Titley, R. S. and Hicks, C. L., Eds., Geology <strong>of</strong> <strong>the</strong> Porphyry Copper<br />
Deposits, southwestern North America: Tucson, University <strong>of</strong> Arizona<br />
Press, p. 17-23.<br />
,<br />
",-,',1<br />
-"l"<br />
Schwennesen, A. T.,~, Groundwater in San Simon valley, Arizona and New<br />
Mexico: U.S. Geological Survey Water-Supply Paper 425, p. 1-35.<br />
Seff, Philip, 1960, Preliminary report <strong>of</strong> <strong>the</strong> stratigraphy <strong>of</strong> <strong>the</strong> III Ranch<br />
beds, Graham County, Arizona: Arizona Geological Society Digest, vol.<br />
3, p. 137-140.<br />
Seff, Philip, 1962, Stratigraphic geology and depositional environments <strong>of</strong><br />
<strong>the</strong> III Ranch area, Graham County, Arizona: unpub. Ph.D. Thesis,<br />
University <strong>of</strong> Arizona, 171 p.<br />
Seff, Philip, 1964, Petrology and origin <strong>of</strong> <strong>the</strong> III Ranch cherts, Graham<br />
County, Arizona: Arizona Geological Society Digest vol. 7, p. 115-121.<br />
Silver, L. T., 1978, Precambrian formations and Precambrian history in Cochise<br />
County, sou<strong>the</strong>astern Arizona: in Callendar, J. F., Wilt, J. C., and<br />
Clemons, R. E., eds. Land <strong>of</strong> Cochise, New Mexico Geological Society<br />
Guidebook, 29th Field Conference, p. 157-163.<br />
Shafiqullah, M., Damon, P. E., Lynch, D. J., Kuck, P. H., and Rehig, W. A.,<br />
1978, Mid-Tertiary magmatism in sou<strong>the</strong>astern Arizona: in Callender, J. F.<br />
and Clemons, R. E., eds., Land <strong>of</strong> Cochise, New Mexico Geological Society<br />
Guidebook, 29th Field Conference p. 231-241.<br />
Shafiqullah, M., Damon, P. E., Lynch, D. J., Reynolds, S. J., Rehrig, W. A.,<br />
and Raymond, R. H., 1980, K-AR Geochronology and geologic history <strong>of</strong><br />
southwestern Arizona and adjacent areas: in Jenney, J. P. and Stone C.,<br />
eds., Studies in Western Arizona, Arizona Geological Society Digest,<br />
vol. 12, pp. 201-260.<br />
Shearer, C. R., 1979, A regional terrestrial heat-flow study in Arizona:<br />
unpub. Ph.D. Thesis, New Mexico Institute <strong>of</strong> Mining and Technology,<br />
Socorro, New Mexico, 184 p.<br />
Shearer, C. and Reiter, M., 1981, Terrestrial heat flow in Arizona:<br />
<strong>of</strong> Geophysical Research, 'lTol. 86, No. B7, pp. 6249-6260.<br />
Journal<br />
Smith, C., 1978, Geophysics geology and <strong>geo<strong>the</strong>rmal</strong> leasing status <strong>of</strong> <strong>the</strong><br />
Lightning Dock KGRA, Animas valley, New Mexico: in Callender, J. F.,<br />
Wilt, J. C., and Clemons, R. E., eds. Land <strong>of</strong> Cochise, New Mexico<br />
Geological Society Guidebook, 29th Field Conference, pp. 343-348.<br />
129
-10-<br />
Strangway, D. W., Holmer, R. C., 1966, The search for ore deposits using<br />
<strong>the</strong>rmal radiation: Geophysics, vol. 31, no. 1, pp. 225-242.<br />
Strangway, D. W., Simpson, J. and York, D., 1976, Paleomagnetic studies <strong>of</strong><br />
volcanic rocks from <strong>the</strong> Mogollon Plateau area <strong>of</strong> Arizona and New Mexico:<br />
in Cenozoic volcanism in southwestern New Mexico, New Mexico Geological<br />
Society Special Publication 5, p. 119-124.<br />
Stumm, W. and Morgan, J. J., 1970, Aquatic Chemistry, an introduction emphasizing<br />
chemical equilibria in natural waters: Wiley-Interscience, A division<br />
<strong>of</strong> John Wiley and Sons, Inc., New York, 583 p.<br />
Sumner, J. S., 1976, Earthquakes in Arizona:<br />
Mines, vol. 6., No.1, p. 1-5.<br />
Fieldnotes, Arizona Bureau <strong>of</strong><br />
Swan, M. M., 1976, The Stockton Pass fault: An element <strong>of</strong> <strong>the</strong> Texas Lineament:<br />
unpub. M.S. Thesis, University <strong>of</strong> Arizona, 119 p.<br />
Swanberg, C. A., 1978, Chemistry, origin and <strong>potential</strong> <strong>of</strong> <strong>geo<strong>the</strong>rmal</strong> <strong>resource</strong>s<br />
in southwestern New Mexico and sou<strong>the</strong>astern Arizona:in.Callender, J. F.,<br />
Wilt, J. C. and Clemons, R. F., eds. Land <strong>of</strong> Cochise, New Mexico Geological<br />
Society Guidebook, 29th Field Conference, pp. 349-351.<br />
Swanberg, C. A., Morgan, P., Stoyer, C. H., and Witcher, J. C., 1977, An<br />
appraisal study <strong>of</strong> <strong>the</strong> <strong>geo<strong>the</strong>rmal</strong> <strong>resource</strong>s <strong>of</strong> Arizona and adjacent areas<br />
in New Mexico and Utah and <strong>the</strong>ir value for desalination and o<strong>the</strong>r uses:<br />
New Mexico Energy Institute Report 6, New Mexico State University, 76 p.<br />
Thorman, C. H., 1981, Geology <strong>of</strong> <strong>the</strong> Pinaleno Mountains, Arizona a preliminary<br />
report: in Stone C. and Jenney, J. P. eds., Arizona Geological Society<br />
Digest, Vol. 13, p. 5-11.<br />
Titley, S. R., 1976, Evidence for a Mesozoic linear tectonic pattern in sou<strong>the</strong>astern<br />
Arizona: in Tectonic Digest, Arizona Geological Society Digest,<br />
Vol. X, p. 71-101.--<br />
Turner, G. L., 1962, The Deming axis, sou<strong>the</strong>astern Arizona, New Mexico and<br />
Trans-Pecos, Texas: in Mogollon Rim, New Mexico Geological Society<br />
Guidebook, 13th Field Conference, 1962, p. 59-71.<br />
Turner, S. F., and o<strong>the</strong>rs, 1941, Water <strong>resource</strong>s <strong>of</strong> Safford and Duncan-Virden<br />
valleys, Arizona and New Mexico: Arizona State Water Commission, 58 p.<br />
w/analyses by Hem, J. D.<br />
Turner, S. F., and Halpenny, L. C., 1941, Groundwater investigations in <strong>the</strong><br />
upper Gila River valley, New Mexico and Arizona: American Geophysical<br />
Union Transactions 22nd annual meeting, part 3, p. 738-744.<br />
U. S. Geological Survey, files, Water Resources Division <strong>of</strong>fice Tucson.<br />
USGS, 1942, Analyses <strong>of</strong> samples from ground-water sources, Graham and Greenlee<br />
Counties, Arizona: U. S. Geological Survey Mimeo Report, 10 p.<br />
U. S. Geological Survey, WATSTORE water quality computer file.<br />
130
Van Horn, W. L., 1958, Late Cenozoic beds in <strong>the</strong> upper Safford valley, Graham<br />
County, Arizona, unpub. MS Thesis, University <strong>of</strong> Arizona 108 p.<br />
Van Horn, W. L., 1962, Late Cenozoic alluvial deposits <strong>of</strong> <strong>the</strong> upper Safford<br />
valley, Graham County, Arizona: Arizona Geological Society Digest vol.<br />
5, p. 89-96.<br />
Wilson, E. D., and Moore, R. T., 1958, Geologic map Graham and Greenlee Counties,<br />
Arizona: Arizona Bureau <strong>of</strong> Mines<br />
Wilson, R. P., and White, N. D., 1975, Maps showing ground-water conditions<br />
in <strong>the</strong> San Simon area, Cochise and Graham Counties, Arizona and in Hidalgo<br />
County, New Mexico-1975: U. S. Geological Survey Water Resources<br />
Investigations Open-File Report 76-89.<br />
Witcher, J. C., 1979, A preliminary report on <strong>the</strong> <strong>geo<strong>the</strong>rmal</strong> energy <strong>potential</strong><br />
<strong>of</strong> <strong>the</strong> Safford <strong>basin</strong> Sou<strong>the</strong>astern Arizona: in Geo<strong>the</strong>rmal site evaluation<br />
in Arizona, Semi-annual progress report for period July 1978-January 1979,<br />
D.O.E. contract EG-77-S-02-4362, p. 42-72.<br />
White, N. D., 1963, Analysis and evaluation <strong>of</strong> available hydrologic data for<br />
<strong>the</strong> San Simon <strong>basin</strong>, Cochise and Graham Counties, Arizona: U. S. Geological<br />
Survey Water-Supply paper l6l9-DD, 33 p.<br />
White, N. D., and Hardt, W. F., 1965, Electrical-analysis <strong>of</strong> hydrologic data<br />
for San Simon <strong>basin</strong>, Cochise and Graham Counties, Arizona: U. S. Geological<br />
Survey Water-Supply Paper l809-R, 30 p.<br />
White, N. D., and Smith, C. R., 1965, Basic hydrologic data for San Simon<br />
<strong>basin</strong>, Cochise and Graham Counties, Arizona, and Hidalgo County, New<br />
Mexico: Ariz. State Land Department Water Resources Report 21, 42 p.<br />
Wright, J. J., 1971, The occurrence <strong>of</strong> <strong>the</strong>rmal ground-water in <strong>the</strong> Basin and<br />
Range Province <strong>of</strong> Arizona: Hydrology and Water Resources in Arizona and<br />
<strong>the</strong> Southwest, proceedings <strong>of</strong> <strong>the</strong> 1971 meetings <strong>of</strong> <strong>the</strong> Arizona Section<br />
<strong>of</strong> <strong>the</strong> American Water Resources Association,and The Hydrology Section <strong>of</strong><br />
<strong>the</strong> Arizona Academy <strong>of</strong> Science, April 22-23, 1971 Tempe, Arizona, vol. 1,<br />
pp. 269-290.<br />
Wynn, J. C., 1981, Complete bouguer gravity anomally map <strong>of</strong> <strong>the</strong> Silver City<br />
1 0 x 2 0 quadrangle, New Mexico-Arizona: U. S. Geological Survey Miscellaneous<br />
Investigations Map I-13l0....A.<br />
Wynn, J. C., 1981, Principal facts for gravity stations and base-station net<br />
in <strong>the</strong> Silver City 1 0 x 2 0 quadrangle, Arizona and New Mexico: U. S.<br />
Geological Survey Open-File Report 81-40, 118 p.<br />
Wynn, J. C., and Dansereau, D. A., 1979, Preliminary complete Bouguer gravity<br />
anomaly map <strong>of</strong> <strong>the</strong> Silver City two-degree sheet, New Mexico and Arizona,<br />
1:250,000: U. S. Geological Survey Open-File Report 79-708.<br />
131