- Page 1 and 2: NOAA Technical Memorandum NMFS‐PI
- Page 3 and 4: Pacific Islands Fisheries Science C
- Page 5 and 6: ACKNOWLEDGMENTS Many subject matter
- Page 7 and 8: CONTENTS LIST OF FIGURES ..........
- Page 9 and 10: 5.5 Assessing the Critical Risk Thr
- Page 11 and 12: 7.11 Genus Porites ................
- Page 13 and 14: LIST OF FIGURES Figure ES-1. Exampl
- Page 15 and 16: Figure 3.3.6. The impacts of diseas
- Page 17 and 18: Figure 6.5.3. Distribution of point
- Page 19 and 20: Figure 7.5.10. Distribution of poin
- Page 21 and 22: Figure 7.5.54. Distribution of poin
- Page 23 and 24: Figure 7.6.8. Distribution of point
- Page 25 and 26: Figure 7.9.28. Montipora verrilli d
- Page 27: Figure 7.13.7. Leptoseris yabei dis
- Page 31 and 32: Figure 7.24.8. Distribution of poin
- Page 33 and 34: ACRONYMS AAAS AGGRA AIMS AR4 BRT CA
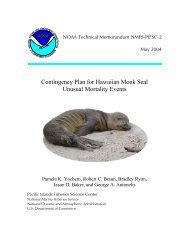
- Page 35 and 36: EXECUTIVE SUMMARY On October 20, 20
- Page 37 and 38: Figure ES-2. Summary of votes talli
- Page 39 and 40: xxxvii
- Page 41 and 42: 1. INTRODUCTION On October 20, 2009
- Page 43 and 44: The NMFS must base its determinatio
- Page 45 and 46: 2. GENERAL BACKGROUND ON CORALS AND
- Page 47 and 48: as some of the Hawaiian Montipora a
- Page 49 and 50: Figure 2.2.1. Diversity of coral li
- Page 51 and 52: on zooplankton can reduce the uptak
- Page 53 and 54: provide net economic benefits of $3
- Page 55 and 56: In some locations, such as Hawai`i,
- Page 57 and 58: Table 2.5.1. Summary of regional co
- Page 59 and 60: 3. THREATS TO CORAL SPECIES 3.1 Hum
- Page 61 and 62: Figure 3.1.1. World population from
- Page 63 and 64: 2,500 People per km 2 Reef Area 2,0
- Page 65 and 66: 3.2 Global Climate Change and Large
- Page 67 and 68: 1980), more recent work indicates t
- Page 69 and 70: forces put into place by anthropoge
- Page 71 and 72: 3.2.2.1 Coral bleaching High temper
- Page 73 and 74: Figure 3.2.7. Global map of reef ar
- Page 75 and 76: Figure 3.2.8. Predicted phytoplankt
- Page 77 and 78: The dynamics of carbonate chemistry
- Page 79 and 80:
Figure 3.2.14. (Top and middle rows
- Page 81 and 82:
other branching corals (Langdon and
- Page 83 and 84:
Species Lophelia pertusa (cold wate
- Page 85 and 86:
3.2.3.2. Increased erosion Another
- Page 87 and 88:
as sea-level rise proceeds. Greater
- Page 89 and 90:
Figure 3.2.19. The impacts of chang
- Page 91 and 92:
ecosystems (Garrison et al., 2003).
- Page 93 and 94:
chemicals such as pesticides. Eleva
- Page 95 and 96:
Figure 3.3.1. The impacts of sedime
- Page 97 and 98:
1999; Thacker et al., 2001) because
- Page 99 and 100:
Other demonstrated sublethal effect
- Page 101 and 102:
3.3.1.4 Salinity impacts Many coral
- Page 103 and 104:
Some evidence show that seawater sa
- Page 105 and 106:
Figure 3.3.6. The impacts of diseas
- Page 107 and 108:
Figure 3.3.7. The impacts of predat
- Page 109 and 110:
Important synergies of corallivory
- Page 111 and 112:
facilitates coral recruitment), and
- Page 113 and 114:
The recent Reefs at Risk Revisited
- Page 115 and 116:
eplenish themselves from distant po
- Page 117 and 118:
eview, the BRT considers tsunami an
- Page 119 and 120:
Figure 3.3.12. Global analysis of r
- Page 121 and 122:
Au`au Channel is a thermocline, a d
- Page 123 and 124:
A very recent independent global an
- Page 125 and 126:
Unapparent effects are another comp
- Page 127 and 128:
4. DEMOGRAPHIC AND SPATIAL FACTORS
- Page 129 and 130:
the same environmental threats (e.g
- Page 131 and 132:
in identifying species in the field
- Page 133 and 134:
4.5.1 Critical Risk Threshold and d
- Page 135 and 136:
Figure 4.5.2. Number of successful
- Page 137 and 138:
(Rasher and Hay, 2010) and can redu
- Page 139 and 140:
5. METHODS 5.1 Overview In evaluati
- Page 141 and 142:
5.6 BRT Voting To estimate the like
- Page 143 and 144:
In establishing the approaches used
- Page 145 and 146:
Figure 6.1.2. Agaricia lamarcki dis
- Page 147 and 148:
Acidification: No specific research
- Page 149 and 150:
6.2 Genus Mycetophyllia (Family Mus
- Page 151 and 152:
Mycetophyllia ferox cover to be con
- Page 153 and 154:
6.3 Genus Dendrogyra (Family Meandr
- Page 155 and 156:
Depth range: Dendrogyra cylindrus h
- Page 157 and 158:
Risk Assessment Figure 6.3.5. Distr
- Page 159 and 160:
Evolutionary and geologic history:
- Page 161 and 162:
Disease: Dichocoenia stokesi has be
- Page 163 and 164:
6.5 Genus Montastraea (Family Favii
- Page 165 and 166:
Figure 6.5. Examples of declining a
- Page 167 and 168:
genetic variability in the molecula
- Page 169 and 170:
6.5.1 Montastraea faveolata Ellis a
- Page 171 and 172:
Risk Assessment Figure 6.5.3. Distr
- Page 173 and 174:
Figure 6.5.5. Montastraea franksi d
- Page 175 and 176:
6.5.3 Montastraea annularis Ellis a
- Page 177 and 178:
Risk Assessment Figure 6.5.10. Dist
- Page 179 and 180:
Figure 7.1.2. Millepora foveolata d
- Page 181 and 182:
Risk Assessment Figure 7.1.3. Distr
- Page 183 and 184:
Family: Milleporidae. Evolutionary
- Page 185 and 186:
Land-based sources of pollution (LB
- Page 187 and 188:
7.2 Genus Heliopora (Class Anthozoa
- Page 189 and 190:
Within federally protected waters,
- Page 191 and 192:
Acidification: No specific research
- Page 193 and 194:
7.3 Genus Pocillopora (Class Anthoz
- Page 195 and 196:
Acidification: One recent study (Ma
- Page 197 and 198:
Figure 7.3.2. Pocillopora danae dis
- Page 199 and 200:
Predation: Pocillopora species are
- Page 201 and 202:
7.3.2 Pocillopora elegans Dana, 186
- Page 203 and 204:
Within federally protected waters,
- Page 205 and 206:
Risk Assessment The nominal candida
- Page 207 and 208:
Central and Indo-Pacific Pocillopor
- Page 209 and 210:
Figure 7.4.3. Seriatopora aculeata
- Page 211 and 212:
Risk Assessment Figure 7.4.4. Distr
- Page 213 and 214:
Life History Acropora are sessile c
- Page 215 and 216:
drop out (Randall and Birkeland, 19
- Page 217 and 218:
Island in the southeastern Pacific
- Page 219 and 220:
Land-based sources of pollution (LB
- Page 221 and 222:
Figure 7.5.8. Acropora acuminata di
- Page 223 and 224:
Risk Assessment Figure 7.5.10. Dist
- Page 225 and 226:
Taxonomy Taxonomic issues: None. Fa
- Page 227 and 228:
Although range expansion was not di
- Page 229 and 230:
7.5.4 Acropora dendrum Bassett-Smit
- Page 231 and 232:
Life History Acropora dendrum is a
- Page 233 and 234:
7.5.5 Acropora donei Veron and Wall
- Page 235 and 236:
Acidification: No specific research
- Page 237 and 238:
7.5.6 Acropora globiceps Dana, 1846
- Page 239 and 240:
Life History Acropora globiceps is
- Page 241 and 242:
7.5.7 Acropora horrida Dana 1846 Fi
- Page 243 and 244:
Life History Acropora horrida is a
- Page 245 and 246:
7.5.8 Acropora jacquelineae Wallace
- Page 247 and 248:
Abundance Abundance of Acropora hor
- Page 249 and 250:
7.5.9 Acropora listeri Brook, 1893
- Page 251 and 252:
Life History Acropora listeri is a
- Page 253 and 254:
7.5.10 Acropora lokani Wallace, 199
- Page 255 and 256:
Life History Acropora lokani is ass
- Page 257 and 258:
7.5.11 Acropora microclados Ehrenbe
- Page 259 and 260:
Threats For each of these possible
- Page 261 and 262:
7.5.12 Acropora palmerae Wells, 195
- Page 263 and 264:
Life History Acropora palmerae is a
- Page 265 and 266:
7.5.13 Acropora paniculata Verrill,
- Page 267 and 268:
Abundance Abundance of Acropora pan
- Page 269 and 270:
7.5.14 Acropora pharaonis Milne Edw
- Page 271 and 272:
Abundance Abundance of Acropora pha
- Page 273 and 274:
7.5.15 Acropora polystoma Brook, 18
- Page 275 and 276:
Threats For each of these possible
- Page 277 and 278:
7.5.16. Acropora retusa Dana, 1846
- Page 279 and 280:
Threats For each of these possible
- Page 281 and 282:
7.5.16 Acropora rudis Rehberg, 1892
- Page 283 and 284:
et al., 2009). While ocean acidific
- Page 285 and 286:
7.5.17 Acropora speciosa Quelch, 18
- Page 287 and 288:
Threats For each of these possible
- Page 289 and 290:
7.5.18 Acropora striata Verrill, 18
- Page 291 and 292:
Threats For each of these possible
- Page 293 and 294:
7.5.19 Acropora tenella Brook, 1892
- Page 295 and 296:
Disease: In general, Acropora speci
- Page 297 and 298:
7.5.20 Acropora vaughani Wells, 195
- Page 299 and 300:
Threats For each of these possible
- Page 301 and 302:
7.5.21 Acropora verweyi Veron and W
- Page 303 and 304:
A search of published and unpublish
- Page 305 and 306:
Factors that increase the potential
- Page 307 and 308:
Figure 7.6.3. Anacropora puertogale
- Page 309 and 310:
Risk assessment Figure 7.6.4. Distr
- Page 311 and 312:
Figure 7.6.7. Anacropora spinosa di
- Page 313 and 314:
Factors that increase the potential
- Page 315 and 316:
Figure 7.7.3. Astreopora cucullata
- Page 317 and 318:
Risk Assessment Figure 7.7.4. Distr
- Page 319 and 320:
Isopora has recently been considere
- Page 321 and 322:
Acidification: No specific research
- Page 323 and 324:
7.8.2 Isopora cuneata Dana, 1846 Fi
- Page 325 and 326:
U.S. Distribution According to both
- Page 327 and 328:
Risk Assessment Figure 7.8.10. Dist
- Page 329 and 330:
Life History Of the 35 species of M
- Page 331 and 332:
Figure 7.9.3. Montipora angulata di
- Page 333 and 334:
Risk Assessment Figure 7.9.4. Distr
- Page 335 and 336:
Figure 7.9.7. Montipora australiens
- Page 337 and 338:
Factors that increase the potential
- Page 339 and 340:
Global Distribution Global distribu
- Page 341 and 342:
Risk Assessment Figure 7.9.12. Dist
- Page 343 and 344:
Figure 7.9.15. Montipora caliculata
- Page 345 and 346:
Risk Assessment Figure 7.9.16. Dist
- Page 347 and 348:
Taxonomy Taxonomic issues: Importan
- Page 349 and 350:
Land-based sources of pollution (LB
- Page 351 and 352:
7.9.6 Montipora lobulata Bernard, 1
- Page 353 and 354:
(Albright et al., 2010) and is like
- Page 355 and 356:
7.9.7 Montipora patula (/verrili) B
- Page 357 and 358:
Threats Thermal stress: Montipora s
- Page 359 and 360:
7.10 Genus Alveopora (Family Poriti
- Page 361 and 362:
Life History Reproductive character
- Page 363 and 364:
7.10.2 Alveopora fenestrata Lamarck
- Page 365 and 366:
Threats Temperature stress: The gen
- Page 367 and 368:
7.10.3 Alveopora verrilliana Dana,
- Page 369 and 370:
Life History Alveopora verrilliana
- Page 371 and 372:
7.11 Genus Porites 7.11.1 Porites h
- Page 373 and 374:
Threats Temperature stress: Massive
- Page 375 and 376:
7.11.2 Porites napopora Veron, 2000
- Page 377 and 378:
Habitat Habitat: Porites napopora h
- Page 379 and 380:
7.11.3 Porites nigrescens Dana, 184
- Page 381 and 382:
of all other Porites species studie
- Page 383 and 384:
7.11.4 Porites pukoensis Vaughan, 1
- Page 385 and 386:
Life History The reproductive chara
- Page 387 and 388:
Risk Assessment of Porites clade 1
- Page 389 and 390:
7.12 Genus Psammocora (Family Sider
- Page 391 and 392:
Abundance Abundance of Psammocora s
- Page 393 and 394:
7.13 Genus Leptoseris (Family Agari
- Page 395 and 396:
Life History The reproductive chara
- Page 397 and 398:
7.13.2 Leptoseris yabei Pillai and
- Page 399 and 400:
Life History The reproductive chara
- Page 401 and 402:
7.14 Genus Pachyseris 7.14.1 Pachys
- Page 403 and 404:
ased on elevated temperatures and l
- Page 405 and 406:
7.15 Genus Pavona 7.15.1 Pavona bip
- Page 407 and 408:
Threats Temperature stress: Pavona
- Page 409 and 410:
7.15.2 Pavona cactus Forskål, 1775
- Page 411 and 412:
Life History Pavona cactus is a gon
- Page 413 and 414:
7.15.3 Pavona decussata Dana, 1846
- Page 415 and 416:
Life History The reproductive chara
- Page 417 and 418:
7.15.4 Pavona diffluens Lamarck, 18
- Page 419 and 420:
Threats Temperature stress: Pavona
- Page 421 and 422:
7.15.5 Pavona venosa (Ehrenberg, 18
- Page 423 and 424:
Life History The reproductive chara
- Page 425 and 426:
7.16 Genus Galaxea (Family Oculinid
- Page 427 and 428:
Abundance Galaxea astreata can be a
- Page 429 and 430:
7.17 Genus Pectinia (Family Pectini
- Page 431 and 432:
Acidification: Pectinia alcicornis
- Page 433 and 434:
7.18 Genus Acanthastrea (Family Mus
- Page 435 and 436:
Abundance Abundance of Acanthastrea
- Page 437 and 438:
7.18.2 Acanthastrea hemprichii Ehre
- Page 439 and 440:
Life History Reproductive character
- Page 441 and 442:
7.18.3 Acanthastrea ishigakiensis V
- Page 443 and 444:
Life History Reproductive character
- Page 445 and 446:
7.18.4 Acanthastrea regularis Veron
- Page 447 and 448:
Although specific larval descriptio
- Page 449 and 450:
7.19 Genus Barabattoia (Family Favi
- Page 451 and 452:
Threats Temperature stress: Unknown
- Page 453 and 454:
7.20 Genus Caulastrea 7.20.1 Caulas
- Page 455 and 456:
Threats Thermal stress: Unknown, bu
- Page 457 and 458:
7.21 Genus Cyphastrea 7.21.1 Cyphas
- Page 459 and 460:
Threats Thermal stress: The genus C
- Page 461 and 462:
7.21.2 Cyphastrea ocellina Dana, 18
- Page 463 and 464:
skeletal deposition is reduced unde
- Page 465 and 466:
7.22 Genus Euphyllia (Family Caryop
- Page 467 and 468:
Bruckner and Hill, 2009) and eviden
- Page 469 and 470:
7.22.2 Euphyllia paraancora Veron,
- Page 471 and 472:
Threats Thermal stress: Euphyllia p
- Page 473 and 474:
7.22.3 Euphyllia paradivisa Veron,
- Page 475 and 476:
Threats Thermal stress: Euphyllia s
- Page 477 and 478:
7.23 Genus Physogyra 7.23.1 Physogy
- Page 479 and 480:
al., 2007; Silverman et al., 2009).
- Page 481 and 482:
7.24 Genus Turbinaria (Family Dendr
- Page 483 and 484:
Threats Thermal stress: Bleaching i
- Page 485 and 486:
7.24.2 Turbinaria peltata (Esper, 1
- Page 487 and 488:
Acidification: A congener Turbinari
- Page 489 and 490:
7.24.3 Turbinaria reniformis Bernar
- Page 491 and 492:
Threats Thermal stress: Bleaching i
- Page 493 and 494:
7.24.4 Turbinaria stellulata Lamarc
- Page 495 and 496:
Life History The reproductive chara
- Page 497 and 498:
8. SYNTHESIS OF RISK ASSESSMENTS: T
- Page 499 and 500:
459
- Page 501 and 502:
Figure 8.2. Number of coral species
- Page 503 and 504:
Albright, R., Mason B., and Langdon
- Page 505 and 506:
Baggett, L. S., and Bright T. J. 19
- Page 507 and 508:
Bellwood, D., Hoey A., and Choat J.
- Page 509 and 510:
Brodie, J., Fabricius K., De'ath G.
- Page 511 and 512:
Carilli, J. E., Norris R. D., Black
- Page 513 and 514:
Coffroth, M. A. 1985. Mucus sheet f
- Page 515 and 516:
Cox, E. F. 1986. The effects of a s
- Page 517 and 518:
DESA, U. N. 2001. World Population
- Page 519 and 520:
Eakin, C. M., Feingold J. S., and G
- Page 521 and 522:
Feingold, J. S. 1996. Coral survivo
- Page 523 and 524:
Gardella, D. J., and Edmunds P. J.
- Page 525 and 526:
Glynn, P. W., Colley S. B., Ting J.
- Page 527 and 528:
Grover, R., Maguer J., Allemand D.,
- Page 529 and 530:
Hawkins, J. P., and Roberts C. M. 1
- Page 531 and 532:
Hubbard, D. K. 1992. Hurricane-indu
- Page 533 and 534:
Isdale, P. J., Stewart B. J., Tickl
- Page 535 and 536:
Kennedy, C. J., Gassman N. J., and
- Page 537 and 538:
Lafferty, K. D., Porter J. W., and
- Page 539 and 540:
Lindahl, U. 2003. Coral reef rehabi
- Page 541 and 542:
Maragos, J. E. 1993. Impact of coas
- Page 543 and 544:
McCormick, M. I. 2003. Consumption
- Page 545 and 546:
Morse, D. E., Morse A. N. C., Raimo
- Page 547 and 548:
Nugues, M., Delvoye L., and Bak R.
- Page 549 and 550:
Petit, J. R., Jouzel J., Raynaud D.
- Page 551 and 552:
Randall, C. J., and Szmant A. M. 20
- Page 553 and 554:
Riegl, B. 1996. Hermatypic coral fa
- Page 555 and 556:
Rotjan, R. 2007. The patterns, caus
- Page 557 and 558:
Siddall, M., Rohling E. J., Almogi-
- Page 559 and 560:
Streamer, M. 1980. Urea and arginin
- Page 561 and 562:
Titlyanov, E. A., and Latypov Y. Y.
- Page 563 and 564:
Venn, A. A., Quinn J., Jones R., an
- Page 565 and 566:
Ward, S. 1992. Evidence for broadca
- Page 567 and 568:
Williams, I.D., Walsh W., Schroeder
- Page 569 and 570:
Yost, D. M., Jones R. J., and Mitch
- Page 571 and 572:
Errata Erroneous references: IPCC.
- Page 573 and 574:
APPENDIX: Millepora boschmai (De We
- Page 575 and 576:
According to de Weerdt and Glynn (1
- Page 577 and 578:
The overall likelihood that Millepo
- Page 579 and 580:
Glynn, P. W., J. L. Mate, A. C. Bak
- Page 581:
Availability of NOAA Technical Memo