Supply Chain Report - Logistics Association of Australia
Supply Chain Report - Logistics Association of Australia
Supply Chain Report - Logistics Association of Australia

Create successful ePaper yourself
Turn your PDF publications into a flip-book with our unique Google optimized e-Paper software.
2000<br />
2001<br />
2002<br />
2003<br />
2004<br />
2005<br />
2006<br />
2007<br />
2008<br />
2009<br />
2010<br />
2011<br />
2012<br />
2013<br />
2014<br />
2015<br />
2016<br />
2017<br />
2018<br />
2019<br />
2020<br />
S u p p l y C h a i n R e p o r t 2 0 1 0<br />
Section B: Market Update<br />
An Update on Climate Change<br />
Business Response to the Climate Change Issue<br />
• <strong>Australia</strong>n federal and state governments have been<br />
working on policy and legislation to reduce greenhouse gas<br />
emissions since 2002.<br />
• At present, the direction <strong>of</strong> any major legislation is unclear<br />
after the government decided to defer the introduction <strong>of</strong> the<br />
Emission Trading Scheme (ETS) until 2013.<br />
• Despite the uncertainty <strong>of</strong> government speed and directions<br />
around climate change policy and legislation, global<br />
businesses continue to put climate change initiatives on top<br />
<strong>of</strong> their agenda according to the surveys conducted by both<br />
Ernst & Young and PwC [36,32].<br />
Latest Update on <strong>Australia</strong>’a Greenhouse Gas Emission Level<br />
<strong>Australia</strong>’s National Greenhouse Gas Inventory<br />
Category<br />
Annual Emissions through to March<br />
quarter (MillionTon CO2)<br />
% change<br />
in annual<br />
emissions<br />
March quarter 2008 March quarter 2009<br />
National Inventory<br />
Energy: Electricity<br />
Energy: Stationary energy<br />
Energy: Transport<br />
Energy: Fugitive emissions<br />
Industrial processes<br />
Waster<br />
Agriculture<br />
National Inventory Total<br />
200<br />
94<br />
80<br />
38<br />
31<br />
15<br />
90<br />
548<br />
201<br />
94<br />
80<br />
40<br />
31<br />
15<br />
91<br />
552<br />
0.80%<br />
0.20%<br />
-0.50%<br />
5.10%<br />
-0.40%<br />
0.60%<br />
0.50%<br />
0.70%<br />
Source: Departmant <strong>of</strong> Climate Change [31]<br />
• This section highlights the latest change in <strong>Australia</strong>n<br />
Greenhouse Gas Inventory, and reports the current progress<br />
against the target and updates <strong>of</strong> some <strong>of</strong> the industryrelated<br />
initiatives.<br />
National Greenhouse Gas Emission Level<br />
• In the 12 months ending March 2010, <strong>Australia</strong>’s<br />
greenhouse gas emissions declined slightly to approximately<br />
542 million tonnes, or about a 1 per cent reduction from the<br />
previous year.<br />
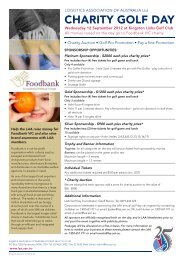
Greenhouse Gas Emission Reduction Target<br />
Against the Target<br />
• The 532 million tonnes emission recorded in<br />
2010 is a 1.4% decrease from the peak <strong>of</strong> 549<br />
million tonnes in 2008.<br />
• When compared to 2000, the emission level<br />
has increased approximately 9 per cent.<br />
• Over ten years, the government scheme aims<br />
to reduce between 5 to 15% from emission levels<br />
recorded in 2000.<br />
Million Ton CO2<br />
600<br />
500<br />
400<br />
300<br />
200<br />
100<br />
0<br />
<strong>Australia</strong>’s Greenhouse Gas Emission Target<br />
GDP ($m)<br />
Minimum Reduction<br />
Target 5% <strong>of</strong> 2000 level<br />
Ambitious Target, 25%<br />
reduction from 2000 level<br />
Year<br />
• The government also plans to commit to a<br />
more ambitious target <strong>of</strong> 25% reduction if the<br />
450 parts per million CO 2<br />
target is endorsed<br />
by global members.<br />
Source: Departmant <strong>of</strong> Climate Change [31]<br />
www.laa.asn.au 15