Supply Chain Report - Logistics Association of Australia
Supply Chain Report - Logistics Association of Australia
Supply Chain Report - Logistics Association of Australia

You also want an ePaper? Increase the reach of your titles
YUMPU automatically turns print PDFs into web optimized ePapers that Google loves.
S u p p l y C h a i n R e p o r t 2 0 1 0<br />
Section D: <strong>Australia</strong>n Industry Performance<br />
International <strong>Logistics</strong> Performance Index<br />
• <strong>Australia</strong>’s <strong>Logistics</strong> Performance ranked<br />
18th <strong>of</strong> 150 countries in 2010, down one<br />
place from the previous ranking in 2007.<br />
• Average LPI is currently at 3.84, up<br />
from 3.79. The scores on each <strong>of</strong> the key<br />
dimensions are displayed in the table.<br />
• It is noted that <strong>Australia</strong> is rated better on<br />
every dimension except Track & Trace.<br />
Source: World Bank [17]<br />
LPI<br />
Rank<br />
1<br />
2<br />
3<br />
4<br />
5<br />
6<br />
7<br />
8<br />
9<br />
10<br />
11<br />
12<br />
13<br />
14<br />
15<br />
16<br />
17<br />
18<br />
19<br />
20<br />
Previous<br />
Rank<br />
3<br />
1<br />
4<br />
2<br />
23<br />
7<br />
6<br />
9<br />
12<br />
16<br />
11<br />
15<br />
8<br />
10<br />
14<br />
13<br />
18<br />
17<br />
5<br />
21<br />
Germany<br />
Singapore<br />
Sweden<br />
Netherlands<br />
Luxembourg<br />
Switzerland<br />
Japan<br />
United Kingdom<br />
Belgium<br />
Norway<br />
Ireland<br />
Finland<br />
Hong Kong, China<br />
Canada<br />
United States<br />
Denmark<br />
France<br />
<strong>Australia</strong><br />
Austria<br />
Taiwan<br />
4.11<br />
4.09<br />
4.08<br />
4.07<br />
3.98<br />
3.97<br />
3.97<br />
3.95<br />
3.94<br />
3.93<br />
3.89<br />
3.89<br />
3.88<br />
3.87<br />
3.86<br />
3.85<br />
3.84<br />
3.84<br />
3.76<br />
3.71<br />
4.00<br />
4.02<br />
3.88<br />
3.98<br />
4.04<br />
3.73<br />
3.79<br />
3.74<br />
3.83<br />
3.86<br />
3.60<br />
3.86<br />
3.83<br />
3.71<br />
3.68<br />
3.58<br />
3.63<br />
3.68<br />
3.49<br />
3.35<br />
4.34<br />
4.22<br />
4.03<br />
4.25<br />
4.06<br />
4.17<br />
4.19<br />
3.95<br />
4.01<br />
4.22<br />
3.76<br />
4.08<br />
4.00<br />
4.03<br />
4.15<br />
3.99<br />
4.00<br />
3.78<br />
3.68<br />
3.62<br />
3.66<br />
3.86<br />
3.83<br />
3.61<br />
3.67<br />
3.32<br />
3.55<br />
3.66<br />
3.31<br />
3.35<br />
3.70<br />
3.41<br />
3.67<br />
3.24<br />
3.21<br />
3.46<br />
3.30<br />
3.78<br />
3.78<br />
3.64<br />
4.14<br />
4.12<br />
4.22<br />
4.15<br />
3.67<br />
4.32<br />
4.00<br />
3.92<br />
4.13<br />
3.85<br />
3.82<br />
3.92<br />
3.83<br />
3.99<br />
3.92<br />
3.83<br />
3.87<br />
3.77<br />
3.70<br />
3.65<br />
Tracking &<br />
Tracing<br />
4.18<br />
4.15<br />
4.22<br />
4.12<br />
3.92<br />
4.27<br />
4.13<br />
4.13<br />
4.22<br />
4.10<br />
4.02<br />
4.09<br />
3.94<br />
4.01<br />
4.17<br />
3.94<br />
4.01<br />
3.87<br />
3.83<br />
4.04<br />
International <strong>Logistics</strong> Performance Index 2010<br />
Country LPI Customs Infrastructure<br />
International <strong>Logistics</strong><br />
Shipments<br />
Competence<br />
Timeliness<br />
4.48<br />
4.23<br />
4.32<br />
4.41<br />
4.58<br />
4.20<br />
4.26<br />
4.37<br />
4.29<br />
4.35<br />
4.47<br />
4.08<br />
4.04<br />
4.41<br />
4.19<br />
4.38<br />
4.37<br />
4.16<br />
4.08<br />
3.95<br />
Total Business Inventory<br />
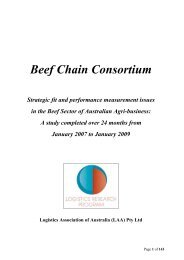
• The cost <strong>of</strong> Total Business Inventory reduced during 2009 to<br />
about $130 billion in December and came back up slightly to<br />
$134 billion in June 2010 Quarter.<br />
• The significant fall <strong>of</strong> inventory level could be linked to the<br />
reaction <strong>of</strong> businesses to the economic crisis. It is expected<br />
that the level <strong>of</strong> inventory will be higher in 2010-2011 because<br />
<strong>of</strong> an improved economic outlook together with the strength <strong>of</strong><br />
the <strong>Australia</strong>n currency. Total inventory alone cannot provide a<br />
full picture <strong>of</strong> the industry performance.<br />
Total Business Inventory (June 2000 to June 2010)<br />
$m<br />
Inventories (Book Value, Current Prices)<br />
160,000<br />
140,000<br />
120,000<br />
100,000<br />
80,000<br />
60,000<br />
40,000<br />
20,000<br />
0<br />
GDP ($m)<br />
Period<br />
Jun Jun Jun Jun Jun Jun Jun Jun Jun Jun Jun<br />
00 01 02 03 04 05 06 07 08 09 10<br />
Source: ABS [4]<br />
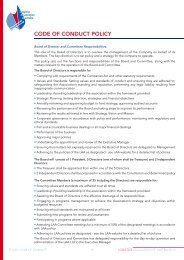
Inventory to Sales Ratio<br />
• In the last report it was noted that the Inventory to Sales ratio<br />
climbed slightly during 2009, which could suggest the delay <strong>of</strong><br />
the industry’s response to declining sales.<br />
• The Inventory to Sales ratio improved again in 2010. Part<br />
<strong>of</strong> the reason could be that business is still cautious about<br />
prospects and avoids building up levels <strong>of</strong> inventory.<br />
• Overall, the Inventory to Sales ratio has continued to improve<br />
over the years due to improved supply chain management<br />
practices.<br />
Ratio<br />
Inventory to Sales Ratio (June 2000 to June 2010)<br />
1.00<br />
0.90<br />
0.80<br />
0.70<br />
0.60<br />
0.50<br />
0.40<br />
0.30<br />
0.20<br />
0.10<br />
Period<br />
0.0<br />
Jun<br />
00<br />
Jun<br />
01<br />
Jun<br />
02<br />
Jun<br />
03<br />
Jun<br />
04<br />
Jun<br />
05<br />
Jun<br />
06<br />
Jun<br />
07<br />
Jun<br />
08<br />
Jun<br />
09<br />
Jun<br />
10<br />
Source: ABS [3]<br />
www.laa.asn.au 23