Lab #6 - Cellular Respiration
Lab #6 - Cellular Respiration
Lab #6 - Cellular Respiration

Create successful ePaper yourself
Turn your PDF publications into a flip-book with our unique Google optimized e-Paper software.
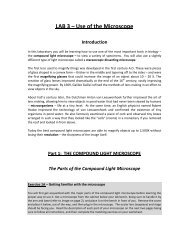
LAB 6 – Fermentation & <strong>Cellular</strong> <strong>Respiration</strong><br />
INTRODUCTION<br />
The cells of all living organisms require energy to keep themselves alive and fulfilling their roles.<br />
Where does this energy come from? The answer is energy released from molecules of the<br />
nucleotide adenosine triphosphate or ATP.<br />
As you can see from the diagram above, the hydrolysis of ATP to ADP (adenosine diphosphate)<br />
and inorganic phosphate (P i ) is exergonic and thus releases energy which cells can use to do any<br />
number of things. Once hydrolyzed, ATP can be regenerated from ADP and P i , though this is<br />
endergonic and thus requires energy. The energy needed to regenerate ATP is obtained from<br />
“food”, whatever that may be.<br />
The food we eat is first digested by enzymes as you learned in the previous lab. Once the<br />
polymers in your food (e.g., polysaccharides, triglycerides, protein) have been broken down by<br />
enzymes into monomers (e.g., monosaccharides such as glucose, fatty acids, amino acids), they<br />
enter the blood circulation and are delivered to the cells of the body. Within cells, the processes<br />
of fermentation and cellular respiration will further catabolize (break down) these molecules,<br />
harvesting the energy they contain for the synthesis of ATP.<br />
Let us now take a brief look at fermentation and cellular respiration to see how each process<br />
produces ATP using energy released from molecules of glucose. Keep in mind that, although we<br />
are focusing on glucose, other molecules such as fatty acids can be used for the same purpose,<br />
though in slightly different ways.
Part 1: FERMENTATION<br />
To produce ATP from glucose, whether by fermentation or cellular respiration, cells must first<br />
partially break it down by glycolysis (“sugar” “separation”). The enzymes involved in glycolysis<br />
are located in the cell cytoplasm and sequentially break down each 6-carbon molecule of<br />
glucose to two 3-carbon molecules of pyruvate. In the process, enough energy is extracted to<br />
produce 2 molecules of ATP.<br />
glucose (6-carbons) 2 pyruvate (3-carbons)<br />
energy<br />
2 ADP + 2 P i 2 ATP<br />
In conjunction with glycolysis, cells will carry out fermentation if there is no oxygen (O 2 )<br />
available. When you overexert yourself for example, your muscles do not receive enough<br />
oxygen and temporarily ferment glucose. In another familiar example, yeast will ferment when<br />
placed in an enclosed environment with a source of carbohydrate such as grapes (for making<br />
wine) or hops and barley (for making beer).<br />
Interestingly, fermentation does not produce any additional ATP. What it does do is regenerate<br />
an important molecule needed for a particular step in glycolysis. This molecule is the electron<br />
carrier NAD + , which if depleted will bring a halt to glycolysis and ATP production, resulting in cell<br />
death. Fermentation therefore contributes to ATP production indirectly by allowing glycolysis,<br />
and the production of 2 ATP per glucose, to continue unhindered.<br />
2 NAD + 2 NADH 2 NAD +<br />
2H - 2H -<br />
glucose 2 pyruvate 2 fermentation products<br />
2 ADP + 2 P i 2 ATP<br />
Glycolysis<br />
Fermentation<br />
As shown above, NAD + , an empty electron carrier, is converted to NADH, a full electron carrier<br />
(the electrons being “carried” are associated with the hydrogen atom) during glycolysis.<br />
Fermentation is simply one or more biochemical steps that transfer the H in NADH and an extra<br />
electron to a molecule of pyruvate. As a result, NADH is restored to NAD + , which is needed for<br />
glycolysis, and pyruvate is converted to a “fermentation product” which can be a variety of<br />
things depending on the organism.<br />
Animals, including human beings, produce lactic acid when their cells ferment. In organisms<br />
from other kingdoms the fermentation products can be quite different. Some bacterial species<br />
produce acetic acid (vinegar) when they ferment, whereas others produce acetone (the main<br />
ingredient in nail polish) or other organic molecules. In the Kingdom Fungi, single-celled yeasts
when fermenting will produce CO 2 and ethanol instead. This process, known as alcohol<br />
fermentation, is the basis for beer and wine production. Regardless of the fermentation<br />
products, the purpose of fermentation is always the same – to regenerate NAD + so that<br />
glycolysis can continue to produce 2 ATP per glucose without interruption.<br />
In the following exercise you will investigate alcohol fermentation in yeast under different<br />
conditions and measure the production of one fermentation product – CO 2 .<br />
Exercise 1 – Observing and Measuring Alcohol Fermentation in Yeast<br />
1. You will use the following table to mix the proper amounts<br />
of water, yeast solution and corn syrup (a source of sugar)<br />
in small beakers. Be sure to add the yeast last. This will<br />
allow the reactions to begin at approximately the same<br />
time. Before you begin, review the experiment, write<br />
your hypothesis on your worksheet, and identify the<br />
independent and dependent variables as well as the<br />
control.<br />
Tube #1 Tube #2 Tube #3<br />
Water 8 ml 6 ml 4 ml<br />
Yeast 0 ml 2 ml 4 ml<br />
Corn syrup 4 ml 4 ml 4 ml<br />
TOTAL 12 ml 12 ml 12 ml<br />
1. Once complete, transfer each mixture to a labeled<br />
saccharometer (do not overfill), then gently tilt until no air<br />
is trapped inside the top of the tube. At this point you will<br />
begin the timing of your experiment (record on your<br />
worksheet).<br />
saccharometer<br />
2. At 5 minute intervals, use the graduations on the side of the saccharometer to read the volume<br />
of gas collected in ml for a total of 30 minutes.<br />
3. Record the data on your worksheet, graph the data, and answer any associated questions.<br />
Part 2: CELLULAR RESPIRATION<br />
While 2 ATP per glucose molecule is clearly better than nothing, it is not nearly enough to meet<br />
the energy needs of complex multicellular organisms such as plants and animals. To get the<br />
maximum ATP yield from molecules of glucose requires cellular respiration, which and produce<br />
up to 36 ATP per glucose molecule. In aerobic organisms, cellular respiration requires O 2 (which<br />
is why we breathe!), hence the term aerobic respiration.
The overall process of cellular respiration can be summarized in the following equation:<br />
glucose oxygen carbon dioxide water<br />
C 6 H 12 O 6 + 6 O 2 6 CO 2 + 6 H 2 O<br />
energy<br />
36 ADP + 36 P i 36 ATP<br />
In eukaryotic cells, cellular respiration begins with glycolysis in the cytoplasm and continues in<br />
the mitochondria as outlined below:<br />
The Citric Acid Cycle – This is a biochemical pathway involved in breaking pyruvate<br />
down to CO 2 . In the process, energy rich electrons in hydrogen atoms are transferred to<br />
NAD + and FAD producing NADH and FADH 2 . In addition, 2 ATP per original glucose are<br />
also produced.<br />
Oxidative Phosphorylation – This is the process by which the remaining 32 ATP<br />
molecules are produced involving two distinct stages:<br />
<br />
Electron Transport - electrons gathered by NADH and FADH 2 during glycolysis<br />
and the citric acid cycle are used to produce an H + gradient within mitochondria<br />
in a process that requires O 2<br />
Chemiosmosis – the H + gradient produced by electron transport provides<br />
energy for ATP synthase to make 32 ATP per original glucose<br />
The importance of O 2 for cellular respiration cannot be overemphasized. O 2 is the final electron<br />
acceptor in the electron transport chain. Without O 2 electron transport does not occur, bringing<br />
cellular respiration to a halt, and the only option for ATP production is fermentation. This means<br />
2 ATP per glucose instead of 36. The cell diagram below summarizes fermentation and cellular<br />
respiration in relation to O 2 and where each process occurs in eukaryotic cells, and the number<br />
of ATP molecules produced.<br />
FERMENTATION<br />
no O 2<br />
Glycolysis<br />
O 2 present<br />
2 ATP (per glucose)<br />
CELLULAR<br />
RESPIRATION<br />
Citric Acid Cycle<br />
Oxidative Phosphorylation<br />
2 ATP (per glucose)<br />
32 ATP<br />
(per glucose)
In the next exercise you will detect the oxidation of succinate, a metabolic intermediate in the<br />
Citric Acid Cycle, as evidence of cellular respiration. Succinate dehydrogenase (SDH) is an<br />
enzyme in the Citric Acid Cycle which catalyzes the removal of 2 hydrogens from succinate (i.e.,<br />
the oxidation of succinate) which are transfered to the electron carrier FAD. This yields the<br />
products fumarate and FADH 2 as shown below:<br />
FAD + succinate<br />
succinate<br />
dehydrogenase<br />
FADH 2 + fumarate<br />
FADH 2 in turn will donate the electrons from these 2 hydrogens to coenzyme Q in the electron<br />
transport chain. The compound DCPIP (di-chlorophenol-indophenol) is not normally found in<br />
cells, however when added to mitochondria it will substitute for coenzyme Q and receive<br />
electrons from FADH 2 . Before receiving the electrons (in its oxidized state) DCPIP is a blue color,<br />
however after receiving the electrons (being reduced by FADH 2 ) DCPIP is colorless. Because of<br />
this color change, DCPIP is a good indicator of respiration as illustrated below.<br />
fumarate<br />
SDH<br />
succinate<br />
DCPIP<br />
DCPIP<br />
(colorless)<br />
In the next exercise you will add DCPIP to a mitochondrial suspension made from lima beans<br />
(yes, plants carry out cellular respiration too!) and detect the citric acid cycle step illustrated<br />
above by the loss of blue color in DCPIP.
Exercise 2 – Detecting cellular respiration in a mitochondrial suspension<br />
1. Review the experiment below, write your hypothesis on your worksheet and identify the<br />
independent and dependent variables as well as the control.<br />
2. <strong>Lab</strong>el 3 test tubes and add the components indicated in the chart below, in order:<br />
Tube #1 Tube #2 Tube #3<br />
Phosphate Buffer Solution 4.0 ml 3.7 ml 3.4 ml<br />
DCPIP 0.5 ml 0.5 ml 0.5 ml<br />
Succinate Solution 0 ml 0.3 ml 0.6 ml<br />
Lima Bean Extract 0.5 ml 0.5 ml 0.5 ml<br />
TOTAL 5.0 ml 5.0 ml 5.0 ml<br />
3. Make sure each tube is mixed and score the color of each tube every 5 minutes for a total of 30<br />
minutes using the scale shown below:<br />
0 1 2 3 4 5<br />
4. Graph color score vs time for each tube and answer the associated questions.<br />
Part 3: DESIGNING AN EXPERIMENT<br />
Having investigated alcohol fermentation in yeast and cellular respiration in a mitochondrial<br />
suspension, you and your group will design and carry out a new experiment to expand on what<br />
you have already learned.<br />
Exercise 3 – Design an experiment<br />
1. Decide as a group to further investigate yeast fermentation or cellular respiration in lima bean<br />
mitochondrial suspension.<br />
2. Identify an independent variable you have not already investigated (e.g., amount of corn syrup or<br />
mitochondrial suspension) and come up with a hypothesis with regard to this variable. Write the<br />
hypothesis on your worksheet.<br />
3. Design an experiment to test this hypothesis. On your worksheet, briefly describe your<br />
experimental plan, and identify the independent variable, dependent variable and control.<br />
4. Carry out your experiment, record and graph the results on your worksheet, and write your<br />
conclusion.
<strong>Lab</strong>oratory 6 worksheet – Fermentation & <strong>Cellular</strong> <strong>Respiration</strong><br />
Name: ____________________________ Group: ________<br />
Exercise 1 – Yeast fermentation<br />
Date: _______________<br />
Start time: _________End Time: ________<br />
State your hypothesis below and identify the indicated components of this experiment:<br />
Hypothesis:<br />
Independent variable:<br />
Dependent variable:<br />
Control:<br />
Results:<br />
Tube 1<br />
Tube 2<br />
Tube 3<br />
0 min 5 min 10 min 15 min 20 min 25 min 30 min<br />
On the grid below, graph the results for each tube by plotting the amount of gas produced vs time.<br />
Did these results support your hypothesis? Explain.
Exercise 2 – <strong>Cellular</strong> respiration<br />
Start time: _________End Time: ________<br />
Indicate the roles of each of the following components in your experiment:<br />
Lima bean extract:<br />
DCPIP:<br />
Succinate:<br />
Buffer:<br />
State your hypothesis below and identify the indicated components of this experiment:<br />
Hypothesis:<br />
Independent variable:<br />
Dependent variable:<br />
Control:<br />
Results:<br />
Tube 1<br />
Tube 2<br />
Tube 3<br />
0 min 5 min 10 min 15 min 20 min 25 min 30 min<br />
On the grid below, graph the results for each tube by plotting the color score vs time.
Did these results support your hypothesis? Explain.<br />
Why was it important for this and the previous experiment to keep the total volume of each tube<br />
constant?<br />
Exercise 3 – Design an experiment<br />
Briefly describe or outline the design of your experiment below:<br />
State your hypothesis:<br />
Identify the indicated components of your experiment:<br />
Independent variable:<br />
Dependent variable:<br />
Control:<br />
Draw a chart or table and record the results of your experiment below:
Graph your results on the grid below:<br />
Did these results support your hypothesis? Explain.