Dependent spatial extremes
Dependent spatial extremes
Dependent spatial extremes

Create successful ePaper yourself
Turn your PDF publications into a flip-book with our unique Google optimized e-Paper software.
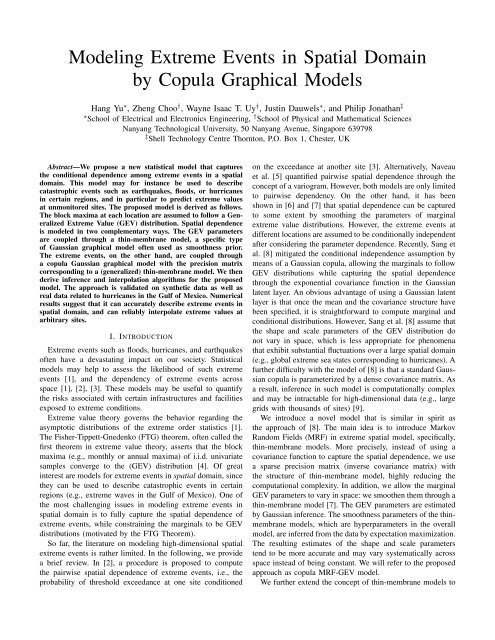
Modeling Extreme Events in Spatial Domain<br />
by Copula Graphical Models<br />
Hang Yu ∗ , Zheng Choo † , Wayne Isaac T. Uy † , Justin Dauwels ∗ , and Philip Jonathan ‡<br />
∗ School of Electrical and Electronics Engineering, † School of Physical and Mathematical Sciences<br />
Nanyang Technological University, 50 Nanyang Avenue, Singapore 639798<br />
‡ Shell Technology Centre Thornton, P.O. Box 1, Chester, UK<br />
Abstract—We propose a new statistical model that captures<br />
the conditional dependence among extreme events in a <strong>spatial</strong><br />
domain. This model may for instance be used to describe<br />
catastrophic events such as earthquakes, floods, or hurricanes<br />
in certain regions, and in particular to predict extreme values<br />
at unmonitored sites. The proposed model is derived as follows.<br />
The block maxima at each location are assumed to follow a Generalized<br />
Extreme Value (GEV) distribution. Spatial dependence<br />
is modeled in two complementary ways. The GEV parameters<br />
are coupled through a thin-membrane model, a specific type<br />
of Gaussian graphical model often used as smoothness prior.<br />
The extreme events, on the other hand, are coupled through<br />
a copula Gaussian graphical model with the precision matrix<br />
corresponding to a (generalized) thin-membrane model. We then<br />
derive inference and interpolation algorithms for the proposed<br />
model. The approach is validated on synthetic data as well as<br />
real data related to hurricanes in the Gulf of Mexico. Numerical<br />
results suggest that it can accurately describe extreme events in<br />
<strong>spatial</strong> domain, and can reliably interpolate extreme values at<br />
arbitrary sites.<br />
I. INTRODUCTION<br />
Extreme events such as floods, hurricanes, and earthquakes<br />
often have a devastating impact on our society. Statistical<br />
models may help to assess the likelihood of such extreme<br />
events [1], and the dependency of extreme events across<br />
space [1], [2], [3]. These models may be useful to quantify<br />
the risks associated with certain infrastructures and facilities<br />
exposed to extreme conditions.<br />
Extreme value theory governs the behavior regarding the<br />
asymptotic distributions of the extreme order statistics [1].<br />
The Fisher-Tippett-Gnedenko (FTG) theorem, often called the<br />
first theorem in extreme value theory, asserts that the block<br />
maxima (e.g., monthly or annual maxima) of i.i.d. univariate<br />
samples converge to the (GEV) distribution [4]. Of great<br />
interest are models for extreme events in <strong>spatial</strong> domain, since<br />
they can be used to describe catastrophic events in certain<br />
regions (e.g., extreme waves in the Gulf of Mexico). One of<br />
the most challenging issues in modeling extreme events in<br />
<strong>spatial</strong> domain is to fully capture the <strong>spatial</strong> dependence of<br />
extreme events, while constraining the marginals to be GEV<br />
distributions (motivated by the FTG Theorem).<br />
So far, the literature on modeling high-dimensional <strong>spatial</strong><br />
extreme events is rather limited. In the following, we provide<br />
a brief review. In [2], a procedure is proposed to compute<br />
the pairwise <strong>spatial</strong> dependence of extreme events, i.e., the<br />
probability of threshold exceedance at one site conditioned<br />
on the exceedance at another site [3]. Alternatively, Naveau<br />
et al. [5] quantified pairwise <strong>spatial</strong> dependence through the<br />
concept of a variogram. However, both models are only limited<br />
to pairwise dependency. On the other hand, it has been<br />
shown in [6] and [7] that <strong>spatial</strong> dependence can be captured<br />
to some extent by smoothing the parameters of marginal<br />
extreme value distributions. However, the extreme events at<br />
different locations are assumed to be conditionally independent<br />
after considering the parameter dependence. Recently, Sang et<br />
al. [8] mitigated the conditional independence assumption by<br />
means of a Gaussian copula, allowing the marginals to follow<br />
GEV distributions while capturing the <strong>spatial</strong> dependence<br />
through the exponential covariance function in the Gaussian<br />
latent layer. An obvious advantage of using a Gaussian latent<br />
layer is that once the mean and the covariance structure have<br />
been specified, it is straightforward to compute marginal and<br />
conditional distributions. However, Sang et al. [8] assume that<br />
the shape and scale parameters of the GEV distribution do<br />
not vary in space, which is less appropriate for phenomena<br />
that exhibit substantial fluctuations over a large <strong>spatial</strong> domain<br />
(e.g., global extreme sea states corresponding to hurricanes). A<br />
further difficulty with the model of [8] is that a standard Gaussian<br />
copula is parameterized by a dense covariance matrix. As<br />
a result, inference in such model is computationally complex<br />
and may be intractable for high-dimensional data (e.g., large<br />
grids with thousands of sites) [9].<br />
We introduce a novel model that is similar in spirit as<br />
the approach of [8]. The main idea is to introduce Markov<br />
Random Fields (MRF) in extreme <strong>spatial</strong> model, specifically,<br />
thin-membrane models. More precisely, instead of using a<br />
covariance function to capture the <strong>spatial</strong> dependence, we use<br />
a sparse precision matrix (inverse covariance matrix) with<br />
the structure of thin-membrane model, highly reducing the<br />
computational complexity. In addition, we allow the marginal<br />
GEV parameters to vary in space: we smoothen them through a<br />
thin-membrane model [7]. The GEV parameters are estimated<br />
by Gaussian inference. The smoothness parameters of the thinmembrane<br />
models, which are hyperparameters in the overall<br />
model, are inferred from the data by expectation maximization.<br />
The resulting estimates of the shape and scale parameters<br />
tend to be more accurate and may vary systematically across<br />
space instead of being constant. We will refer to the proposed<br />
approach as copula MRF-GEV model.<br />
We further extend the concept of thin-membrane models to
irregular grids through Delaunay triangulation [10], allowing<br />
us to handle the common situation where measurements are<br />
collected at random locations. We derive interpolation algorithms<br />
from the copula MRF-GEV model. The resulting interpolation<br />
schemes strongly resemble inverse distance weighted<br />
(IDW) interpolation [11], and are quite simple and efficient,<br />
due to the sparse thin-membrane structure.<br />
We apply the copula MRF-GEV model to synthetic data<br />
and real data, related to extreme wave heights in the Gulf of<br />
Mexico. We benchmark the proposed model with several other<br />
<strong>spatial</strong> models: MRF-GEV model [7] (with <strong>spatial</strong>ly dependent<br />
GEV parameters but conditionally independent extreme values),<br />
copula GEV model (with locally fitted GEV parameters<br />
but coupled extreme events), and a thin-membrane model,<br />
directly fitted to the data without using copulas. The numerical<br />
results clearly demonstrate that incorporating both extremevalue<br />
dependence and parameter dependence across space<br />
leads to more accurate inference. Moreover, by adjusting the<br />
smoothness of GEV parameters automatically, the estimated<br />
GEV parameters are able to capture different types of <strong>spatial</strong><br />
variations.<br />
The rest of the paper is organized as follows. In the next<br />
section, we briefly review thin-membrane models, since those<br />
models play a central role in our approach. In Section III<br />
we discuss the GEV marginals, and describe algorithms to<br />
infer the GEV parameters. In Section IV, we describe how<br />
we incorporate dependencies among the extreme events by<br />
means of a copula Gaussian graphical model. In Section V we<br />
explain how our proposed model can be used for interpolating<br />
extreme values at sites without observations. In Section VI<br />
we assess the proposed model and benchmark it with other<br />
<strong>spatial</strong> models by means of synthetic and real data. We offer<br />
concluding remarks in Section VII.<br />
II. THIN-MEMBRANE MODELS<br />
We use thin-membrane models to capture the <strong>spatial</strong> dependence<br />
of the GEV parameters and the extreme events. We first<br />
briefly review Gaussian graphical models, and subsequently,<br />
the special case of thin-membrane models. Next, we elaborate<br />
on generalized thin-membrane models.<br />
In Gaussian graphical models or Gauss-Markov random<br />
fields, a joint p-dimensional Gaussian probability distribution<br />
N(µ, Σ) is represented by an undirected graph G which<br />
consists of nodes V and edges E. Each node i is associated<br />
with a random variable X i . An edge (i, j) is absent if the<br />
corresponding two variables X i and X j are conditionally independent:<br />
P (X i , X j |X V|i,j ) = P (X i |X V|i,j )P (X j |X V|i,j ),<br />
where V|i, j denotes all the variables except X i and X j . It<br />
is well-known that for multivariate Gaussian distributions, the<br />
above property holds if and only if K i,j = 0, where K = Σ −1<br />
is the precision matrix (inverse covariance matrix).<br />
The thin-membrane model is a Gaussian graphical model<br />
that is commonly used as smoothness prior as it minimizes<br />
the difference between values at neighboring nodes. The thinmembrane<br />
model is usually defined for regular grids, as<br />
illustrated in Fig. 1(a), and its pdf can be written as:<br />
P (X) ∝ exp{−α ∑ ∑<br />
(X i − X j ) 2 } (1)<br />
i∈V<br />
j∈N (i)<br />
∝ exp(−α X T K p X), (2)<br />
where N (i) denotes the neighboring nodes of node i, and α<br />
is the smoothness parameter. The matrix K p is an adjacency<br />
matrix with its diagonal elements [K p ] i,i equal to the number<br />
of neighbors of site i, while its off-diagonal elements [K p ] i,j<br />
are −1 if the sites i and j are adjacent and 0 otherwise.<br />
Note that K = αK p is the precision matrix of P (X) (2).<br />
The parameter α controls the smoothness of the whole thinmembrane<br />
model, imposing the same extent of smoothness for<br />
all pairs of neighbors.<br />
Fig. 1.<br />
grid.<br />
(a)<br />
Generalized thin-membrane model: (a) Regular grid; (b) Irregular<br />
Thin-membrane models can be extended to irregular grids,<br />
as illustrated in Fig. 1(b). The adjacency structure may be<br />
generated automatically by Delaunay triangulation, cf. [10],<br />
which maximizes the minimum angle for all the triangles in<br />
the grid. In this case, N (i) denotes all the nodes that have<br />
direct connection with node i. As a natural extension of (2), the<br />
non-zero entries in K p may be defined as [K p ] i,j = −1/d 2 i,j ,<br />
where d i,j is the distance between node i and j. The diagonal<br />
elements in the adjacency matrix are given by [K p ] i,i =<br />
− ∑ p<br />
j=1,j≠i [K p] i,j . We refer to this model as the irregular<br />
thin-membrane model. Note that the regular thin-membrane<br />
model is a special case of the irregular thin-membrane model,<br />
where all the nodes are located on a regular grid, and all<br />
distances d i,j are identical.<br />
As pointed out in [9], for some applications the off-diagonal<br />
entries [K p ] i,j are not necessarily related to the distance d i,j<br />
between node i and node j. More generally, the entries of the<br />
precision matrix K may be inferred from the data, without<br />
specifying any dependence on the distance d i,j . However, the<br />
sparsity pattern of K is fixed, as it is specified by the (regular<br />
or irregular) grid, i.e., K i,j ≠ 0 iff edge (i, j) is present. In<br />
generalized thin-membrane models, the non-zero entries of K<br />
are learned from data, for a fixed sparsity pattern determined<br />
by the grid (cf. Fig. 1).<br />
III. GEV MARGINALS<br />
In this section, we describe how we infer the GEV marginal<br />
distributions at each site. Suppose that we have n samples<br />
x (j)<br />
i (block maxima) at each of the p locations, where i =<br />
(b)
1, · · · , p and j = 1, · · · , n. Our objective is to infer the three<br />
GEV parameters with the consideration of <strong>spatial</strong> dependence.<br />
Specifically, we first fit the GEV distribution to block maxima<br />
at each location using the Probability-Weighted Moment<br />
(PWM) method [13]. Those GEV parameter estimates are<br />
then smoothed by means of thin-membrane model priors [7],<br />
both for regular and irregular grids. At last, the smoothness<br />
parameter α for the whole grid is inferred from the data by<br />
expectation maximization (EM).<br />
A. Local Estimates of GEV Parameters<br />
We assume that the block maxima x (j)<br />
i at each location<br />
follow a Generalized Extreme Value (GEV) distribution [4]:<br />
⎧<br />
⎪⎨ exp{−[1 + γ i<br />
(x i − µ i )] − 1 γ i }, γ i ≠ 0<br />
σ<br />
F (x i ) =<br />
i<br />
⎪⎩ exp{− exp[− 1 (x i − µ i )]}, γ i = 0,<br />
σ i<br />
for 1 + γ i /σ i (x i − µ i ) ≥ 0 if γ i ≠ 0 and x i ∈ R if γ i = 0,<br />
where µ i ∈ R is the location parameter, σ i > 0 is the scale<br />
parameter and γ i ∈ R is the shape parameter.<br />
We estimate the parameters µ i , σ i , and γ i locally<br />
at each site i by the Probability-Weighted Moment<br />
(PWM) method [13], which aims to match the moments<br />
E[X t i (F (X i)) r (1 − F (X i )) s ] with the empirical ones, where<br />
t, r and s are real numbers. For the GEV distribution,<br />
E[X i (F (X i )) r ] (with t = 1 and s = 0) can be written as:<br />
(3)<br />
b r = 1<br />
r + 1 {µ i − σ i<br />
γ i<br />
[1 + (r − 1) γi Γ(1 − γ i )]}, (4)<br />
where γ i < 1 and γ i ≠ 0, and Γ(· ) is the gamma function.<br />
The resulting PWM estimates ( ˆµ PWM i ), ( ˆσ PWM i ) and ( ˆγ PWM i )<br />
are the solution of the following system of equations:<br />
⎧<br />
b 0 = µ i − σ i<br />
(1 − Γ(1 − γ i ))<br />
γ i<br />
⎪⎨<br />
2b 1 − b 0 = σ i<br />
Γ(1 − γ i )(2 γi − 1)<br />
γ<br />
(5)<br />
i<br />
⎪⎩<br />
3b 2 − b 0 − 1<br />
= 3γi<br />
2b 1 − b 0 2 γi − 1 .<br />
B. Spatial-<strong>Dependent</strong> Estimates of GEV Parameters<br />
We assume that each of the three parameter vectors µ =<br />
(µ 1 , · · · , µ p ), γ = (γ 1 , · · · , γ p ) and σ = (σ 1 , · · · , σ p ) has a<br />
thin-membrane model as prior, where p is the number of sites.<br />
Since the thin-membrane models of µ, γ, and σ share the same<br />
structure and inference methods, we present the three models<br />
in a unified form.<br />
Let y = (y 1 , y 2 , . . . , y p ) denote the local estimates of<br />
z = (z 1 , z 2 , . . . , z p ), where y is either (ˆµ PWM ), (ˆσ PWM ), or<br />
(ˆγ PWM ) and z is either µ, σ, or γ after considering <strong>spatial</strong><br />
dependence. We model the local estimates as y = z + b,<br />
where b ∼ N(0, R z ) is zero-mean Gaussian random vector<br />
with diagonal covariance matrix R z .<br />
As a result of this Gaussian approximation, the conditional<br />
distribution of the observed value y given the true value z is<br />
a Gaussian distribution:<br />
P (y|z) ∝ exp{− 1 2 (y − z)T R −1<br />
z (y − z)}. (6)<br />
Since we assume that the prior distribution of z is a thinmembrane<br />
model (cf. (2)), the posterior distribution is given<br />
by:<br />
P (z|y) ∝ exp(−α z z T K p z) exp{− 1 2 (y − z)T Rz<br />
−1 (y − z)}<br />
∝ exp{− 1 2 zT (α z K p + Rz<br />
−1 )z + z T Rz −1 y}. (7)<br />
The maximum a posteriori estimate of z is given by:<br />
ẑ = argmax P (z|y) = (α z K p + Rz<br />
−1 ) −1 Rz −1 y. (8)<br />
The noise covariance R z can be estimated by the bootstrap<br />
approach described in [7], [14].<br />
We infer the parameter α z by expectation maximization. In<br />
the E-step, we compute [15]:<br />
Q(α z , ˆα (k−1)<br />
z<br />
) = E (k−1)<br />
Z|y,ˆα<br />
[log P (y, Z|α z )] (9)<br />
z<br />
= − 1 2 α z{trace[K p (ˆα z<br />
(k−1) K p + Rz −1 ) −1 ]<br />
+ (ẑ (k−1) ) T K p ẑ (k−1) } + 1 2 log det(α zK p ),<br />
where ẑ (k) is computed as in (8), and α z is replaced by<br />
ˆα z<br />
(k) . Note that ẑ (k) is the MAP estimate of z conditioned on<br />
ˆα z<br />
(k) and y. Since the posterior distribution in z is Gaussian,<br />
the MAP estimate ẑ (k) is also the mean of the (Gaussian)<br />
posterior of z. In the M-step, we select the value ˆα z<br />
(k) of α z<br />
that maximizes Q(α z , ˆα z<br />
(k−1) ). A closed form expression of<br />
ˆα z<br />
(k) exists, cf. [15], and is given by:<br />
ˆα z (k)<br />
p<br />
=<br />
trace[K p (ˆα z<br />
(k−1) K p + Rz −1 ) −1 ] + (ẑ (k−1) ) T K p ẑ ,<br />
(k−1) (10)<br />
where p is the number of sites. We iterate the E-step and<br />
M-step until convergence, yielding a local extremum of the<br />
marginal posterior of α z .<br />
IV. COPULA GAUSSIAN GRAPHICAL MODEL<br />
We capture the <strong>spatial</strong> dependence between the extreme<br />
values (block maxima) x (j)<br />
i at the each of the p locations by<br />
means of a copula Gaussian graphical. Also for this purpose,<br />
we use a thin-membrane model. The smoothness parameter<br />
α i,j now varies for each pair of neighbors in the grid (both<br />
regular and irregular), adding extra flexibility to the model.<br />
The sparsity structure K p of K is fixed, as it corresponds<br />
to a thin-membrane model. The non-zero elements of K are<br />
inferred from data.<br />
In the following, we denote the observed GEV variables<br />
and hidden Gaussian variables as X 1 , . . . , X P and Z 1 , . . . ,<br />
Z P respectively. A copula Gaussian graphical model is defined<br />
as [16]:<br />
Z ∼ N (0, K −1 ) (11)<br />
X i = F −1<br />
i (Φ(Z i )), (12)
where K is the precision matrix whose inverse K −1 (covariance<br />
matrix) has normalized diagonal, Φ is the cdf of the<br />
standard Gaussian distribution, and F i is the marginal GEV<br />
cdf of Y i with corresponding parameters µ i , γ i and σ i . Note<br />
that F −1<br />
i is the pseudo-inverse of F k , which is defined as:<br />
F −1 (x) = inf {F (y) ≥ x}. (13)<br />
y∈Y<br />
where y takes values in Y.<br />
According to definition [16], a copula Gaussian graphical<br />
model is determined by the marginals F i and the precision<br />
matrix K. The marginals F i are GEV distributions, as described<br />
in Section III. The <strong>spatial</strong> dependence among the GEV<br />
marginals F i is captured by coupling the GEV parameters<br />
through thin-membrane models (cf. Section III).<br />
In the following, we describe how we infer the precision<br />
matrix K. As a first step, we transform the non-Gaussian<br />
observed variables X into Gaussian distributed latent variables<br />
Z:<br />
Z i = Φ −1 (F i (X i )). (14)<br />
In the second step, for given thin-membrane sparsity structure<br />
K p , the precision matrix K is estimated from the latent<br />
Gaussian variables Z [17]:<br />
ˆK = argmax log det K − trace(SK), (15)<br />
K≻0<br />
s.t. K i,j = 0 ∀(i, j) ∉ K p ,<br />
where S is the empirical covariance of latent variables Z. The<br />
convex optimization problem (15) can be solved efficiently<br />
by the Newton-CG primal proximal point algorithm [17] or<br />
iterative proportional fitting [18].<br />
V. INTERPOLATION<br />
Here we explain how extreme values can be inferred at any<br />
location P 0 in space, including sites without observations. We<br />
assume that the surface of the extreme values is smooth across<br />
space. Since both <strong>spatial</strong>-dependent GEV parameters µ, γ, σ<br />
and the latent variables Z in (11) share a (generalized) thinmembrane<br />
structure, we will first formulate the interpolation<br />
problem in a unified form, and then describe the minor<br />
differences.<br />
Let x represent the parameter vectors µ, γ, σ, or hidden<br />
variables Z, associated to the sites with measurements, and<br />
let x 0 denote the interpolated value at site P 0 (without measurements).<br />
The random variables x and x 0 are assumed to<br />
form a thin-membrane model with joint precision matrix:<br />
( )<br />
Kx0 K<br />
K 0 =<br />
x0,x<br />
. (16)<br />
K x,x0 K x<br />
The conditional expected value of x 0 therefore equals:<br />
E[x 0 |x] = −K −1<br />
x 0<br />
K x0,x ˆx, (17)<br />
where ˆx is the expected value of x.<br />
Since we consider thin-membrane models, x 0 is conditionally<br />
dependent on its neighbors only. For a standard thinmembrane<br />
model (on regular or irregular grid) as illustrated<br />
Fig. 2.<br />
x1<br />
x2<br />
d 4<br />
, 4<br />
x 4<br />
4<br />
1<br />
d 1<br />
, 1<br />
d 0<br />
, 0<br />
d 3<br />
, 3<br />
x 0<br />
x<br />
d 2<br />
, 2<br />
Illustration of the modified interpolation method<br />
in Fig. 2, the expected value (17) can be simplified as:<br />
E[x 0 |x] = K x 0,x 1<br />
x 1 + K x0,x 2<br />
x 2 + K x0,x 3<br />
x 3 + K x0,x 4<br />
x 4<br />
K x0,x 1<br />
+ K x0,x 2<br />
+ K x0,x 3<br />
+ K x0,x 4<br />
.<br />
x 3<br />
(18)<br />
Clearly, due to the sparse precision matrix corresponding to<br />
a thin-membrane model, the expression (18) is quite simple.<br />
It is natural to choose K x0,x j<br />
= −α/d 2 0,j in standard thinmembrane<br />
models (both on regular and irregular grids. Consequently,<br />
the weighted average (18) boils down to inverse<br />
distance weighted (IDW) interpolation [11]. We use IDW to<br />
interpolate the GEV parameters.<br />
For the latent Gaussian variables Z, however, the thinmembrane<br />
precision matrix is not a function of distance. On<br />
the other hand, for interpolation purposes, we need to consider<br />
the distance from sites with observations, and potentially also<br />
other parameters. Here we propose a modified inverse distance<br />
weighted (MIDW) interpolation method, where K x0,x j<br />
is not<br />
only a function of distance but of direction as well. We assume<br />
that K x0,x j<br />
changes linearly with direction when the distance<br />
remains unchanged and is proportional to the inverse square<br />
distance when the direction remains unchanged. As illustrated<br />
in Fig. 2, K x0,x 1<br />
for instance can be computed as:<br />
α x0,x 1<br />
= 1 )<br />
π<br />
(α 1 θ 4 + α 4 θ 1 , (19)<br />
2<br />
K x0,x 1<br />
= − α x 0,x 1<br />
d 2 x 0,x 1<br />
. (20)<br />
After interpolating the parameters µ 0 , γ 0 , σ 0 , and hidden<br />
variable Z 0 for site P 0 , we obtain the GEV distributed value<br />
of site P 0 through (12).<br />
VI. NUMERICAL RESULTS<br />
In this section, we benchmark the proposed copula MRF-<br />
GEV model against the MRF-GEV model (without modeling<br />
the extreme value dependence) [7], copula GEV (without modeling<br />
the GEV parameter dependence), and thin-membrane<br />
model directly fitted to the data according to (15) (where S<br />
is the empirical covariance matrix of the observations), both<br />
on synthetic and real data sets. We compare all four models
y means of three criteria: the mean square error between<br />
the interpolated extreme value and the true value, the KLdivergence,<br />
and the number of parameters.<br />
For synthetic data, we also compute the mean square error<br />
(MSE) for inferring the GEV parameters. Specifically, we<br />
report the MSE for (i) local PWM estimates; (ii) <strong>spatial</strong>dependent<br />
estimates from copula MRF-GEV model; (iii) IDW<br />
interpolation from copula MRF-GEV model at unobserved<br />
sites.<br />
A. Synthetic Data<br />
We generate <strong>spatial</strong>ly dependent GEV distributed synthetic<br />
data as follows:<br />
1) We generate the coordinates of the 256 observed and<br />
400 unobserved sites. We consider two cases: First, the<br />
observed sites are arranged in a regular grid (e.g., wave<br />
height measuring stations in the Gulf of Mexico [19])<br />
while unobserved sites are randomly distributed across<br />
the grid. Second, both observed and unobserved sites are<br />
randomly distributed in the same <strong>spatial</strong> domain (e.g.,<br />
precipitation measuring stations in South Africa [8]).<br />
2) We generate 315 samples from a zero-mean multivariate<br />
Gaussian distribution, both at observed and unobserved<br />
sites. The covariance matrix of that distribution is defined<br />
as Σ i,j = exp(−d 2 i,j /φ), where φ is the range<br />
parameter.<br />
3) We select GEV parameters for each site. All GEV<br />
parameters vary smoothly across space. For both case<br />
studies, the location parameter surface is a quadratic<br />
Legendre polynomial, as shown in Fig. 3(a). The other<br />
parameters are chosen differently in each case, as we<br />
will explain later.<br />
4) We transform the Gaussian samples generated in Step 2<br />
to GEV distributed samples with the GEV parameters<br />
chosen in Step 3 using (12).<br />
location parameter µ<br />
30<br />
20<br />
10<br />
0<br />
-10<br />
0<br />
5<br />
10<br />
longitude<br />
15<br />
20 0<br />
(a)<br />
5<br />
10<br />
latitude<br />
15<br />
20<br />
scale parameter σ<br />
8<br />
6<br />
4<br />
2<br />
0<br />
20<br />
15<br />
10<br />
latitude<br />
5<br />
0<br />
0<br />
(b)<br />
5<br />
10<br />
15<br />
longitude<br />
Fig. 3. True GEV parameters for synthetic data: (a) Location parameter<br />
surface; (b) Scale parameter surface.<br />
1) Case Study 1: The observed sites are located on a 16x16<br />
grid, whereas the observed sites are randomly distributed, as<br />
shown in Fig. 4. The shape and scale parameters γ and σ are<br />
chosen to be constant, and are equal to 0.4 and 2 respectively.<br />
The results for GEV parameter estimation are summarized in<br />
Table I. As mentioned earlier, we report the MSE for (i) local<br />
PWM estimates; (ii) <strong>spatial</strong>-dependent estimates from copula<br />
20<br />
latitude<br />
16<br />
14<br />
12<br />
10<br />
8<br />
6<br />
4<br />
2<br />
observed sites<br />
2 4 6 8 10 12 14 16<br />
longitude<br />
unobserved sites<br />
Fig. 4. Coordinates of observed and unobserved sites for Case Study 1.<br />
MRF-GEV model; (iii) IDW interpolation from copula MRF-<br />
GEV model at unobserved sites. The GEV estimates by the<br />
TABLE I<br />
MEAN SQUARE ESTIMATION ERROR FOR GEV PARAMETERS IN CASE<br />
STUDY 1<br />
GEV parameter PWM copula MRF-GEV IDW interpolation<br />
shape parameter γ 0.0013 9.0334 × 10 −4 9.0334 × 10 −4<br />
scale parameter σ 0.0093 0.0084 0.0084<br />
location parameter µ 0.0114 0.0113 0.0260<br />
copula MRF-GP model are more accurate than the local PWM<br />
estimates, although the difference is minor. The PWM method<br />
often results in accurate estimates of GEV parameters [13].<br />
The corresponding smoothness parameter α µ = 0.3370 while<br />
α γ and α σ converge to infinity. As a consequence, the shape<br />
and scale parameter do not depend on location, in agreement<br />
with the true parameter values. As can also be seen from<br />
Table I, IDW parameter interpolation, based on estimates from<br />
the copula MRF-GP model, generates accurate estimates of the<br />
GEV parameters at unobserved sites.<br />
TABLE II<br />
COMPARISON FOR CASE STUDY 1<br />
Models MSE KL-divergence No. of Parameters<br />
copula MRF-GEV 0.0497 301.8436 738<br />
MRF-GEV 81.0440 646.8706 258<br />
copula GEV 116.0777 302.3067 1248<br />
Gaussian 0.7025 804.4967 736<br />
Table II summarizes the performance of the four methods<br />
for inferring extreme values. The proposed copula MRF-GEV<br />
model has the smallest MSE and KL divergence. Both MRF-<br />
GEV and copula GEV fail to describe the <strong>spatial</strong> extreme<br />
values suitably, since they only capture one of the two types<br />
of <strong>spatial</strong> dependence, motivating our approach to model the<br />
<strong>spatial</strong> dependence both for the parameter and extreme values.
Interestingly, the Gaussian model has the second best performance<br />
in terms of MSE, probably due to the smooth nature<br />
of the extreme value surface. However the KL divergence for<br />
the Gaussian model is large compared to the other models,<br />
since Gaussian models are not capable of capturing extreme<br />
events; such models mostly describe fluctuations around the<br />
mean value. Compared with the copula GEV model, the copula<br />
MRF-GEV model achieves a smaller KL divergence with<br />
fewer parameters, suggesting that it is beneficial to model the<br />
<strong>spatial</strong> dependence of the GEV parameters.<br />
We further set the scale parameter surface to be quadratic<br />
instead of constant, as shown in Fig. 3(b). The results are<br />
qualitatively similar. The only difference is that α σ is now<br />
finite (4.9831), implying that the estimates of σ are no longer<br />
independent of location. This is not surprising since the true<br />
parameter σ follows a quadratic surface. In other words, by<br />
inferring smoothness parameters, the smoothness of the GEV<br />
parameters can be automatically and suitably adjusted.<br />
2) Case Study 2: In the second scenario, both the observed<br />
and unobserved sites are randomly distributed in space, as<br />
shown in Fig. 5. The adjacency structure of the corresponding<br />
irregular thin-membrane model is generated automatically<br />
using Delaunay triangulation [10], indicated by the blue lines<br />
in the figure.<br />
latitude<br />
16<br />
14<br />
12<br />
10<br />
8<br />
observed sites<br />
unobserved sites<br />
TABLE III<br />
MEAN SQUARE ESTIMATION ERROR FOR GEV PARAMETERS IN CASE<br />
STUDY 2<br />
GEV parameter PWM copula MRF-GEV IDW interpolation<br />
shape parameter γ 2.8527 × 10 −4 9.9447 × 10 −5 9.9447 × 10 −5<br />
scale parameter σ 0.0126 0.0126 0.0084<br />
location parameter µ 0.0157 0.0155 0.0650<br />
TABLE IV<br />
COMPARISON FOR CASE STUDY 2<br />
Models MSE KL-divergence No. of Parameters<br />
copula MRF-GEV 0.1869 150.7595 1009<br />
MRF-GEV 95.0509 652.2792 258<br />
copula GEV 99.1437 151.0429 1519<br />
Gaussian 0.2283 690.6725 1007<br />
which suggests that the method is also suitable for irregular<br />
grids.<br />
Comparing the results with Case Study 1, we notice that by<br />
introducing more parameters, the KL-divergence between the<br />
copula MRF-GEV model and the data is reduced. Meanwhile,<br />
due to the random location of the observed sites, there is a<br />
lack of information in some areas compared to the regular<br />
grid, resulting in a larger mean square error of interpolation.<br />
Next, as in the first scenario, we set the scale parameter<br />
surface to be a quadratic Legendre polynomial as shown in<br />
Fig. 3(b). Consistent with the true model, the resulting α σ is<br />
finite (2.8716).<br />
B. Real Data<br />
In this section, we consider the GOMOS (Gulf of Mexico<br />
Oceanographic Study) data [19], which consists of 315 maximum<br />
peak wave height values; each corresponds to a hurricane<br />
event in the Gulf of Mexico. The distance between each pair<br />
of neighbors is 0.125 ◦ (approximately 14km).<br />
6<br />
14<br />
15<br />
4<br />
2<br />
2 4 6 8 10 12 14 16<br />
longitude<br />
Fig. 5. Coordinates of observed and unobserved sites for Case Study 2.<br />
As in the first scenario, we first set the shape and scale<br />
parameters γ and σ to be constant, and equal to 0.4 and 2<br />
respectively. The results of parameter estimation are presented<br />
in Table III. The proposed copula MRF-GP model yields<br />
smaller estimation error than the PWM local estimates. The<br />
smoothness parameters α γ and α σ converge to infinity while<br />
α µ is finite (0.2188), in agreement with the true underlying<br />
model.<br />
Table IV summarizes the comparison of the four models. It<br />
can be seen that the proposed copula MRF-GEV outperforms<br />
the other methods both in terms of MSE and KL divergence,<br />
significant waveheight at site 34<br />
12<br />
10<br />
8<br />
6<br />
4<br />
2<br />
0<br />
0 2 4 6 8 10 12 14<br />
significant waveheight at site 33<br />
(a)<br />
significant waveheight at site 78<br />
10<br />
5<br />
0<br />
0 2 4 6 8 10 12<br />
significant waveheight at site 1<br />
Fig. 6. Scatter plots of wave height at pairs of sites: (a) two distant sites;<br />
(b) two nearby sites.<br />
As can be seen from Fig. 6, strong <strong>spatial</strong> dependence exists<br />
between two nearby sites, and even between sites that are far<br />
apart. Fig. 7 shows that the maximum peak wave heights vary<br />
smoothly over space.<br />
First we analyze a 31x31 lattice in a central region of<br />
the Gulf of Mexico (see Fig. 8(b)). The nodes of a 16x16<br />
regular sublattice are chosen as locations with observations<br />
(b)
2.2<br />
30<br />
2.2<br />
5<br />
2<br />
25<br />
5<br />
2<br />
10<br />
1.8<br />
20<br />
10<br />
1.8<br />
15<br />
15<br />
1.6<br />
15<br />
1.6<br />
20<br />
20<br />
25<br />
1.4<br />
10<br />
25<br />
1.4<br />
30<br />
1.2<br />
5<br />
30<br />
1.2<br />
5 10 15 20 25 30<br />
(a)<br />
5 10 15 20 25 30<br />
(b)<br />
5 10 15 20 25 30<br />
(c)<br />
14<br />
2.2<br />
2.2<br />
5<br />
12<br />
5<br />
2<br />
5<br />
2<br />
10<br />
15<br />
20<br />
10<br />
8<br />
6<br />
10<br />
15<br />
20<br />
1.8<br />
1.6<br />
1.4<br />
1.2<br />
10<br />
15<br />
20<br />
1.8<br />
1.6<br />
25<br />
4<br />
25<br />
1<br />
25<br />
1.4<br />
30<br />
5 10 15 20 25 30<br />
2<br />
0<br />
30<br />
5 10 15 20 25 30<br />
0.8<br />
30<br />
5 10 15 20 25 30<br />
1.2<br />
(d)<br />
(e)<br />
(f)<br />
Fig. 8. Interpolation of the maximum wave heights caused by a storm (small regular subgrid). (a) True graph; (b) Observed sites (black) and unobserved<br />
sites (red) on the grid; Interpolation by (c) the copula MRF-GEV model; (d) MRF-GEV model; (e) copula GEV model; (f) Gaussian model.<br />
waveheight<br />
6<br />
5<br />
4<br />
3<br />
2<br />
1<br />
0<br />
20<br />
15<br />
10<br />
latitude<br />
5<br />
0<br />
0<br />
5<br />
10<br />
longitude<br />
Fig. 7. The maximum wave height corresponding to one storm for 256 sites<br />
located on 16x16 lattice.<br />
(indicated by black circles in the figure), while the other nodes<br />
in the 31x31 lattice are treated as sites without observations.<br />
The interpolation results for one storm event are shown in<br />
Fig. 8. The figure suggests that the copula MRF-GEV model<br />
outperforms the other 3 models in terms of interpolation<br />
accuracy. Results for all 315 storms are summarized in Table<br />
V, listing the interpolation mean square error (MSE), KL<br />
divergence, and number of parameters for each model. The<br />
proposed copula MRF-GEV model achieves the smallest KL<br />
divergence and MSE with only relatively few parameters. The<br />
resulting smoothness parameters α γ = ∞, α σ = 127.1875 and<br />
α µ = 78.5047. The parameter γ is constant, whereas both σ<br />
and µ fluctuate across space.<br />
Now we consider the irregular grid with all 4363 measuring<br />
15<br />
20<br />
TABLE V<br />
COMPARISON FOR REGULAR GRID IN THE GULF OF MEXICO<br />
Models MSE KL-divergence No. of Parameters<br />
copula MRF-GEV 0.0011 238.3892 993<br />
MRF-GEV 17.0022 513.9034 258<br />
copula GEV 1.3863 240.3537 1248<br />
Gaussian 0.0023 506.9120 736<br />
sites in the Gulf of Mexico. We randomly select 1000 sites as<br />
the locations with measurements, while the remaining sites are<br />
regarded as locations without measurements. Fig. 9 shows the<br />
interpolation by all four methods, for one storm.<br />
Again, the copula MRF-GEV model seems to yield the<br />
lowest interpolation error. The Gaussian model also performs<br />
well but its contour plot fluctuates more than the copula MRF-<br />
GEV model, suggesting that the estimates are less reliable.<br />
On the other hand, the other two methods cannot correctly<br />
interpolate the values for the unobserved sites, since they fail<br />
to capture the <strong>spatial</strong> dependencies among the GEV parameters<br />
and the wave heights at different locations.<br />
TABLE VI<br />
COMPARISON FOR IRREGULAR GRID IN THE GULF OF MEXICO<br />
Models MSE KL-divergence No. of Parameters<br />
copula MRF-GEV 0.0130 524.4927 5944<br />
MRF-GEV 7.6933 1.7159 × 10 3 3000<br />
copula GEV 1.6094 529.2659 5944<br />
Gaussian 0.0254 791.1372 3944<br />
Table VI shows quantitative results of all four models, com-
20 40 60 80 100 120<br />
6<br />
45<br />
6<br />
5<br />
10<br />
15<br />
5.5<br />
5<br />
4.5<br />
4<br />
40<br />
35<br />
30<br />
5<br />
10<br />
15<br />
5.5<br />
5<br />
4.5<br />
4<br />
20<br />
3.5<br />
25<br />
20<br />
3.5<br />
25<br />
3<br />
20<br />
25<br />
3<br />
30<br />
35<br />
40<br />
2.5<br />
2<br />
1.5<br />
1<br />
15<br />
10<br />
5<br />
30<br />
35<br />
40<br />
2.5<br />
2<br />
1.5<br />
1<br />
45<br />
0.5<br />
20 40 60 80 100 120<br />
45<br />
20 40 60 80 100 120<br />
0.5<br />
(a)<br />
(b)<br />
(c)<br />
30<br />
8<br />
6<br />
5<br />
5<br />
7<br />
5<br />
5.5<br />
10<br />
25<br />
10<br />
6<br />
10<br />
5<br />
15<br />
20<br />
25<br />
20<br />
15<br />
15<br />
20<br />
25<br />
5<br />
4<br />
3<br />
15<br />
20<br />
25<br />
4.5<br />
4<br />
3.5<br />
3<br />
30<br />
10<br />
30<br />
2<br />
30<br />
2.5<br />
35<br />
40<br />
45<br />
20 40 60 80 100 120<br />
5<br />
0<br />
35<br />
40<br />
45<br />
20 40 60 80 100 120<br />
1<br />
0<br />
-1<br />
35<br />
40<br />
45<br />
20 40 60 80 100 120<br />
2<br />
1.5<br />
1<br />
0.5<br />
(d)<br />
(e)<br />
(f)<br />
Fig. 9. Interpolation of the maximum wave heights caused by a storm (irregular grid covering the Gulf of Mexico). (a) True graph; (b) Observed sites (black)<br />
and unobserved sites (red) on the grid; Interpolation by (c) the copula MRF-GEV model; (d) MRF-GEV model; (e) copula GEV model; (f) Gaussian model.<br />
puted from all hurricane events. The corresponding smoothness<br />
parameters for the copula MRF-GEV model are α γ =<br />
4.8860 × 10 3 , α σ = 148.0747 and α µ = 83.9102. None<br />
of the smoothness parameters converge to infinity, suggesting<br />
significant <strong>spatial</strong> variations in the GEV parameters across the<br />
Gulf of Mexico.<br />
VII. CONCLUSIONS<br />
In this study, we have presented a new model for quantifying<br />
dependencies among <strong>spatial</strong> extreme events. The dependency<br />
of the extreme events across space is modeled through a<br />
thin-membrane Gaussian copula. Also the parameters of the<br />
GEV marginals are coupled in space through thin-membrane<br />
models.<br />
Numerical results show that the proposed model not only<br />
provides accurate estimates and predictions, it is also computationally<br />
efficient and practical for both regular and irregular<br />
grids, even for large regions such as the entire Gulf of Mexico.<br />
The present model has several limitations. The monoscale<br />
thin-membrane model cannot capture the long-range dependencies<br />
effectively in a large <strong>spatial</strong> domain. In future work,<br />
we will attempt to utilize multiscale models instead. In addition,<br />
the model does not consider other covariate effects (e.g.,<br />
direction, season) and this will be further explored in detail.<br />
REFERENCES<br />
[1] P. Embrechts, C. Klüppelberg, and T. Mikosch, Modelling extremal events<br />
for insurance and finance, Berlin: Spring Verlag, 1997.<br />
[2] J. E. Heffernan and J. A. Tawn, “A conditional approach for multivariate<br />
extreme value”, J.R. Statist. Soc. B 66, pp.1–34, 2004.<br />
[3] C. Keef, C. Svensson, and J. A. Tawn, “Spatial dependence in extreme<br />
river flows and precipitation for Great Britain,” Journal of Hydrology,<br />
vol. 378, pp. 240–252, 2009.<br />
[4] S. G. Coles, An Introduction to Statistical Modeling of Extreme Values,<br />
Springer, London, 2001.<br />
[5] P. Naveau, A. Guillou, D. Cooley, and J. Diebolt, “Modelling pairwise<br />
dependence of maxima in space,” Biometrika, vol. 96(1), pp. 1-17, 2009.<br />
[6] P. J. Northrop and P. Jonathan, “Threshold modelling of <strong>spatial</strong>ly dependent<br />
non-stationary <strong>extremes</strong> with application to hurricane-induced wave<br />
heights,” Environmetrics, vol. 22, pp. 799–809, 2011.<br />
[7] H. Yu, Z. Choo, J. Dauwels, P. Jonathan, and Q. Zhou, “Modeling Spatial<br />
Extreme Events using Markov Random Field Priors,” submitted to ISIT<br />
2012.<br />
[8] H. Sang and A. E. Gelfand, “Continuous Spatial Process Models for<br />
Extreme Values”, Journal of Agricultural, Biological and Environmental<br />
Statistics, 15 ,49-65, 2010.<br />
[9] F. Lindgren and H. Rue, “An explicit link between Gaussian fields<br />
and Gaussian Markov random fields: the stochastic partial differential<br />
equation approach,” J.R. Statist. Soc., ser. B, vol. 73, pp. 423-498, 2011.<br />
[10] Ø. Hjelle and M. Dæhlen, Triangulations and Applications, Berlin:<br />
Springer, 2006.<br />
[11] L. Mitas and H. Mitasova, “Spatial interpolation,” In: Longley, P., Goodchild,<br />
M., Maguire, D., Rhind, D., (Eds.), Geographical Information<br />
Systems: Principles, Techniques, Management and Applications, vol. 1,<br />
pp. 481-492, 1999.<br />
[12] E. Casson and S. Coles, “Spatial regression models for <strong>extremes</strong>,”<br />
Extremes vol. 1 pp. 449C468, 1999.<br />
[13] J.R.M. Hosking, J. R. Wallis and E. F. Wood, ”Estimation of the<br />
generalized extreme-value distribution by the method of probabilityweighted<br />
moments”, Technometrics, vol. 27, pp. 251-261, 1985.<br />
[14] P. Jonathan and K. Ewans, “Uncertainties in extreme wave height<br />
estimates for hurricane-dominated regions,” Journal of offshore mechanics<br />
and arctic engineering, vol. 129(4), pp. 300-305, 2007.<br />
[15] M. J. Choi, V. Chandrasekaran, D. M. Malioutov, J. K. Johnson, and<br />
A. S. Willsky, “Multiscale stochastic modeling for tractable inference<br />
and data assimilation”, Comput. Methods Appl. Mech. Engrg. Vol. 197,<br />
pp. 3492-3515, 2008.<br />
[16] A. Dobra and A. Lenkoski, “Copula Gaussian graphical models and<br />
their application to modeling functional disability data,” Annals of Applied<br />
Statistics, vol. 5, No. 2A, pp. 969-993, 2011.<br />
[17] C. Wang, D. Sun, and K. C. Toh, “Solving log-determinant optimization<br />
problems by a Newton-CG primal proximal point algorithm,” Society for<br />
Industrial and Applied Mathematics, vol. 20, pp. 2994-3013, 2009.<br />
[18] P. F. Xu, J. Guo, and X. He, “An Improved Iterative Proportional Scaling<br />
Procedure for Gaussian Graphical Model,” Journal of Computational and<br />
Graphical Statistics, vol. 20, pp. 417-431, 2011.<br />
[19] Oceanweather Inc. GOMOS - USA Gulf of Mexico Oceanographic Study,<br />
Northen Gulf of Mexico Archive, 2005.