Agreement DE-FC26-02NT15342, Seismic Evaluation of ...
Agreement DE-FC26-02NT15342, Seismic Evaluation of ...
Agreement DE-FC26-02NT15342, Seismic Evaluation of ...

Create successful ePaper yourself
Turn your PDF publications into a flip-book with our unique Google optimized e-Paper software.
L1054<br />
L1041<br />
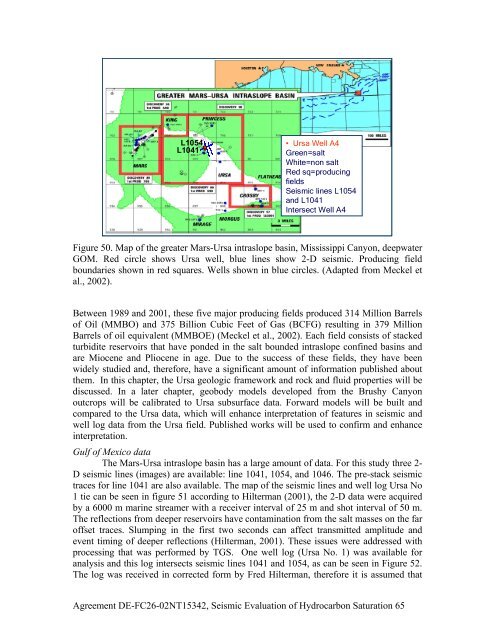
• Ursa Well A4<br />
Green=salt<br />
White=non salt<br />
Red sq=producing<br />
fields<br />
<strong>Seismic</strong> lines L1054<br />
and L1041<br />
Intersect Well A4<br />
Figure 50. Map <strong>of</strong> the greater Mars-Ursa intraslope basin, Mississippi Canyon, deepwater<br />
GOM. Red circle shows Ursa well, blue lines show 2-D seismic. Producing field<br />
boundaries shown in red squares. Wells shown in blue circles. (Adapted from Meckel et<br />
al., 2002).<br />
Between 1989 and 2001, these five major producing fields produced 314 Million Barrels<br />
<strong>of</strong> Oil (MMBO) and 375 Billion Cubic Feet <strong>of</strong> Gas (BCFG) resulting in 379 Million<br />
Barrels <strong>of</strong> oil equivalent (MMBOE) (Meckel et al., 2002). Each field consists <strong>of</strong> stacked<br />
turbidite reservoirs that have ponded in the salt bounded intraslope confined basins and<br />
are Miocene and Pliocene in age. Due to the success <strong>of</strong> these fields, they have been<br />
widely studied and, therefore, have a significant amount <strong>of</strong> information published about<br />
them. In this chapter, the Ursa geologic framework and rock and fluid properties will be<br />
discussed. In a later chapter, geobody models developed from the Brushy Canyon<br />
outcrops will be calibrated to Ursa subsurface data. Forward models will be built and<br />
compared to the Ursa data, which will enhance interpretation <strong>of</strong> features in seismic and<br />
well log data from the Ursa field. Published works will be used to confirm and enhance<br />
interpretation.<br />
Gulf <strong>of</strong> Mexico data<br />
The Mars-Ursa intraslope basin has a large amount <strong>of</strong> data. For this study three 2-<br />
D seismic lines (images) are available: line 1041, 1054, and 1046. The pre-stack seismic<br />
traces for line 1041 are also available. The map <strong>of</strong> the seismic lines and well log Ursa No<br />
1 tie can be seen in figure 51 according to Hilterman (2001), the 2-D data were acquired<br />
by a 6000 m marine streamer with a receiver interval <strong>of</strong> 25 m and shot interval <strong>of</strong> 50 m.<br />
The reflections from deeper reservoirs have contamination from the salt masses on the far<br />
<strong>of</strong>fset traces. Slumping in the first two seconds can affect transmitted amplitude and<br />
event timing <strong>of</strong> deeper reflections (Hilterman, 2001). These issues were addressed with<br />
processing that was performed by TGS. One well log (Ursa No. 1) was available for<br />
analysis and this log intersects seismic lines 1041 and 1054, as can be seen in Figure 52.<br />
The log was received in corrected form by Fred Hilterman, therefore it is assumed that<br />
<strong>Agreement</strong> <strong>DE</strong>-<strong>FC26</strong>-<strong>02NT15342</strong>, <strong>Seismic</strong> <strong>Evaluation</strong> <strong>of</strong> Hydrocarbon Saturation 65