Agreement DE-FC26-02NT15342, Seismic Evaluation of ...
Agreement DE-FC26-02NT15342, Seismic Evaluation of ...
Agreement DE-FC26-02NT15342, Seismic Evaluation of ...

You also want an ePaper? Increase the reach of your titles
YUMPU automatically turns print PDFs into web optimized ePapers that Google loves.
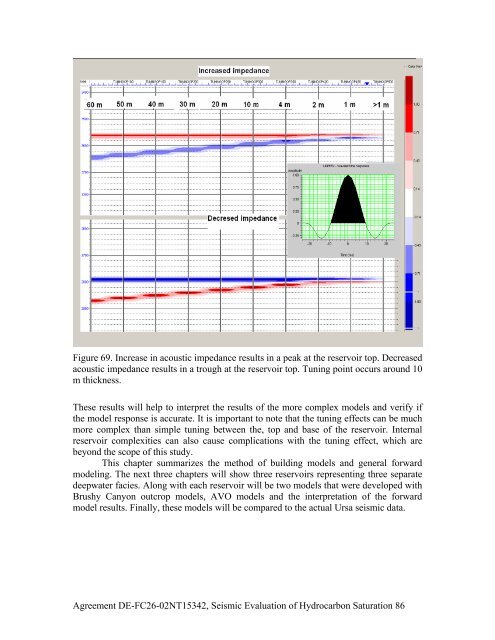
Figure 69. Increase in acoustic impedance results in a peak at the reservoir top. Decreased<br />
acoustic impedance results in a trough at the reservoir top. Tuning point occurs around 10<br />
m thickness.<br />
These results will help to interpret the results <strong>of</strong> the more complex models and verify if<br />
the model response is accurate. It is important to note that the tuning effects can be much<br />
more complex than simple tuning between the, top and base <strong>of</strong> the reservoir. Internal<br />
reservoir complexities can also cause complications with the tuning effect, which are<br />
beyond the scope <strong>of</strong> this study.<br />
This chapter summarizes the method <strong>of</strong> building models and general forward<br />
modeling. The next three chapters will show three reservoirs representing three separate<br />
deepwater facies. Along with each reservoir will be two models that were developed with<br />
Brushy Canyon outcrop models, AVO models and the interpretation <strong>of</strong> the forward<br />
model results. Finally, these models will be compared to the actual Ursa seismic data.<br />
<strong>Agreement</strong> <strong>DE</strong>-<strong>FC26</strong>-<strong>02NT15342</strong>, <strong>Seismic</strong> <strong>Evaluation</strong> <strong>of</strong> Hydrocarbon Saturation 86