Agreement DE-FC26-02NT15342, Seismic Evaluation of ...
Agreement DE-FC26-02NT15342, Seismic Evaluation of ...
Agreement DE-FC26-02NT15342, Seismic Evaluation of ...
You also want an ePaper? Increase the reach of your titles
YUMPU automatically turns print PDFs into web optimized ePapers that Google loves.
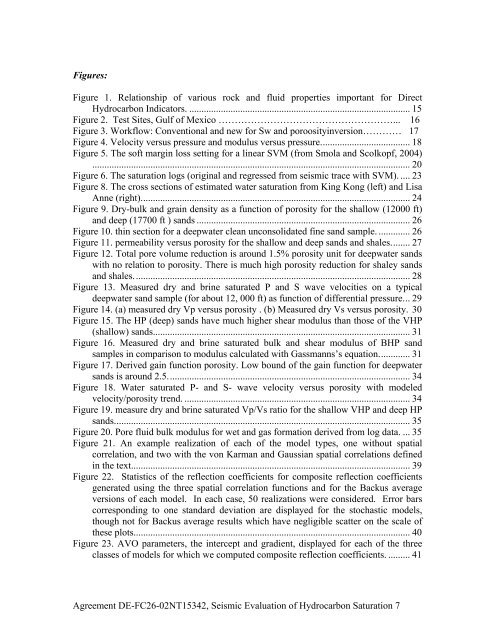
Figures:<br />
Figure 1. Relationship <strong>of</strong> various rock and fluid properties important for Direct<br />
Hydrocarbon Indicators. ........................................................................................... 15<br />
Figure 2. Test Sites, Gulf <strong>of</strong> Mexico ………………………………………………... 16<br />
Figure 3. Workflow: Conventional and new for Sw and poroosityinversion………… 17<br />
Figure 4. Velocity versus pressure and modulus versus pressure..................................... 18<br />
Figure 5. The s<strong>of</strong>t margin loss setting for a linear SVM (from Smola and Scolkopf, 2004)<br />
................................................................................................................................... 20<br />
Figure 6. The saturation logs (original and regressed from seismic trace with SVM). .... 23<br />
Figure 8. The cross sections <strong>of</strong> estimated water saturation from King Kong (left) and Lisa<br />
Anne (right)............................................................................................................... 24<br />
Figure 9. Dry-bulk and grain density as a function <strong>of</strong> porosity for the shallow (12000 ft)<br />
and deep (17700 ft ) sands ........................................................................................ 26<br />
Figure 10. thin section for a deepwater clean unconsolidated fine sand sample. ............. 26<br />
Figure 11. permeability versus porosity for the shallow and deep sands and shales........ 27<br />
Figure 12. Total pore volume reduction is around 1.5% porosity unit for deepwater sands<br />
with no relation to porosity. There is much high porosity reduction for shaley sands<br />
and shales.................................................................................................................. 28<br />
Figure 13. Measured dry and brine saturated P and S wave velocities on a typical<br />
deepwater sand sample (for about 12, 000 ft) as function <strong>of</strong> differential pressure... 29<br />
Figure 14. (a) measured dry Vp versus porosity . (b) Measured dry Vs versus porosity. 30<br />
Figure 15. The HP (deep) sands have much higher shear modulus than those <strong>of</strong> the VHP<br />
(shallow) sands.......................................................................................................... 31<br />
Figure 16. Measured dry and brine saturated bulk and shear modulus <strong>of</strong> BHP sand<br />
samples in comparison to modulus calculated with Gassmanns’s equation............. 31<br />
Figure 17. Derived gain function porosity. Low bound <strong>of</strong> the gain function for deepwater<br />
sands is around 2.5.................................................................................................... 34<br />
Figure 18. Water saturated P- and S- wave velocity versus porosity with modeled<br />
velocity/porosity trend. ............................................................................................. 34<br />
Figure 19. measure dry and brine saturated Vp/Vs ratio for the shallow VHP and deep HP<br />
sands.......................................................................................................................... 35<br />
Figure 20. Pore fluid bulk modulus for wet and gas formation derived from log data. ... 35<br />
Figure 21. An example realization <strong>of</strong> each <strong>of</strong> the model types, one without spatial<br />
correlation, and two with the von Karman and Gaussian spatial correlations defined<br />
in the text................................................................................................................... 39<br />
Figure 22. Statistics <strong>of</strong> the reflection coefficients for composite reflection coefficients<br />
generated using the three spatial correlation functions and for the Backus average<br />
versions <strong>of</strong> each model. In each case, 50 realizations were considered. Error bars<br />
corresponding to one standard deviation are displayed for the stochastic models,<br />
though not for Backus average results which have negligible scatter on the scale <strong>of</strong><br />
these plots.................................................................................................................. 40<br />
Figure 23. AVO parameters, the intercept and gradient, displayed for each <strong>of</strong> the three<br />
classes <strong>of</strong> models for which we computed composite reflection coefficients. ......... 41<br />
<strong>Agreement</strong> <strong>DE</strong>-<strong>FC26</strong>-<strong>02NT15342</strong>, <strong>Seismic</strong> <strong>Evaluation</strong> <strong>of</strong> Hydrocarbon Saturation 7


