Computational Models of Music Similarity and their ... - OFAI
Computational Models of Music Similarity and their ... - OFAI
Computational Models of Music Similarity and their ... - OFAI

You also want an ePaper? Increase the reach of your titles
YUMPU automatically turns print PDFs into web optimized ePapers that Google loves.
22 2 Audio-based <strong>Similarity</strong> Measures<br />
1<br />
DCT Matrix<br />
Mel Frequency Cepstral Coefficients Reconstructed<br />
80<br />
mfcc<br />
M_dB_rec<br />
60<br />
40<br />
20<br />
1 36<br />
0<br />
1 20<br />
20<br />
0<br />
1 10 20 30 36<br />
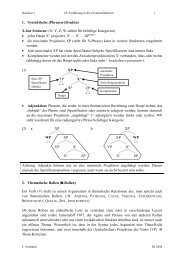
Figure 2.7: DCT matrix, MFCCs, <strong>and</strong> reconstructed Mel power spectrum (dB) for<br />
the audio signal used in Figure 2.3. High values in the DCT matrix are visualized<br />
as black. The dimensions <strong>of</strong> the DCT matrix are DCT coefficients on the y-axis<br />
<strong>and</strong> Mel frequency b<strong>and</strong>s on the x-axis.<br />
2.2.2.4 DCT<br />
The Discrete Cosine Transform is applied to compress the Mel power spectrum.<br />
In particular, the num_filt (e.g. 36) frequency b<strong>and</strong>s are represented<br />
by num_coeffs (e.g. 20) coefficients. Alternatives include, e.g., the Principial<br />
Component Analysis. A side effect <strong>of</strong> the compression is that the spectrum<br />
is smoothed along the frequency axis which can be interpreted as a simple<br />
approximation <strong>of</strong> the spectral masking in the human auditory system.<br />
The DCT matrix can be computed as follows. 11<br />
01 num_coeffs = 20; (2.8)<br />
02<br />
03 DCT = 1/sqrt(num_filt/2) * ...<br />
04 cos((0:num_coeffs-1)’*(0.5:num_filt)*pi/num_filt);<br />
05 DCT(1,:) = DCT(1,:)*sqrt(2)/2;<br />
Thus the DCT matrix has num_coeffs rows <strong>and</strong> num_filt columns. Each <strong>of</strong><br />
the rows corresponds to an eigenvector, starting with the most important one<br />
(highest eigenvalue) in the first row. The first eigenvector describes the mean<br />
<strong>of</strong> the spectrum. The second describes a spectral pattern with high energy<br />
in the lower half <strong>of</strong> the frequencies <strong>and</strong> low energy in the upper half. The<br />
eigenvectors are orthogonal. The DCT is applied to the Mel power spectrum<br />
(in Decibel) as follows:<br />
mfcc = DCT * M_dB; (2.9)<br />
The effects <strong>of</strong> the DCT matrix on the Mel power spectrum are shown in<br />
Figure 2.7. The resulting MFCCs are a compressed representation <strong>of</strong> the<br />
11 This code is based on Malcolm Slaney’s Auditory Toolbox.