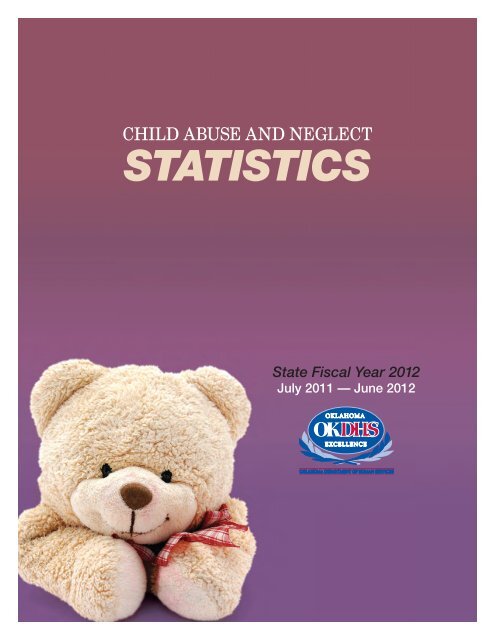
CHILD ABUSE AND NEGLECT STATISTICS - Oklahoma ...
CHILD ABUSE AND NEGLECT STATISTICS - Oklahoma ...
CHILD ABUSE AND NEGLECT STATISTICS - Oklahoma ...

You also want an ePaper? Increase the reach of your titles
YUMPU automatically turns print PDFs into web optimized ePapers that Google loves.
<strong>CHILD</strong> <strong>ABUSE</strong> <strong>AND</strong> <strong>NEGLECT</strong><br />
<strong>STATISTICS</strong><br />
State Fiscal Year 2012<br />
July 2011 — June 2012
TABLE OF CONTENTS<br />
Statistics-Introduction 3<br />
Abuse & Neglect 2003-2012 5<br />
Reports 6<br />
Map of Investigations 8<br />
Map of Assessments 9<br />
Map of Substantiations 10<br />
Substantiations<br />
Substantiated Child Abuse and Neglect<br />
By Reporting Source 11<br />
By Category 12<br />
Neglect by Type 13<br />
Physical Abuse By Type 14<br />
Physical Abuse By Type of Injury 15<br />
Sexual Abuse by Type 16<br />
Child Categories<br />
Substantiated Child Abuse and Neglect<br />
By Age of Child 17<br />
By Gender of Child 18<br />
By Race of Child 19<br />
Perpetrators<br />
Substantiated Child Abuse and Neglect, Alleged Perpetrator<br />
By Relationship to Child 20<br />
By Race of Perpetrator 21<br />
By Gender of Perpetrator 22<br />
By Age of Perpetrator 23<br />
Summaries by County<br />
Findings of Investigations and Assessment Conclusions 24<br />
Findings of Investigations 26<br />
Conclusions of Assessments 28<br />
2<br />
TABLE OF CONTENTS
<strong>STATISTICS</strong> — INTRODUCTION<br />
The <strong>Oklahoma</strong> Department of Human Services (OKDHS) is charged with the responsibility of promptly<br />
investigating or assessing all accepted reports of alleged child abuse and neglect by the person<br />
responsible for the child’s care. Persons responsible for the care of children are parents, guardians,<br />
custodians, foster parents, any other adults living in the home of the child, and operators, owners, or<br />
employees of child care facilities or homes. OKDHS is further charged with maintaining a record of the<br />
investigation findings and assessment conclusions. Reports of all investigations are forwarded to the<br />
district attorney with recommendations for disposition.<br />
OKDHS Child Welfare staff work to provide maximum safety for children and to enable families to<br />
remain together, if at all possible. The majority of families that are identified through a report of abuse<br />
or neglect can be assisted through services from either community agencies or, if appropriate, through<br />
voluntary services from OKDHS. In serious cases of abuse or neglect, however, court intervention and<br />
removal of the children from their homes may be necessary. Removal of a child from his or her home<br />
can occur either through a court order or, in the case of an emergency, by law enforcement. OKDHS<br />
Child Welfare staff do not have the authority to remove children from their homes.<br />
This statistical document for state fiscal year 2012 (July 1, 2011 through June 30, 2012) reflects data<br />
on child abuse and neglect reports received and accepted for investigation. Also included in this<br />
document is an alternative category of response to reports, the assessment. Assessments are<br />
conducted when the allegation of abuse or neglect does not constitute a serious or immediate threat to<br />
a child’s health or safety. Investigations are conducted when the report contains allegations of serious<br />
threats to the alleged child victim’s safety.<br />
This statistical document reflects the finding categories that are possible once an investigation has been<br />
completed.<br />
• A finding of services not needed means that there is no abuse or neglect and the family does not<br />
need any prevention or intervention services.<br />
• A finding of services recommended means that the allegations are determined to be unfounded<br />
but the family could benefit from prevention or intervention services.<br />
• A finding of substantiated services recommended means that the allegations, based on credible<br />
evidence, constitute child abuse or neglect and services without court intervention will assist the family.<br />
• A finding of substantiated court intervention means that the allegations, based on credible<br />
evidence, constitute child abuse or neglect of such a serious nature that court intervention is<br />
recommended.<br />
• A finding of reasonable parental discipline means that the person responsible for a child used<br />
ordinary force and age-appropriate reasonable discipline. This finding results in expungement of record<br />
of the referral and assessment or investigation.<br />
<strong>STATISTICS</strong> 3
Investigation of deaths typically take over a year to complete due to their complicated nature and<br />
necessity in waiting for certain information from other entities. Thus, including the death statistics<br />
significantly delays the production of this entire statistical document. It is for this reason that a separate<br />
statistical document pertaining solely to child deaths and near deaths will be produced later as an<br />
addendum to this report.<br />
OKDHS received 68,111 reports on families and determined after screening that 32,421 reports had<br />
allegations that met the definition of abuse and neglect and required investigation or assessment.<br />
There were 34,030 children for whom an investigation was completed and a finding made. There were<br />
10,202 children for whom an assessment was completed. Findings are not made in assessments.<br />
4<br />
<strong>STATISTICS</strong>
<strong>ABUSE</strong> <strong>AND</strong> <strong>NEGLECT</strong><br />
The following chart gives a summary of children for whom an investigation or assessment of abuse and<br />
neglect was completed and who were substantiated to be victims during the span of the past decade.<br />
NOTE: This number is a duplicated count of children since a child could be the subject of more<br />
than one investigation or assessment.<br />
Children Substantiated to be Victims of Child Abuse and Neglect<br />
State Fiscal Years 2003 – 2012<br />
Fiscal<br />
Year<br />
Investigated/<br />
Assessed<br />
Subst-<br />
antiated<br />
Percent<br />
Substantiated<br />
Fiscal<br />
Year<br />
Investigated/<br />
Assessed<br />
Substantiated<br />
Percent<br />
Substantiated<br />
2003 62,626 12,971 20.71%<br />
2004 60,770 12,347 20.32%<br />
2005 61,926 13,328 21.52%<br />
2006 63,116 13,827 21.91%<br />
2007 62,559 13,191 21.09%<br />
2008 61,327 11,714 19.10%<br />
2009 53,394 8,605 16.12%<br />
2010 45,811 7,248 15.82%<br />
2011 48,393 8,110 16.76%<br />
2012 44,232 9,842 22.25%<br />
2003<br />
2004<br />
2005<br />
2006<br />
2007<br />
2008<br />
2009<br />
2010<br />
2011<br />
2012<br />
62,626<br />
12,971<br />
60,770<br />
12,347<br />
61,926<br />
13,328<br />
63,116<br />
13,827<br />
62,559<br />
13,191<br />
61,327<br />
11,714<br />
53,394<br />
8,605<br />
45,811<br />
7,248<br />
48,393<br />
8,110<br />
44,232<br />
9,842<br />
0 10,000 20,000 30,000 40,000 50,000 60,000 70,000<br />
Substantiated Investigated/Assessed<br />
Source: OKDHS Child Welfare Services<br />
<strong>ABUSE</strong> <strong>AND</strong> <strong>NEGLECT</strong> 5
REPORTS<br />
The following table details the number of reports received and screened, by county, during fiscal<br />
year 2012. Each report is screened to assure that it meets the statutory definition of abuse and<br />
neglect and that it is within the legal scope of OKDHS. Once a report is accepted, an investigation<br />
or assessment is completed on behalf of each alleged child victim identified in the report. A report<br />
may have only one identified child victim or there may be multiple identified child victims. During<br />
fiscal year 2012, there were 68,111 reports received and screened. After screening, 32,421 reports<br />
were accepted for investigation or assessment.<br />
Child Abuse and Neglect Reports by County<br />
State Fiscal Year 2012<br />
County of<br />
Investigation/<br />
Assessment<br />
Reports<br />
Received<br />
Screened<br />
Out<br />
Screen Out<br />
Rate<br />
Reports<br />
Accepted<br />
Acceptance<br />
Rate<br />
State Totals 68,111 35,690 52% 32,421 48%<br />
Adair 433 210 48% 223 52%<br />
Alfalfa 70 28 40% 42 60%<br />
Atoka 350 129 37% 221 63%<br />
Beaver 36 22 61% 14 39%<br />
Beckham 404 171 42% 233 58%<br />
Blaine 225 90 40% 135 60%<br />
Bryan 1,083 508 47% 575 53%<br />
Caddo 423 158 37% 265 63%<br />
Canadian 1,405 573 41% 832 59%<br />
Carter 888 357 40% 531 60%<br />
Cherokee 867 438 51% 429 49%<br />
Choctaw 338 151 45% 187 55%<br />
Cimarron 13 10 77% 3 23%<br />
Cleveland 2,994 1,345 45% 1,649 55%<br />
Coal 197 83 42% 114 58%<br />
Comanche 1,817 669 37% 1,148 63%<br />
Cotton 110 42 38% 68 62%<br />
Craig 240 125 52% 115 48%<br />
Creek 1,238 593 48% 645 52%<br />
Custer 389 167 43% 222 57%<br />
Delaware 748 356 48% 392 52%<br />
Dewey 28 19 68% 9 32%<br />
Ellis 32 20 62% 12 38%<br />
Garfield 936 400 43% 536 57%<br />
Garvin 396 194 49% 202 51%<br />
Grady 625 313 50% 312 50%<br />
Grant 40 18 45% 22 55%<br />
Greer 126 49 39% 77 61%<br />
Harmon 56 29 52% 27 48%<br />
Harper 24 11 46% 13 54%<br />
Haskell 200 101 50% 99 50%<br />
Hughes 305 158 52% 147 48%<br />
6<br />
REPORTS
County of<br />
Investigation/<br />
Assessment<br />
Reports<br />
Received<br />
Screened<br />
Out<br />
Screen Out<br />
Rate<br />
Reports<br />
Accepted<br />
Acceptance<br />
Rate<br />
Jackson 398 179 45% 219 55%<br />
Jefferson 134 63 47% 71 53%<br />
Johnston 284 147 52% 137 48%<br />
Kay 661 298 45% 363 55%<br />
Kingfisher 116 50 43% 66 57%<br />
Kiowa 155 60 39% 95 61%<br />
Latimer 151 78 52% 73 48%<br />
LeFlore 837 403 48% 434 52%<br />
Lincoln 485 227 47% 258 53%<br />
Logan 512 255 50% 257 50%<br />
Love 125 62 50% 63 50%<br />
Major 98 35 36% 63 64%<br />
Marshall 342 152 44% 190 56%<br />
Mayes 933 587 63% 346 37%<br />
McClain 448 209 47% 239 53%<br />
McCurtain 766 414 54% 352 46%<br />
McIntosh 377 175 46% 202 54%<br />
Murray 196 105 54% 91 46%<br />
Muskogee 1,635 844 52% 791 48%<br />
Noble 179 70 39% 109 61%<br />
Nowata 221 103 47% 118 53%<br />
Okfuskee 214 114 53% 100 47%<br />
<strong>Oklahoma</strong> 19,877 13,337 67% 6,540 33%<br />
Okmulgee 699 333 48% 366 52%<br />
Osage 569 259 46% 310 54%<br />
Ottawa 706 369 52% 337 48%<br />
Pawnee 289 148 51% 141 49%<br />
Payne 966 482 50% 484 50%<br />
Pittsburg 1,122 555 49% 567 51%<br />
Pontotoc 760 377 50% 383 50%<br />
Pottawatomie 1,354 588 43% 766 57%<br />
Pushmataha 251 112 45% 139 55%<br />
Rogers 1,056 647 61% 409 39%<br />
Roger Mills 41 25 61% 16 39%<br />
Seminole 584 289 49% 295 51%<br />
Sequoyah 950 470 49% 480 51%<br />
Stephens 711 293 41% 418 59%<br />
Texas 170 54 32% 116 68%<br />
Tillman 88 50 57% 38 43%<br />
Tulsa 8,811 3,738 42% 5,073 58%<br />
Wagoner 920 437 47% 483 53%<br />
Washington 1,122 664 59% 458 41%<br />
Washita 166 69 42% 97 58%<br />
Woods 154 54 35% 100 65%<br />
Woodward 442 173 39% 269 61%<br />
REPORTS 7
INVESTIGATIONS<br />
The map below details a duplicated count of children, by county, who were the subject of an<br />
investigation during the state fiscal year.<br />
Number of Children Investigated for Alleged Child Abuse or Neglect<br />
By County State Fiscal Year 2012 Total: 34,030<br />
Adair 253<br />
Alfalfa 53<br />
Atoka 260<br />
Beaver 13<br />
Beckham 274<br />
Blaine 148<br />
Bryan 458<br />
Caddo 297<br />
Canadian 914<br />
Carter 596<br />
Cherokee 397<br />
Choctaw 197<br />
Cimarron 5<br />
Cleveland 1,654<br />
Coal 149<br />
Comanche 1,250<br />
Cotton 83<br />
Craig 123<br />
Creek 666<br />
Custer 240<br />
Delaware 433<br />
Dewey 13<br />
Ellis 21<br />
Garfield 530<br />
Garvin 212<br />
Grady 364<br />
Grant 33<br />
Greer 130<br />
Harmon 37<br />
Harper 11<br />
Haskell 130<br />
Hughes 189<br />
Jackson 260<br />
Jefferson 58<br />
Johnston 157<br />
Kay 330<br />
Kingfisher 60<br />
Kiowa 91<br />
Latimer 82<br />
LeFlore 533<br />
Lincoln 339<br />
Logan 310<br />
Love 87<br />
Major 53<br />
Marshall 187<br />
Mayes 298<br />
McClain 225<br />
McCurtain 328<br />
McIntosh 166<br />
Murray 94<br />
Muskogee 951<br />
Noble 123<br />
Nowata 109<br />
Okfuskee 132<br />
<strong>Oklahoma</strong> 7,353<br />
Okmulgee 375<br />
Osage 349<br />
Ottawa 253<br />
Pawnee 152<br />
Payne 486<br />
Pittsburg 715<br />
Pontotoc 314<br />
Pottawatomie 920<br />
Pushmataha 153<br />
Rogers 339<br />
Roger Mills 12<br />
Seminole 345<br />
Sequoyah 527<br />
Stephens 427<br />
Texas 124<br />
Tillman 45<br />
Tulsa 4,829<br />
Wagoner 473<br />
Washington 251<br />
Washita 105<br />
Woods 105<br />
Woodward 272<br />
Total 34,030<br />
CIMARRON<br />
TEXAS<br />
BEAVER<br />
HARPER<br />
WOODS ALFALFA GRANT KAY OSAGE<br />
NOWATA CRAIG<br />
5 124 13 11 105 53 33 330 349 109 123<br />
Child Abuse and Neglect Investigations<br />
0 to 99 (18)<br />
100 to 199 (18)<br />
200 to 299 (12)<br />
300 to 1,499 (26)<br />
1,500 to 8,000 (3)<br />
Source: OKDHS Child Welfare Services<br />
ELLIS<br />
21<br />
ROGER MILLS<br />
12<br />
BECKHAM<br />
274<br />
HARMON<br />
37<br />
GREER<br />
130<br />
WOODWARD<br />
272<br />
JACKSON<br />
260<br />
DEWEY BLAINE KINGFISHER<br />
13 148 60<br />
CUSTER<br />
240<br />
WASHITA<br />
105<br />
KIOWA<br />
91<br />
TILLMAN<br />
45<br />
MAJOR<br />
53<br />
CADDO<br />
297<br />
COMANCHE<br />
1,250<br />
COTTON<br />
83<br />
GARFIELD NOBLE<br />
530 123<br />
CANADIAN OKLAHOMA<br />
914 7,353<br />
GRADY<br />
STEPHENS<br />
427<br />
JEFFERSON<br />
58<br />
LOGAN<br />
310<br />
364 225<br />
CLEVEL<strong>AND</strong><br />
1,654<br />
McCLAIN<br />
GARVIN<br />
212<br />
CARTER<br />
596<br />
LOVE<br />
87<br />
PAYNE<br />
486<br />
POTTAWATOMIE<br />
920<br />
94<br />
MURRAY<br />
152<br />
LINCOLN<br />
339<br />
PAWNEE<br />
SEMINOLE<br />
345<br />
PONTOTOC<br />
314<br />
157<br />
JOHNSTON<br />
MARSHALL<br />
187<br />
COAL<br />
149<br />
TULSA<br />
WASHINGTON<br />
4,829 251<br />
PITTSBURG<br />
715<br />
ATOKA<br />
260<br />
ROGERS<br />
339<br />
BRYAN<br />
CHOCTAW<br />
458 197<br />
MAYES<br />
298<br />
WAGONER CHEROKEE<br />
ADAIR<br />
CREEK<br />
473 397<br />
666<br />
253<br />
MUSKOGEE<br />
OKMULGEE<br />
951<br />
375<br />
SEQUOYAH<br />
OKFUSKEE<br />
132<br />
527<br />
McINTOSH<br />
166<br />
HASKELL<br />
HUGHES<br />
130 Le FLORE<br />
189<br />
533<br />
LATIMER<br />
82<br />
DELAWARE OTTAWA<br />
433 253<br />
PUSHMATAHA McCURTAIN<br />
153 328<br />
8<br />
INVESTIGATIONS
ASSESSMENTS<br />
The map below details a duplicated count of children, by county, who were the subject of an<br />
assessment during the state fiscal year.<br />
Number of Children Assessed for Alleged Child Abuse or Neglect By County<br />
State Fiscal Year 2012 Total: 10,202<br />
Adair 6<br />
Alfalfa 10<br />
Atoka 67<br />
Beaver 6<br />
Beckham 70<br />
Blaine 46<br />
Bryan 142<br />
Caddo 145<br />
Canadian 176<br />
Carter 128<br />
Cherokee 244<br />
Choctaw 73<br />
Cimarron 4<br />
Cleveland 571<br />
Coal 21<br />
Comanche 347<br />
Cotton 19<br />
Craig 79<br />
Creek 170<br />
Custer 111<br />
Delaware 85<br />
Dewey 5<br />
Ellis 0<br />
Garfield 135<br />
Garvin 74<br />
Grady 93<br />
Grant 2<br />
Greer 24<br />
Harmon 12<br />
Harper 3<br />
Haskell 21<br />
Hughes 49<br />
Jackson 68<br />
Jefferson 20<br />
Johnston 37<br />
Kay 78<br />
Kingfisher 19<br />
Kiowa 24<br />
Latimer 28<br />
LeFlore 91<br />
Lincoln 70<br />
Logan 98<br />
Love 2<br />
Major 19<br />
Marshall 39<br />
Mayes 66<br />
McClain 66<br />
McCurtain 234<br />
McIntosh 83<br />
Murray 21<br />
Muskogee 190<br />
Noble 31<br />
Nowata 33<br />
Okfuskee 28<br />
<strong>Oklahoma</strong> 1,883<br />
Okmulgee 98<br />
Osage 148<br />
Ottawa 229<br />
Pawnee 27<br />
Payne 105<br />
Pittsburg 117<br />
Pontotoc 134<br />
Pottawatomie 313<br />
Pushmataha 26<br />
Rogers 201<br />
Roger Mills 3<br />
Seminole 85<br />
Sequoyah 146<br />
Stephens 93<br />
Texas 52<br />
Tillman 6<br />
Tulsa 1,752<br />
Wagoner 122<br />
Washington 227<br />
Washita 45<br />
Woods 28<br />
Woodward 79<br />
Total 10,202<br />
CIMARRON<br />
4<br />
TEXAS<br />
52<br />
BEAVER<br />
6<br />
Child Abuse and Neglect Assessments<br />
0 to 50 (33)<br />
51 to 99 (20)<br />
100 to 199 (14)<br />
200 to 899 (8)<br />
900 to 1,900 (2)<br />
HARPER<br />
WOODS ALFALFA GRANT KAY OSAGE<br />
3<br />
28 10 2 78 148<br />
GARFIELD NOBLE<br />
ELLIS<br />
0<br />
WOODWARD<br />
79<br />
135 31<br />
MAJOR<br />
19<br />
27<br />
PAWNEE<br />
DEWEY BLAINE KINGFISHER LOGAN PAYNE<br />
5 46 19 98 105<br />
WAGONER CHEROKEE<br />
ADAIR<br />
CREEK<br />
122 224<br />
ROGER MILLS<br />
LINCOLN<br />
6<br />
3<br />
170<br />
CUSTER<br />
111<br />
70<br />
OKMULGEE MUSKOGEE<br />
CANADIAN OKLAHOMA<br />
98<br />
190 SEQUOYAH<br />
176 1,883<br />
OKFUSKEE<br />
146<br />
28<br />
McINTOSH<br />
BECKHAM WASHITA<br />
CLEVEL<strong>AND</strong><br />
83<br />
70 45<br />
CADDO<br />
HASKELL<br />
HUGHES<br />
145<br />
571<br />
85<br />
Le FLORE<br />
49<br />
21<br />
91<br />
GREER<br />
66<br />
KIOWA<br />
PITTSBURG LATIMER<br />
GRADY<br />
24<br />
McCLAIN<br />
24<br />
117 28<br />
93<br />
GARVIN PONTOTOC<br />
COMANCHE<br />
74 134<br />
347<br />
COAL<br />
JACKSON<br />
STEPHENS<br />
21<br />
68<br />
93<br />
21<br />
MURRAY<br />
ATOKA PUSHMATAHA McCURTAIN<br />
TILLMAN<br />
COTTON<br />
6<br />
37<br />
67 26 234<br />
19<br />
CARTER JOHNSTON<br />
JEFFERSON 128<br />
20<br />
MARSHALL<br />
BRYAN<br />
CHOCTAW<br />
LOVE 2 39 142 73<br />
HARMON<br />
12<br />
POTTAWATOMIE<br />
313<br />
SEMINOLE<br />
TULSA WASHINGTON<br />
1,752 227<br />
NOWATA CRAIG<br />
33 79<br />
ROGERS<br />
201<br />
MAYES<br />
66<br />
DELAWARE OTTAWA<br />
229<br />
85<br />
Source: OKDHS Child Welfare Services<br />
ASSESSMENTS 9
SUBSTANTIATIONS<br />
The map below details the number of children, by county, who were substantiated to be victims of<br />
child abuse and neglect.<br />
NOTE: These numbers reflect a duplicated count of children substantiated to be victims of<br />
child abuse and neglect.<br />
Children Substantiated to be Victims of Child Abuse or Neglect By County<br />
State Fiscal Year 2012 Total: 9,842<br />
Adair 71<br />
Alfalfa 7<br />
Atoka 61<br />
Beaver 8<br />
Beckham 100<br />
Blaine 52<br />
Bryan 166<br />
Caddo 57<br />
Canadian 395<br />
Carter 201<br />
Cherokee 73<br />
Choctaw 73<br />
Cimarron 1<br />
Cleveland 250<br />
Coal 38<br />
Comanche 301<br />
Cotton 36<br />
Craig 38<br />
Creek 217<br />
Custer 84<br />
Delaware 78<br />
Dewey 0<br />
Ellis 7<br />
Garfield 93<br />
Garvin 66<br />
Grady 81<br />
Grant 8<br />
Greer 46<br />
Harmon 18<br />
Harper 2<br />
Haskell 40<br />
Hughes 66<br />
Jackson 72<br />
Jefferson 17<br />
Johnston 28<br />
Kay 87<br />
Kingfisher 20<br />
Kiowa 18<br />
Latimer 21<br />
LeFlore 138<br />
Lincoln 112<br />
Logan 99<br />
Love 24<br />
Major 20<br />
Marshall 49<br />
Mayes 71<br />
McClain 73<br />
McCurtain 99<br />
McIntosh 61 Rogers 97<br />
Murray 14 Roger Mills 2<br />
Muskogee 343 Seminole 129<br />
Noble 37 Sequoyah 134<br />
Nowata 24 Stephens 92<br />
Okfuskee 53 Texas 52<br />
<strong>Oklahoma</strong> 2,358 Tillman 4<br />
Okmulgee 134 Tulsa 1,325<br />
Osage 137 Wagoner 119<br />
Ottawa 39 Washington 123<br />
Pawnee 40 Washita 13<br />
Payne 157 Woods 34<br />
Pittsburg 177 Woodward 76<br />
Pontotoc 99<br />
Pottawatomie 248<br />
Pushmataha 39 TOTAL 9,842<br />
CIMARRON<br />
1<br />
TEXAS<br />
52<br />
BEAVER<br />
8<br />
Child Abuse and Neglect Substantiated<br />
0 to 29 (20)<br />
30 to 79 (27)<br />
80 to 139 (18)<br />
140 to 999 (10)<br />
1,000 to 2,400 (2)<br />
HARPER<br />
WOODS ALFALFA GRANT KAY OSAGE<br />
2<br />
34 7 8 87 137<br />
GARFIELD NOBLE<br />
ELLIS<br />
7<br />
WOODWARD<br />
76<br />
93 37<br />
MAJOR<br />
20<br />
40<br />
PAWNEE<br />
DEWEY BLAINE KINGFISHER LOGAN PAYNE<br />
0 52 20 99 157<br />
WAGONER CHEROKEE<br />
ADAIR<br />
CREEK<br />
119 73<br />
ROGER MILLS<br />
LINCOLN<br />
71<br />
2<br />
217<br />
CUSTER<br />
84<br />
112<br />
OKMULGEE MUSKOGEE<br />
CANADIAN OKLAHOMA<br />
134 343 SEQUOYAH<br />
395 2,358<br />
OKFUSKEE<br />
134<br />
53<br />
McINTOSH<br />
BECKHAM WASHITA<br />
CLEVEL<strong>AND</strong><br />
61<br />
100 13<br />
CADDO<br />
HASKELL<br />
HUGHES<br />
57<br />
250<br />
129<br />
Le FLORE<br />
66<br />
40<br />
138<br />
GREER<br />
73<br />
KIOWA<br />
PITTSBURG LATIMER<br />
GRADY<br />
46<br />
McCLAIN<br />
18<br />
177 21<br />
81<br />
GARVIN PONTOTOC<br />
COMANCHE<br />
66 99<br />
301<br />
COAL<br />
JACKSON<br />
STEPHENS<br />
38<br />
72<br />
92<br />
14<br />
MURRAY<br />
ATOKA PUSHMATAHA McCURTAIN<br />
TILLMAN<br />
COTTON<br />
4<br />
28<br />
61 39 99<br />
36<br />
CARTER JOHNSTON<br />
JEFFERSON 201<br />
17<br />
MARSHALL<br />
BRYAN<br />
CHOCTAW<br />
LOVE 24 49 166 73<br />
HARMON<br />
18<br />
POTTAWATOMIE<br />
248<br />
SEMINOLE<br />
TULSA WASHINGTON<br />
1,325 123<br />
NOWATA CRAIG<br />
24 38<br />
ROGERS<br />
97<br />
MAYES<br />
71<br />
DELAWARE OTTAWA<br />
39<br />
78<br />
Source: OKDHS Child Welfare Services<br />
10<br />
SUBSTANTIATIONS
SUBSTANTIATIONS<br />
The chart below provides information on the reporting source for each substantiated abuse and<br />
neglect investigation in state fiscal year 2012. Law Enforcement is the most frequent reporting<br />
source of child maltreatment.<br />
Substantiated Child Abuse and Neglect by Reporting Source<br />
State Fiscal Year 2012<br />
Reporting Source<br />
Count Percent<br />
Reporting Source Count Percent<br />
Law Enforcement 2,051 20.83%<br />
CWS Staff 1,907 19.38%<br />
Relative 1,001 10.17%<br />
School 906 9.21%<br />
Private Individual 682 6.93%<br />
Social Worker (non AFS/CWS) 608 6.18%<br />
Hospital 511 5.19%<br />
Counselor/Therapist 448 4.55%<br />
Parent 360 3.66%<br />
Nurse/Other Medical Professional 353 3.59%<br />
Public Social Agency 338 3.43%<br />
Neighbor 156 1.59%<br />
Private Agency 121 1.23%<br />
Unknown 107 1.09%<br />
Child Care Provider 101 1.03%<br />
Physician 60 0.61%<br />
Adult and Family Services 57 0.58%<br />
Foster/Kinship Parent 24 0.24%<br />
Medical Examiner 23 0.23%<br />
Alleged Perpetrator 13 0.13%<br />
Victim - Self Referral 12 0.12%<br />
Dentist 3 0.03%<br />
TOTAL 9,842 100.00%<br />
Total of all Categories Under 3%<br />
6.88%<br />
Public Social Agency<br />
3.43%<br />
Nurse/Other Medical Professional<br />
3.59%<br />
Law Enforcement<br />
20.83%<br />
Parent<br />
3.66%<br />
Counselor/Therapist<br />
4.55% CWS Staff<br />
Hospital<br />
5.19%<br />
19.38%<br />
Social Worker (non AFS/CWS)<br />
6.18%<br />
Relative<br />
10.17%<br />
Private Individual<br />
6.93%<br />
School<br />
9.21%<br />
Source: OKDHS Child Welfare Services<br />
SUBSTANTIATIONS 11
SUBSTANTIATIONS<br />
The chart below shows the categories of substantiated abuse and neglect. Neglect continues to be<br />
the highest single category of child maltreatment.<br />
NOTE: Children can be victims of more than one type of abuse or neglect so totals of substantiated<br />
abuse and neglect by category are greater than the total number of substantiated reports.<br />
Substantiated Child Abuse and Neglect by Category<br />
State Fiscal Year 2012<br />
Category Count Percent<br />
Neglect 13,566 61.81%<br />
Abuse 7,560 34.45%<br />
Sexual Abuse 821 3.74%<br />
TOTAL 21,947 100.00%<br />
Sexual Abuse<br />
3.74%<br />
Abuse<br />
34.45%<br />
Neglect<br />
61.81%<br />
Source: OKDHS Child Welfare Services<br />
12<br />
SUBSTANTIATIONS
SUBSTANTIATIONS<br />
Failure to Protect is the most frequent type of neglect substantiated in fiscal year 2012.<br />
NOTE: Children can be victims of more than one type of abuse or neglect so totals of substantiated<br />
abuse and neglect by category are greater than the total number of substantiated reports.<br />
Substantiated Child Neglect by Type<br />
State Fiscal Year 2012<br />
Category Count Percent<br />
Failure to Protect 3,520 25.94%<br />
Exposure to Domestic 3,277 24.16%<br />
Violence<br />
Inadequate or Dangerous 1,846 13.61%<br />
Shelter<br />
Other 1,449 10.68%<br />
Lack of Supervision 1,313 9.68%<br />
Inadequate Physical Care 539 3.97%<br />
Abandonment 534 3.94%<br />
Failure to Obtain Medical 311 2.29%<br />
Attention<br />
Failure to Provide Adequate<br />
Nutrition<br />
236 1.74%<br />
Category Count Percent<br />
Educational 200 1.47%<br />
Sexual Behavior - Lack of 187 1.38%<br />
Supervision<br />
Failure to Obtain Psychiatric 83 0.61%<br />
Attention<br />
Failure to Thrive 35 0.26%<br />
Death 22 0.16%<br />
Threat of Harm 9 0.07%<br />
Near Death 5 0.04%<br />
TOTAL 13,566 100.00%<br />
Total of all Categories Under 3%<br />
8.02%<br />
Failure to Protect<br />
25.94%<br />
Abandonment<br />
3.94%<br />
Inadequate Physical Care<br />
3.97% Exposure to<br />
Domestic Violence<br />
24.16%<br />
Lack of Supervision<br />
9.68%<br />
Other<br />
10.68%<br />
Inadequate or<br />
Dangerous Shelter<br />
13.61%<br />
Source: OKDHS Child Welfare Services<br />
SUBSTANTIATIONS 13
SUBSTANTIATIONS<br />
For substantiated cases, the table and chart below details the types of physical abuse inflicted on<br />
child victims.<br />
NOTE: Children can be victims of more than one type of abuse or neglect so totals of substantiated<br />
abuse and neglect by category are greater than the total number of substantiated reports.<br />
Substantiated Child Abuse and Neglect, Physical Abuse by Type<br />
State Fiscal Year 2012<br />
Category Count Percent Category<br />
Count Percent<br />
Threat of Harm 5,906 78.13%<br />
Beating/Hitting/Slapping 559 7.40%<br />
Beating/Hitting-Instrument 392 5.19%<br />
Other 227 3.00%<br />
Mental Injury 155 2.05%<br />
Injury from Spanking 69 0.91%<br />
Choking 51 0.67%<br />
Confinement 41 0.54%<br />
Burning/Scalding 28 0.37%<br />
Shaking 20 0.26%<br />
Death 19 0.25%<br />
Thrown 18 0.24%<br />
Pinching/Twisting/<br />
Gouging 16 0.21%<br />
Near Death 15 0.20%<br />
Biting 11 0.15%<br />
Kicking 10 0.13%<br />
Ritual Abuse 6 0.08%<br />
Fabricated or Induced<br />
4 0.05%<br />
Illness (MSBP)<br />
Suffocating 4 0.05%<br />
Cutting/Puncturing 3 0.04%<br />
Poisoning 3 0.04%<br />
Failure to Protect 2 0.03%<br />
Hitting 1 0.01%<br />
TOTAL 7,560 100.00%<br />
Total of all Categories Under 3%<br />
6.28%<br />
Other<br />
3.00%<br />
Threat of Harm<br />
78.13%<br />
Beating/Hitting-Instrument<br />
5.19%<br />
Beating/Hitting/Slapping<br />
7.40%<br />
Source: OKDHS Child Welfare Services<br />
14<br />
SUBSTANTIATIONS
SUBSTANTIATIONS<br />
For substantiated cases, the types of injuries resulting from physical abuse inflicted on child victims<br />
are listed below.<br />
NOTE: Children can be victims of more than one type of abuse or neglect so totals of substantiated<br />
abuse and neglect by category are greater than the total number of substantiated reports.<br />
Substantiated Child Abuse, Physical Abuse by Type of Injury<br />
State Fiscal Year 2012<br />
Category Count Percent<br />
None Apparent 944 49.02%<br />
Bruises/Welts 295 15.33%<br />
Substance Abuse 166 8.62%<br />
Other 154 8.00%<br />
Abrasions/Lacerations 53 2.75%<br />
Fractures-Not Skull 48 2.49%<br />
Methamphetamine Exposure 47 2.44%<br />
Head Trauma 33 1.71%<br />
Burns/Scalding 25 1.30%<br />
Environmental Drug Exposu 23 1.19%<br />
Mental Trauma 21 1.09%<br />
Medical Condition Untreated 18 0.93%<br />
Cuts/Punctures 12 0.62%<br />
Failure to Thrive 12 0.62%<br />
Death 12 0.62%<br />
Drowning 10 0.52%<br />
Category Count Percent<br />
Skull Fracture 9 0.47%<br />
Near Death 8 0.42%<br />
Poisoning 5 0.26%<br />
Gun Shot Wound(s) 5 0.26%<br />
Cause of Death Unknown 5 0.26%<br />
Smoke Inhalation 4 0.21%<br />
Bite Marks 4 0.21%<br />
Vaginal Injury/Irregularities 3 0.16%<br />
Malnutrition 2 0.10%<br />
Internal Injuries 2 0.10%<br />
Asphyxiation 2 0.10%<br />
Cause of Near Death Unknown 2 0.10%<br />
Rectal Injury/Irregularities 1 0.05%<br />
Stab/Knife Wound(s) 1 0.05%<br />
TOTAL 1,926 100.00%<br />
Total of all Categories Under 3%<br />
19.03%<br />
None Apparent<br />
49.02%<br />
Other<br />
8.00%<br />
Substance Abuse<br />
8.62%<br />
Bruises/Welts<br />
15.33%<br />
Source: OKDHS Child Welfare Services<br />
SUBSTANTIATIONS 15
SUBSTANTIATIONS<br />
The types of sexual abuse inflicted on child victims are listed below.<br />
NOTE: Children can be victims of more than one type of abuse or neglect so totals of substantiated<br />
abuse and neglect by category are greater than the total number of substantiated reports.<br />
Substantiated Sexual Abuse by Type<br />
State Fiscal Year 2012<br />
Category Count Percent<br />
Category<br />
Count<br />
Percent<br />
Fondling 216 26.32%<br />
Exposure to Adult Sexuality 133 16.20%<br />
Other 99 12.06%<br />
Oral/Genital Contact 76 9.26%<br />
Age Inappropriate<br />
74 9.01%<br />
Sexual Behavior<br />
Vaginal Penetration<br />
69 8.40%<br />
through Intercourse<br />
Digital Vaginal Penetration 52 6.33%<br />
Anal Penetration<br />
23 2.80%<br />
through Intercourse<br />
Pornography - Exposure 22 2.68%<br />
Sexual Exploitation 21 2.56%<br />
Digital Anal Penetration 13 1.58%<br />
Pornography - Participation 8 0.97%<br />
Anal Penetration<br />
5 0.61%<br />
through Instrumentation<br />
Vaginal Penetration<br />
5 0.61%<br />
through Instrument<br />
Exhibitionism 4 0.49%<br />
Voyeurism 1 0.12%<br />
TOTAL 821 100.00%<br />
Fondling<br />
26.32%<br />
Exposure to Adult Sexuality<br />
16.20%<br />
Total of all Categories<br />
Under 3%<br />
12.42% Other<br />
12.06%<br />
Digital Vaginal Penetration<br />
6.33%<br />
Oral/Genital Contact<br />
9.26%<br />
Vaginal Penetration through Intercourse<br />
8.40%<br />
Age Inappropriate Sexual Behavior<br />
9.01%<br />
Source: OKDHS Child Welfare Services<br />
16<br />
SUBSTANTIATIONS
<strong>CHILD</strong> CATEGORIES<br />
The chart below shows the age categories of child victims.<br />
NOTE: These numbers reflect a duplicated count of children substantiated to be victims of<br />
child abuse and neglect.<br />
Substantiated Child Abuse and Neglect by Age of Child<br />
State Fiscal Year 2012<br />
Age Count Percent<br />
Under 1 Year 1,498 15.22%<br />
1-2 Years 1,630 16.56%<br />
3-6 Years 2,849 28.95%<br />
7-11 Years 2,271 23.07%<br />
12 Years and Older 1,594 16.20%<br />
TOTAL 9,842 100.00%<br />
1-2 Years<br />
16.56%<br />
Under 1 Year<br />
15.22%<br />
3-6 Years<br />
28.95%<br />
12 Years and Older<br />
16.20%<br />
7-11 Years<br />
23.07%<br />
Source: OKDHS Child Welfare Services<br />
<strong>CHILD</strong> CATEGORIES 17
<strong>CHILD</strong> CATEGORIES<br />
As indicated in the chart below, slightly more females are abused and neglected than males.<br />
NOTE: These numbers reflect a duplicated count of children substantiated to be victims of<br />
child abuse and neglect.<br />
Substantiated Child Abuse and Neglect by Gender of Child<br />
State Fiscal Year 2012<br />
Gender Count Percent<br />
Female 5,029 51.10%<br />
Male 4,813 48.90%<br />
TOTAL 9,842 100.00%<br />
Male<br />
48.90%<br />
Female<br />
51.10%<br />
Source: OKDHS Child Welfare Services<br />
18<br />
<strong>CHILD</strong> CATEGORIES
<strong>CHILD</strong> CATEGORIES<br />
The race of children in substantiated reports of child abuse or neglect is shown below. White<br />
children continue to have the highest rate of victimization. However, white children are victimized<br />
at a lower rate than their representation in the general population while American Indian/Alaskan<br />
Native and Black/African American children are victimized at a higher rate than their representation<br />
in the general population.<br />
NOTE: These numbers reflect a duplicated count of children substantiated to be victims of<br />
child abuse and neglect.<br />
Substantiated Child Abuse and Neglect by Race of Child<br />
State Fiscal Year 2012<br />
Race Count Percent<br />
White 6,417 65.20%<br />
American Indian/Alaskan Native 1,723 17.51%<br />
Black/African American 1,630 16.56%<br />
Native Hawaiian/Other Pacific Islander 45 0.46%<br />
Asian 27 0.27%<br />
TOTAL 9,842 100.00%<br />
White<br />
65.20%<br />
Asian<br />
0.27%<br />
Native Hawaiian/Other<br />
Pacific Islander<br />
0.46%<br />
Black/African American<br />
16.56%<br />
American Indian/Alaskan Native<br />
17.51%<br />
Source: OKDHS Child Welfare Services<br />
<strong>CHILD</strong> CATEGORIES 19
PERPETRATORS<br />
The relationship of the perpetrator to the child victim in substantiated incidents of abuse and neglect is<br />
shown on the chart below. Mothers are identified as perpetrators more often than fathers.<br />
NOTE: In some incidents of substantiated child abuse and neglect, more than one perpetrator<br />
is identified so the chart reflects information on both primary and secondary perpetrator.<br />
Substantiated Child Abuse and Neglect, Alleged Perpetrator<br />
By Relationship to Child State Fiscal Year 2012<br />
Category Count Percent<br />
Category<br />
Count<br />
Percent<br />
Mother 7,991 47.14%<br />
Father 5,338 31.48%<br />
No Relation 1,170 6.90%<br />
Stepparent 918 5.41%<br />
Grandparent 515 3.04%<br />
Adoptive Parent 294 1.73%<br />
Foster Parent 136 0.80%<br />
Other Relative 127 0.75%<br />
Custodian/Guardian 124 0.73%<br />
Uncle/Aunt 109 0.64%<br />
Unknown 70 0.41%<br />
Child Care Center Employee 61 0.36%<br />
Live-In Friend of Parent 59 0.35%<br />
Child Care Home Provider 44 0.26%<br />
TOTAL 16,956 100.00%<br />
Mother<br />
47.14%<br />
Total of all Categories<br />
Under 3%<br />
6.03%<br />
Father<br />
31.48%<br />
Grandparent<br />
3.04%<br />
Stepparent<br />
5.41%<br />
No Relation<br />
6.90%<br />
Source: OKDHS Child Welfare Services<br />
20<br />
PERPETRATORS
PERPETRATORS<br />
The race of the identified perpetrators of substantiated abuse or neglect is shown below.<br />
NOTE: In some incidents of substantiated child abuse and neglect, more than one perpetrator<br />
is identified so the chart reflects information on both primary and secondary perpetrators.<br />
Substantiated Child Abuse and Neglect by Race of Perpetrator<br />
State Fiscal Year 2012<br />
Race Count Percent<br />
White 12,135 71.56%<br />
Black/African American 2,567 15.13%<br />
American Indian/Alaskan Native 2,078 12.26%<br />
Native Hawaiian/Other Pacific Islander 74 0.44%<br />
Unable to Determine 62 0.37%<br />
Asian 40 0.24%<br />
TOTAL 16,956 100.00%<br />
American Indian/Alaskan Native<br />
12.26%<br />
Black/African American<br />
15.13% Native Hawaiian/Other<br />
Pacific Islander<br />
0.44%<br />
White<br />
71.56%<br />
Unable to Determine<br />
0.37%<br />
Asian<br />
0.24%<br />
Source: OKDHS Child Welfare Services<br />
PERPETRATORS 21
PERPETRATORS<br />
The chart below shows the gender of identified perpetrators. As in previous years, females are<br />
more frequently the identified perpetrators.<br />
NOTE: In some incidents of substantiated child abuse and neglect, more than one perpetrator<br />
is identified so the chart reflects information on both primary and secondary perpetrators.<br />
Substantiated Child Abuse and Neglect by Gender of Perpetrator<br />
State Fiscal Year 2012<br />
Gender Count Percent<br />
Female 9,289 54.78%<br />
Male 7,667 45.22%<br />
TOTAL 16,956 100.00%<br />
Male<br />
45.22%<br />
Female<br />
54.78%<br />
Source: OKDHS Child Welfare Services<br />
22<br />
PERPETRATORS
PERPETRATORS<br />
The age range of identified perpetrators is shown below.<br />
NOTE: In some incidents of substantiated child abuse and neglect, more than one perpetrator<br />
is identified so the chart reflects information on both primary and secondary perpetrators.<br />
Substantiated Child Abuse and Neglect by Age of Perpetrator<br />
State Fiscal Year 2012<br />
Age Count Percent<br />
Under 18 Years 356 2.10%<br />
18-21 Years 1,139 6.72%<br />
22-25 Years 2,677 15.79%<br />
26-30 Years 4,228 24.94%<br />
31 Years and Older 8,556 50.45%<br />
TOTAL 16,956 100.00%<br />
26-30 Years<br />
24.94%<br />
31 Years and Older<br />
50.45%<br />
22-25 Years<br />
15.79%<br />
18-21 Years<br />
6.72%<br />
Under 18 Years<br />
2.10%<br />
Source: OKDHS Child Welfare Services<br />
PERPETRATORS 23
SUMMARY<br />
Findings of Investigations and Assessment Conclusions by County<br />
State Fiscal Year 2012<br />
Investigated/Assessed Substantiated Other<br />
County Abuse Negl. Both Total Abuse Negl. Both Total<br />
Svcs.<br />
Rec.<br />
Svcs.<br />
Prv.<br />
Svcs.<br />
Not<br />
Needed<br />
Other<br />
State Totals 13,634 21,938 8,660 44,232 3,241 4,312 2,289 9,842 14,645 6,823 10,649 2,273 10,202 22%<br />
Adair 100 88 71 259 31 14 26 71 19 0 162 7 6 27%<br />
Alfalfa 21 35 7 63 5 1 1 7 18 10 28 0 10 11%<br />
Atoka 103 160 64 327 37 8 16 61 118 61 83 4 67 19%<br />
Beaver 5 11 3 19 2 6 0 8 4 6 1 0 6 42%<br />
Beckham 104 142 98 344 42 25 33 100 103 61 73 7 70 29%<br />
Blaine 61 97 36 194 25 24 3 52 48 35 53 6 46 27%<br />
Bryan 147 307 146 600 61 65 40 166 204 88 121 21 142 28%<br />
Caddo 104 246 92 442 14 32 11 57 170 79 119 17 145 13%<br />
Canadian 328 545 217 1,090 129 186 80 395 322 109 178 86 176 36%<br />
Carter 225 375 124 724 67 103 31 201 202 103 202 16 128 28%<br />
Cherokee 178 354 109 641 32 28 13 73 276 137 147 8 244 11%<br />
Choctaw 79 127 64 270 24 33 16 73 38 67 88 4 73 27%<br />
Cimarron 7 1 1 9 0 1 0 1 4 4 0 0 4 11%<br />
Cleveland 692 1,123 410 2,225 71 132 47 250 954 419 530 72 571 11%<br />
Coal 55 83 32 170 22 12 4 38 97 14 21 0 21 22%<br />
Comanche 527 858 212 1,597 94 165 42 301 438 231 575 52 347 19%<br />
Cotton 27 54 21 102 17 14 5 36 31 13 22 0 19 35%<br />
Craig 40 111 51 202 5 19 14 38 62 52 40 10 79 19%<br />
Creek 292 398 146 836 96 91 30 217 298 124 134 63 170 26%<br />
Custer 98 168 85 351 36 21 27 84 122 49 94 2 111 24%<br />
Delaware 179 241 98 518 25 34 19 78 117 66 252 5 85 15%<br />
Dewey 3 9 6 18 0 0 0 0 9 5 4 0 5 0%<br />
Ellis 7 12 2 21 0 6 1 7 13 0 1 0 0 33%<br />
Garfield 208 326 131 665 37 42 14 93 158 117 254 43 135 14%<br />
Garvin 75 155 56 286 25 32 9 66 109 37 72 2 74 23%<br />
Grady 123 228 106 457 29 35 17 81 111 31 225 9 93 18%<br />
Grant 18 15 2 35 1 7 0 8 10 2 15 0 2 23%<br />
Greer 38 89 27 154 21 16 9 46 65 10 32 1 24 30%<br />
Harmon 26 17 6 49 11 4 3 18 14 8 9 0 12 37%<br />
Harper 6 6 2 14 2 0 0 2 7 3 1 1 3 14%<br />
Haskell 55 74 22 151 17 18 5 40 32 9 67 3 21 26%<br />
Hughes 72 107 59 238 28 20 18 66 72 30 63 7 49 28%<br />
Jackson 101 181 46 328 28 38 6 72 148 48 54 6 68 22%<br />
Jefferson 32 36 10 78 3 9 5 17 28 7 20 6 20 22%<br />
Johnston 55 116 23 194 7 16 5 28 61 30 75 0 37 14%<br />
Kay 152 157 99 408 29 35 23 87 114 61 122 24 78 21%<br />
Kingfisher 29 28 22 79 13 5 2 20 21 15 23 0 19 25%<br />
Kiowa 39 63 13 115 8 10 0 18 16 20 54 7 24 16%<br />
Assessment<br />
Conclusions<br />
Conf.<br />
Rate<br />
Sub-<br />
stan-<br />
tiated<br />
24<br />
SUMMARY
Investigated/Assessed Substantiated Other<br />
County Abuse Negl. Both Total Abuse Negl. Both Total<br />
Svcs.<br />
Rec.<br />
Svcs.<br />
Prv.<br />
Svcs.<br />
Not<br />
Needed<br />
Other<br />
Latimer 43 45 22 110 14 5 2 21 28 27 29 5 28 19%<br />
LeFlore 244 291 89 624 70 50 18 138 193 22 244 27 91 22%<br />
Lincoln 135 161 113 409 30 46 36 112 142 53 86 16 70 27%<br />
Logan 145 188 75 408 41 34 24 99 182 49 61 17 98 24%<br />
Love 23 52 14 89 9 11 4 24 19 2 44 0 2 27%<br />
Major 17 35 20 72 13 4 3 20 15 17 18 2 19 28%<br />
Marshall 78 107 41 226 19 21 9 49 68 37 70 2 39 22%<br />
Mayes 110 211 43 364 13 41 17 71 68 46 168 11 66 20%<br />
McClain 71 162 58 291 14 41 18 73 100 38 73 7 66 25%<br />
McCurtain 183 247 132 562 24 41 34 99 244 90 126 3 234 18%<br />
McIntosh 64 140 45 249 23 25 13 61 73 65 47 3 83 24%<br />
Murray 53 52 10 115 5 9 0 14 24 19 51 7 21 12%<br />
Muskogee 342 582 217 1,141 98 183 62 343 233 104 434 27 190 30%<br />
Noble 38 77 39 154 9 11 17 37 31 26 48 12 31 24%<br />
Nowata 36 77 29 142 3 19 2 24 43 25 44 6 33 17%<br />
Okfuskee 45 88 27 160 18 27 8 53 47 26 30 4 28 33%<br />
<strong>Oklahoma</strong> 2,619 4,648 1,969 9,236 597 1,013 748 2,358 3,001 1,236 1,790 851 1,883 26%<br />
Okmulgee 151 226 96 473 57 56 21 134 179 81 74 5 98 28%<br />
Osage 159 243 95 497 42 50 45 137 91 128 123 18 148 28%<br />
Ottawa 141 259 82 482 14 16 9 39 148 108 150 37 229 8%<br />
Pawnee 55 93 31 179 13 21 6 40 63 21 52 3 27 22%<br />
Payne 190 237 164 591 92 40 25 157 226 97 101 10 105 27%<br />
Pittsburg 263 370 199 832 46 75 56 177 288 88 228 51 117 21%<br />
Pontotoc 147 212 89 448 47 37 15 99 135 77 115 22 134 22%<br />
Pottawatomie 405 609 219 1,233 95 101 52 248 538 189 218 40 313 20%<br />
Pushmataha 60 89 30 179 19 13 7 39 35 11 87 7 26 22%<br />
Rogers 191 240 109 540 51 29 17 97 217 106 114 6 201 18%<br />
Roger Mills 4 9 2 15 1 1 0 2 6 3 3 1 3 13%<br />
Seminole 148 173 109 430 59 45 25 129 148 29 118 6 85 30%<br />
Sequoyah 199 333 141 673 46 45 43 134 267 48 210 14 146 20%<br />
Stephens 160 267 93 520 24 52 16 92 129 66 203 30 93 18%<br />
Texas 49 92 35 176 23 22 7 52 52 38 30 4 52 30%<br />
Tillman 21 28 2 51 1 3 0 4 24 4 19 0 6 8%<br />
Tulsa 2,162 3,237 1,182 6,581 421 626 278 1,325 2,536 1,310 966 444 1,752 20%<br />
Wagoner 162 300 133 595 22 74 23 119 154 84 192 46 122 20%<br />
Washington 84 323 71 478 17 77 29 123 75 166 98 16 227 26%<br />
Washita 58 75 17 150 9 3 1 13 36 32 60 9 45 9%<br />
Woods 56 47 30 133 24 7 3 34 38 25 34 2 28 26%<br />
Woodward 112 170 69 351 24 31 21 76 116 69 77 13 79 22%<br />
All figures provide a duplicated count of children. Other category includes findings of Unable to Locate and Failure to Cooperate.<br />
SUMMARY 25<br />
Assessment<br />
Conclusions<br />
Conf.<br />
Rate<br />
Sub-<br />
stan-<br />
tiated
SUMMARY<br />
Findings of Investigations by County<br />
State Fiscal Year 2012<br />
County<br />
Alleged Child<br />
Victims<br />
Substantiated<br />
Court Intervation<br />
Recommended<br />
Substantiated<br />
Services<br />
Recommended<br />
Services<br />
Recommended<br />
Services<br />
Not Need<br />
Other<br />
State Total 34,030 5,755 4,087 12,224 10,649 1,315<br />
Adair 253 55 16 16 162 4<br />
Alfalfa 53 5 2 18 28 0<br />
Atoka 260 25 36 115 83 1<br />
Beaver 13 0 8 4 1 0<br />
Beckham 274 72 28 98 73 3<br />
Blaine 148 28 24 41 53 2<br />
Bryan 458 102 64 165 121 6<br />
Caddo 297 27 30 116 119 5<br />
Canadian 914 271 124 289 178 52<br />
Carter 596 91 110 181 202 12<br />
Cherokee 397 44 29 172 147 5<br />
Choctaw 197 41 32 33 88 3<br />
Cimarron 5 1 0 4 0 0<br />
Cleveland 1,654 115 135 819 530 55<br />
Coal 149 22 16 90 21 0<br />
Comanche 1,250 148 153 340 575 34<br />
Cotton 83 11 25 25 22 0<br />
Craig 123 19 19 40 40 5<br />
Creek 666 130 87 287 134 28<br />
Custer 240 45 39 61 94 1<br />
Delaware 433 60 18 102 252 1<br />
Dewey 13 0 0 9 4 0<br />
Ellis 21 2 5 13 1 0<br />
Garfield 530 50 43 153 254 30<br />
Garvin 212 42 24 74 72 0<br />
Grady 364 49 32 51 225 7<br />
Grant 33 4 4 10 15 0<br />
Greer 130 23 23 51 32 1<br />
Harmon 37 12 6 10 9 0<br />
Harper 11 0 2 7 1 1<br />
Haskell 130 26 14 23 67 0<br />
Hughes 189 49 17 58 63 2<br />
Jackson 260 29 43 130 54 4<br />
Jefferson 58 8 9 17 20 4<br />
Johnston 157 17 11 54 75 0<br />
Kay 330 45 42 109 122 12<br />
Kingfisher 60 10 10 17 23 0<br />
Kiowa 91 4 14 15 54 4<br />
26<br />
SUMMARY
County<br />
Alleged Child<br />
Victims<br />
Substantiated<br />
Court Intervation<br />
Recommended<br />
Substantiated<br />
Services<br />
Recommended<br />
Services<br />
Recommended<br />
Services<br />
Not Need<br />
Other<br />
Latimer 82 9 12 27 29 5<br />
LeFlore 533 84 54 138 244 13<br />
Lincoln 339 76 36 129 86 12<br />
Logan 310 67 32 140 61 10<br />
Love 87 16 8 19 44 0<br />
Major 53 10 10 15 18 0<br />
Marshall 187 22 27 68 70 0<br />
Mayes 298 37 34 48 168 11<br />
McClain 225 31 42 73 73 6<br />
McCurtain 328 61 38 102 126 1<br />
McIntosh 166 37 24 57 47 1<br />
Murray 94 8 6 23 51 6<br />
Muskogee 951 277 66 159 434 15<br />
Noble 123 21 16 28 48 10<br />
Nowata 109 17 7 40 44 1<br />
Okfuskee 132 40 13 47 30 2<br />
<strong>Oklahoma</strong> 7,353 1,386 972 2,673 1,790 532<br />
Okmulgee 375 102 32 166 74 1<br />
Osage 349 62 75 83 123 6<br />
Ottawa 253 32 7 52 150 12<br />
Pawnee 152 10 30 57 52 3<br />
Payne 486 108 49 226 101 2<br />
Pittsburg 715 113 64 276 228 34<br />
Pontotoc 314 62 37 90 115 10<br />
Pottawatomie 920 174 74 437 218 17<br />
Pushmataha 153 28 11 25 87 2<br />
Rogers 339 55 42 123 114 5<br />
Roger Mills 12 0 2 6 3 1<br />
Seminole 345 86 43 96 118 2<br />
Sequoyah 527 65 69 174 210 9<br />
Stephens 427 50 42 112 203 20<br />
Texas 124 16 36 41 30 1<br />
Tillman 45 3 1 22 19 0<br />
Tulsa 4,829 732 593 2,298 966 240<br />
Wagoner 473 77 42 140 192 22<br />
Washington 251 53 70 25 98 5<br />
Washita 105 4 9 29 60 3<br />
Woods 105 11 23 37 34 0<br />
Woodward 272 31 45 106 77 13<br />
All figures provide a duplicated count of children. Other Findings includes Unable to Locate, Failure to Cooperate and Findings with No Disposition.<br />
SUMMARY 27
SUMMARY<br />
Conclusions of Assessment by County<br />
State Fiscal Year 2012<br />
County<br />
Alleged Child<br />
Victims<br />
Services<br />
Provied<br />
Services<br />
Recommended<br />
Services Provided<br />
and<br />
Recommended<br />
Other<br />
State Totals 10,202 3,473 2,421 3,350 958<br />
Adair 6 0 3 0 3<br />
Alfalfa 10 9 0 1 0<br />
Atoka 67 45 3 16 3<br />
Beaver 6 0 0 6 0<br />
Beckham 70 50 5 11 4<br />
Blaine 46 24 7 11 4<br />
Bryan 142 52 39 36 15<br />
Caddo 145 23 54 56 12<br />
Canadian 176 63 33 46 34<br />
Carter 128 62 21 41 4<br />
Cherokee 244 25 104 112 3<br />
Choctaw 73 60 5 7 1<br />
Cimarron 4 4 0 0 0<br />
Cleveland 571 228 135 191 17<br />
Coal 21 8 7 6 0<br />
Comanche 347 138 98 93 18<br />
Cotton 19 2 6 11 0<br />
Craig 79 16 22 36 5<br />
Creek 170 109 11 15 35<br />
Custer 111 16 61 33 1<br />
Delaware 85 43 15 23 4<br />
Dewey 5 5 0 0 0<br />
Ellis 0 0 0 0 0<br />
Garfield 135 108 5 9 13<br />
Garvin 74 4 35 33 2<br />
Grady 93 19 60 12 2<br />
Grant 2 2 0 0 0<br />
Greer 24 1 14 9 0<br />
Harmon 12 0 4 8 0<br />
Harper 3 3 0 0 0<br />
Haskell 21 4 9 5 3<br />
Hughes 49 9 14 21 5<br />
Jackson 68 31 18 17 2<br />
Jefferson 20 0 11 7 2<br />
Johnston 37 1 7 29 0<br />
Kay 78 20 5 41 12<br />
Kingfisher 19 3 4 12 0<br />
Kiowa 24 15 1 5 3<br />
28<br />
SUMMARY
County<br />
Alleged Child<br />
Victims<br />
Services<br />
Provied<br />
Services<br />
Recommended<br />
Services Provided<br />
and<br />
Recommended<br />
Other<br />
Latimer 28 8 1 19 0<br />
LeFlore 91 16 55 6 14<br />
Lincoln 70 13 13 40 4<br />
Logan 98 17 42 32 7<br />
Love 2 2 0 0 0<br />
Major 19 8 0 9 2<br />
Marshall 39 27 0 10 2<br />
Mayes 66 26 20 20 0<br />
McClain 66 17 27 21 1<br />
McCurtain 234 9 142 81 2<br />
McIntosh 83 22 16 43 2<br />
Murray 21 15 1 4 1<br />
Muskogee 190 50 74 54 12<br />
Noble 31 12 3 14 2<br />
Nowata 33 9 3 16 5<br />
Okfuskee 28 13 0 13 2<br />
<strong>Oklahoma</strong> 1,883 563 328 673 319<br />
Okmulgee 98 46 13 35 4<br />
Osage 148 55 8 73 12<br />
Ottawa 229 27 96 81 25<br />
Pawnee 27 10 6 11 0<br />
Payne 105 83 0 14 8<br />
Pittsburg 117 43 12 45 17<br />
Pontotoc 134 33 45 44 12<br />
Pottawatomie 313 36 101 153 23<br />
Pushmataha 26 6 10 5 5<br />
Rogers 201 12 94 94 1<br />
Roger Mills 3 3 0 0 0<br />
Seminole 85 15 52 14 4<br />
Sequoyah 146 15 93 33 5<br />
Stephens 93 44 17 22 10<br />
Texas 52 22 11 16 3<br />
Tillman 6 1 2 3 0<br />
Tulsa 1,752 793 238 517 204<br />
Wagoner 122 23 14 61 24<br />
Washington 227 91 50 75 11<br />
Washita 45 15 7 17 6<br />
Woods 28 20 1 5 2<br />
Woodward 79 51 10 18 0<br />
All figures provide a duplicated count of children. Other Findings includes Unable to Locate, Failure to Cooperate and Referrals with No Disposition.<br />
SUMMARY 29
Produced by the Office of Planning, Research,<br />
and Statistics and Child Welfare Services<br />
in collaboration with OKDHS Design Services.
S12091 OKDHS Issued 01/13<br />
This publication is authorized by <strong>Oklahoma</strong> Department of Human Services Director Ed Lake and printed by OKDHS in accordance with state and federal regulations at a cost of<br />
$90.00 for 50 copies. Copies have been deposited with the Publications Clearinghouse of the <strong>Oklahoma</strong> Department of Libraries.