CHILD ABUSE AND NEGLECT STATISTICS - Oklahoma ...
CHILD ABUSE AND NEGLECT STATISTICS - Oklahoma ...
CHILD ABUSE AND NEGLECT STATISTICS - Oklahoma ...

Create successful ePaper yourself
Turn your PDF publications into a flip-book with our unique Google optimized e-Paper software.
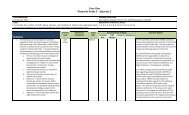
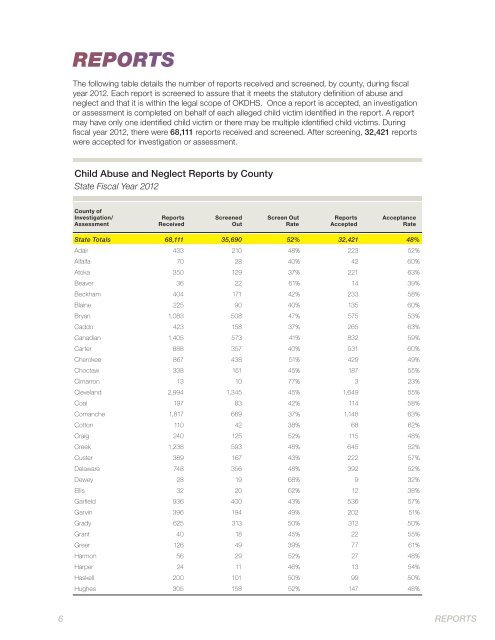
REPORTS<br />
The following table details the number of reports received and screened, by county, during fiscal<br />
year 2012. Each report is screened to assure that it meets the statutory definition of abuse and<br />
neglect and that it is within the legal scope of OKDHS. Once a report is accepted, an investigation<br />
or assessment is completed on behalf of each alleged child victim identified in the report. A report<br />
may have only one identified child victim or there may be multiple identified child victims. During<br />
fiscal year 2012, there were 68,111 reports received and screened. After screening, 32,421 reports<br />
were accepted for investigation or assessment.<br />
Child Abuse and Neglect Reports by County<br />
State Fiscal Year 2012<br />
County of<br />
Investigation/<br />
Assessment<br />
Reports<br />
Received<br />
Screened<br />
Out<br />
Screen Out<br />
Rate<br />
Reports<br />
Accepted<br />
Acceptance<br />
Rate<br />
State Totals 68,111 35,690 52% 32,421 48%<br />
Adair 433 210 48% 223 52%<br />
Alfalfa 70 28 40% 42 60%<br />
Atoka 350 129 37% 221 63%<br />
Beaver 36 22 61% 14 39%<br />
Beckham 404 171 42% 233 58%<br />
Blaine 225 90 40% 135 60%<br />
Bryan 1,083 508 47% 575 53%<br />
Caddo 423 158 37% 265 63%<br />
Canadian 1,405 573 41% 832 59%<br />
Carter 888 357 40% 531 60%<br />
Cherokee 867 438 51% 429 49%<br />
Choctaw 338 151 45% 187 55%<br />
Cimarron 13 10 77% 3 23%<br />
Cleveland 2,994 1,345 45% 1,649 55%<br />
Coal 197 83 42% 114 58%<br />
Comanche 1,817 669 37% 1,148 63%<br />
Cotton 110 42 38% 68 62%<br />
Craig 240 125 52% 115 48%<br />
Creek 1,238 593 48% 645 52%<br />
Custer 389 167 43% 222 57%<br />
Delaware 748 356 48% 392 52%<br />
Dewey 28 19 68% 9 32%<br />
Ellis 32 20 62% 12 38%<br />
Garfield 936 400 43% 536 57%<br />
Garvin 396 194 49% 202 51%<br />
Grady 625 313 50% 312 50%<br />
Grant 40 18 45% 22 55%<br />
Greer 126 49 39% 77 61%<br />
Harmon 56 29 52% 27 48%<br />
Harper 24 11 46% 13 54%<br />
Haskell 200 101 50% 99 50%<br />
Hughes 305 158 52% 147 48%<br />
6<br />
REPORTS