JARC Coordination Plan - Oklahoma Department of Transportation
JARC Coordination Plan - Oklahoma Department of Transportation
JARC Coordination Plan - Oklahoma Department of Transportation

You also want an ePaper? Increase the reach of your titles
YUMPU automatically turns print PDFs into web optimized ePapers that Google loves.
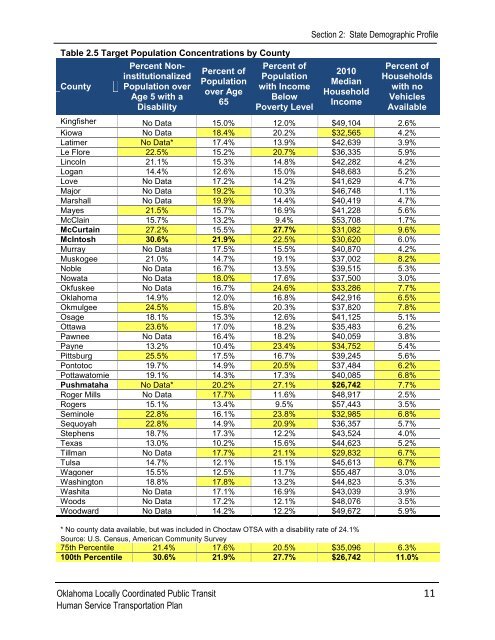
Section 2: State Demographic Pr<strong>of</strong>ile<br />
Table 2.5 Target Population Concentrations by County<br />
County<br />
Percent Noninstitutionalized<br />
Population over<br />
Age 5 with a<br />
Disability<br />
Percent <strong>of</strong><br />
Population<br />
over Age<br />
65<br />
Percent <strong>of</strong><br />
Population<br />
with Income<br />
Below<br />
Poverty Level<br />
2010<br />
Median<br />
Household<br />
Income<br />
Percent <strong>of</strong><br />
Households<br />
with no<br />
Vehicles<br />
Available<br />
Kingfisher No Data 15.0% 12.0% $49,104 2.6%<br />
Kiowa No Data 18.4% 20.2% $32,565 4.2%<br />
Latimer No Data* 17.4% 13.9% $42,639 3.9%<br />
Le Flore 22.5% 15.2% 20.7% $36,335 5.9%<br />
Lincoln 21.1% 15.3% 14.8% $42,282 4.2%<br />
Logan 14.4% 12.6% 15.0% $48,683 5.2%<br />
Love No Data 17.2% 14.2% $41,629 4.7%<br />
Major No Data 19.2% 10.3% $46,748 1.1%<br />
Marshall No Data 19.9% 14.4% $40,419 4.7%<br />
Mayes 21.5% 15.7% 16.9% $41,228 5.6%<br />
McClain 15.7% 13.2% 9.4% $53,708 1.7%<br />
McCurtain 27.2% 15.5% 27.7% $31,082 9.6%<br />
McIntosh 30.6% 21.9% 22.5% $30,620 6.0%<br />
Murray No Data 17.5% 15.5% $40,870 4.2%<br />
Muskogee 21.0% 14.7% 19.1% $37,002 8.2%<br />
Noble No Data 16.7% 13.5% $39,515 5.3%<br />
Nowata No Data 18.0% 17.6% $37,500 3.0%<br />
Okfuskee No Data 16.7% 24.6% $33,286 7.7%<br />
<strong>Oklahoma</strong> 14.9% 12.0% 16.8% $42,916 6.5%<br />
Okmulgee 24.5% 15.8% 20.3% $37,820 7.8%<br />
Osage 18.1% 15.3% 12.6% $41,125 5.1%<br />
Ottawa 23.6% 17.0% 18.2% $35,483 6.2%<br />
Pawnee No Data 16.4% 18.2% $40,059 3.8%<br />
Payne 13.2% 10.4% 23.4% $34,752 5.4%<br />
Pittsburg 25.5% 17.5% 16.7% $39,245 5.6%<br />
Pontotoc 19.7% 14.9% 20.5% $37,484 6.2%<br />
Pottawatomie 19.1% 14.3% 17.3% $40,085 6.8%<br />
Pushmataha No Data* 20.2% 27.1% $26,742 7.7%<br />
Roger Mills No Data 17.7% 11.6% $48,917 2.5%<br />
Rogers 15.1% 13.4% 9.5% $57,443 3.5%<br />
Seminole 22.8% 16.1% 23.8% $32,985 6.8%<br />
Sequoyah 22.8% 14.9% 20.9% $36,357 5.7%<br />
Stephens 18.7% 17.3% 12.2% $43,524 4.0%<br />
Texas 13.0% 10.2% 15.6% $44,623 5.2%<br />
Tillman No Data 17.7% 21.1% $29,832 6.7%<br />
Tulsa 14.7% 12.1% 15.1% $45,613 6.7%<br />
Wagoner 15.5% 12.5% 11.7% $55,487 3.0%<br />
Washington 18.8% 17.8% 13.2% $44,823 5.3%<br />
Washita No Data 17.1% 16.9% $43,039 3.9%<br />
Woods No Data 17.2% 12.1% $48,076 3.5%<br />
Woodward No Data 14.2% 12.2% $49,672 5.9%<br />
* No county data available, but was included in Choctaw OTSA with a disability rate <strong>of</strong> 24.1%<br />
Source: U.S. Census, American Community Survey<br />
75th Percentile 21.4% 17.6% 20.5% $35,096 6.3%<br />
100th Percentile 30.6% 21.9% 27.7% $26,742 11.0%<br />
<strong>Oklahoma</strong> Locally Coordinated Public Transit 11<br />
Human Service <strong>Transportation</strong> <strong>Plan</strong>