Oklahoma Statewide Freight and Passenger Rail Plan
Oklahoma Statewide Freight and Passenger Rail Plan
Oklahoma Statewide Freight and Passenger Rail Plan

Create successful ePaper yourself
Turn your PDF publications into a flip-book with our unique Google optimized e-Paper software.
<strong>Oklahoma</strong><br />
Department of<br />
Transportation<br />
May 2012<br />
OKLAHOMA<br />
STATEWIDE FREIGHT &<br />
PASSENGER RAIL PLAN<br />
<strong>Oklahoma</strong> <strong>Statewide</strong> <strong>Freight</strong> <strong>and</strong> <strong>Passenger</strong> <strong>Rail</strong> <strong>Plan</strong>
<strong>Oklahoma</strong> <strong>Statewide</strong> <strong>Freight</strong><br />
<strong>and</strong> <strong>Passenger</strong> <strong>Rail</strong> <strong>Plan</strong><br />
OKLAHOMA<br />
STATEWIDE FREIGHT<br />
&<br />
PASSENGER RAIL PLAN<br />
PREPARED FOR:<br />
<strong>Oklahoma</strong><br />
Department of Transportation<br />
PREPARED BY:<br />
May 2012<br />
i
Foreword<br />
Foreword<br />
The <strong>Oklahoma</strong> <strong>Statewide</strong> <strong>Freight</strong> <strong>and</strong> <strong>Passenger</strong> <strong>Rail</strong> <strong>Plan</strong> is the result of a full year of<br />
research <strong>and</strong> study. While the plan meets congressionally stipulated requirements, it<br />
evolved beyond that basic purpose with input from a large cross-section of stakeholders<br />
<strong>and</strong> parties interested in improving rail transportation in the state of <strong>Oklahoma</strong>. The input<br />
was obtained through public forums, a website, targeted group meetings of stakeholders,<br />
<strong>and</strong> interviews.<br />
The public <strong>and</strong> targeted group meetings were held both locally <strong>and</strong> regionally to afford<br />
interested parties an opportunity to learn about the planning process <strong>and</strong> to provide their<br />
perspectives on rail issues facing the state. Public outreach meetings were held in the following<br />
locations:<br />
• Enid<br />
• Lawton<br />
• McAlester<br />
• <strong>Oklahoma</strong> City<br />
• Tulsa<br />
A workshop for rail stakeholders <strong>and</strong> an open house for the general public were held at<br />
each location.<br />
In-depth interviews <strong>and</strong> meetings were also held with representatives of the following:<br />
• ACOG<br />
• BNSF<br />
• Farmrail<br />
• INCOG<br />
• Mid-America Industrial Park<br />
• <strong>Oklahoma</strong> Department of Commerce<br />
• <strong>Oklahoma</strong> Department of Agriculture<br />
Commodities Group<br />
• <strong>Oklahoma</strong> History Museum<br />
• <strong>Oklahoma</strong> Trucking Association<br />
• Port of Muskogee<br />
• Tinker Air Force Base<br />
• WATCO<br />
• Ardmore Industrial Authority<br />
• Dolese Brothers Company<br />
• Heartl<strong>and</strong> Flyer Coalition<br />
• McAlester Army Ammunition Depot<br />
• State Chamber of <strong>Oklahoma</strong><br />
• Office of the Secretary of Energy<br />
• <strong>Oklahoma</strong> Department of Agriculture<br />
senior staff<br />
• <strong>Oklahoma</strong> State <strong>Rail</strong> Association<br />
• Port of Catoosa<br />
• Representative Morrissette<br />
• Union Pacific <strong>Rail</strong>road<br />
• Wheat Growers Association<br />
The participants at these meetings shared their perspectives on rail problems <strong>and</strong> needed<br />
improvements in the state. In addition, all of the railroads operating in <strong>Oklahoma</strong> provided<br />
surveys detailing their infrastructure <strong>and</strong> business in the state.<br />
May 2012<br />
iii
Forward<br />
Following the public release of the draft<br />
plan, the public was afforded the opportunity<br />
to comment on the plan through the<br />
public library system <strong>and</strong> over the internet.<br />
A significant portion of comments received<br />
were included or directly addressed<br />
in the final document. The remainder<br />
were either not addressable or were expressions<br />
of opinions beyond the scope of this<br />
plan. The comment form made available is<br />
shown here.<br />
Stakeholder meeting<br />
Public Open House<br />
iv<br />
<strong>Oklahoma</strong> <strong>Statewide</strong> <strong>Freight</strong> <strong>and</strong> <strong>Passenger</strong> <strong>Rail</strong> <strong>Plan</strong>
Table of Contents<br />
Table of Contents<br />
Acronyms <strong>and</strong> Abbreviations<br />
Executive Summary<br />
xi<br />
ES-1<br />
1. Background 1-1<br />
2. The <strong>Rail</strong>road Industry 2-1<br />
<strong>Freight</strong> <strong>Rail</strong> 2-1<br />
<strong>Passenger</strong> <strong>Rail</strong> 2-4<br />
3. <strong>Oklahoma</strong> <strong>Freight</strong> <strong>Rail</strong>roads 3-1<br />
Class I <strong>Rail</strong>roads 3-1<br />
Class III <strong>Rail</strong>roads 3-5<br />
Role of the State of <strong>Oklahoma</strong> 3-5<br />
<strong>Rail</strong>road Profiles 3-5<br />
4. History of <strong>Rail</strong>road Development in <strong>Oklahoma</strong> 4-1<br />
The Early Years—Development of <strong>Oklahoma</strong>’s <strong>Rail</strong> Network 4-2<br />
Reshaping of <strong>Oklahoma</strong>’s <strong>Rail</strong>roads 4-4<br />
Role of <strong>Oklahoma</strong> Department of Transportation in<br />
<strong>Rail</strong> Restructuring 4-5<br />
5. <strong>Rail</strong> Transportation’s Role in the <strong>Oklahoma</strong> Transportation Network 5-1<br />
The Role of <strong>Freight</strong> <strong>Rail</strong> in the <strong>Oklahoma</strong><br />
Transportation Network 5-1<br />
The Role of <strong>Passenger</strong> <strong>Rail</strong> in the <strong>Oklahoma</strong><br />
Transportation Network 5-2<br />
6. Impacts of <strong>Rail</strong> Transportation 6-1<br />
Impact on the Environment 6-1<br />
Energy Impacts 6-2<br />
Quality of Life Impacts 6-3<br />
May 2012<br />
v
Table of Contents<br />
7. Relationship of <strong>Oklahoma</strong>’s <strong>Freight</strong> <strong>Rail</strong> System to the<br />
<strong>Oklahoma</strong> Economy 7-1<br />
Defining <strong>and</strong> Measuring <strong>Freight</strong> <strong>Rail</strong> Importance 7-1<br />
<strong>Oklahoma</strong>’s Economy <strong>and</strong> Key Industry Groups 7-3<br />
Key Industry Groups 7-6<br />
<strong>Freight</strong> <strong>Rail</strong> Employment, Earnings, <strong>and</strong> Multiplier Effects 7-15<br />
<strong>Oklahoma</strong> <strong>Rail</strong> Commodity Flows 7-16<br />
8. Overview of <strong>Oklahoma</strong> <strong>Rail</strong> Legislation 8-1<br />
<strong>Oklahoma</strong> <strong>Rail</strong> Legislation History 8-1<br />
Public-Private Partnership Law 8-10<br />
9. <strong>Oklahoma</strong> Department of Transportation <strong>Rail</strong> Programs 9-1<br />
<strong>Rail</strong> Programs Division 9-1<br />
ODOT Highway-<strong>Rail</strong> Crossing Inventory <strong>and</strong> Project<br />
Management Tools 9-4<br />
OK.RAIL System 9-5<br />
School Bus Inventory Data 9-8<br />
<strong>Oklahoma</strong> Highway-<strong>Rail</strong> Crossing Crash Data 9-10<br />
ODOT Graphical Resource Intranet Portal Database 9-10<br />
State-owned <strong>Rail</strong> Infrastructure Inventory 9-12<br />
ODOT <strong>Rail</strong> Programs Division Reports 9-13<br />
10. Multimodal <strong>Freight</strong> Transportation in <strong>Oklahoma</strong> 10-1<br />
<strong>Rail</strong> Intermodal Transportation 10-1<br />
Major Industrial Parks/Logistics Centers 10-9<br />
Port Facilities 10-14<br />
Marine Trends 10-20<br />
<strong>Rail</strong> Expansion Opportunities for the Ports 10-22<br />
Foreign Trade Zones 10-23<br />
11. <strong>Oklahoma</strong> <strong>Passenger</strong> <strong>Rail</strong> 11-1<br />
History 11-1<br />
Overview of Current <strong>Rail</strong> <strong>Passenger</strong> Operations 11-3<br />
The Heartl<strong>and</strong> Flyer 11-4<br />
Other <strong>Rail</strong> <strong>Passenger</strong> Operations 11-22<br />
12. Multimodal Connectivity—<strong>Passenger</strong> 12-1<br />
Intercity <strong>Rail</strong> Connections 12-1<br />
Commuter <strong>Rail</strong> Connections 12-2<br />
Intercity Bus Connections 12-2<br />
vi<br />
<strong>Oklahoma</strong> <strong>Statewide</strong> <strong>Freight</strong> <strong>and</strong> <strong>Passenger</strong> <strong>Rail</strong> <strong>Plan</strong>
Table of Contents<br />
<strong>Plan</strong>ned <strong>Passenger</strong> <strong>Rail</strong> Intermodal Improvements 12-4<br />
High-speed Intercity <strong>Passenger</strong> <strong>Rail</strong> 12-5<br />
13. Safety <strong>and</strong> Security 13-1<br />
Security 13-1<br />
Safety 13-2<br />
ODOT <strong>Rail</strong> Safety Program 13-3<br />
Other Safety <strong>and</strong> Security 13-6<br />
14. ODOT <strong>Statewide</strong> <strong>Freight</strong> <strong>and</strong> <strong>Passenger</strong> <strong>Rail</strong> <strong>Plan</strong> Vision, Goals,<br />
<strong>and</strong> Objectives 14-1<br />
Vision 14-2<br />
Goals <strong>and</strong> Objectives 14-2<br />
15. Current <strong>Rail</strong> Development Activities 15-1<br />
<strong>Oklahoma</strong> <strong>Statewide</strong> <strong>Freight</strong> <strong>and</strong> <strong>Passenger</strong> <strong>Rail</strong> <strong>Plan</strong> 15-1<br />
I-244 Multimodal Bridge in Tulsa 15-1<br />
Service Development <strong>Plan</strong> for Exp<strong>and</strong>ed <strong>Passenger</strong> <strong>Rail</strong> Service:<br />
Fort Worth–<strong>Oklahoma</strong> City–Kansas City 15-1<br />
Tulsa–<strong>Oklahoma</strong> City High-Speed <strong>Rail</strong> Corridor Investment <strong>Plan</strong> 15-1<br />
South Central HSIPR Corridor Study: <strong>Oklahoma</strong> City to South Texas 15-2<br />
<strong>Oklahoma</strong> City Amtrak Station Access Improvement 15-2<br />
Great Plains <strong>Freight</strong> <strong>Rail</strong> Project 15-2<br />
<strong>Oklahoma</strong> Rolling Pipeline <strong>Freight</strong> <strong>Rail</strong> Upgrade Project 15-2<br />
16. Strategic Initiatives 16-1<br />
Communication <strong>and</strong> Education 16-1<br />
Economic Development 16-2<br />
Funding 16-4<br />
Infrastructure <strong>and</strong> System Improvements 16-4<br />
Legislative 16-5<br />
<strong>Passenger</strong> <strong>Rail</strong> Service 16-5<br />
Safety 16-6<br />
Studies 16-6<br />
17. <strong>Rail</strong> <strong>and</strong> <strong>Rail</strong>-related Infrastructure Improvement Projects 17-1<br />
The State-owned <strong>Rail</strong> Construction <strong>and</strong> Maintenance Work <strong>Plan</strong> 17-1<br />
ODOT Construction Work <strong>Plan</strong> (Highway) 17-3<br />
Major <strong>Rail</strong>-related Issue Facing <strong>Oklahoma</strong> 17-3<br />
May 2012<br />
vii
Table of Contents<br />
18. Funding <strong>and</strong> Financing Alternatives 18-1<br />
Funding vs. Financing Programs 18-1<br />
Existing <strong>Oklahoma</strong> <strong>Rail</strong> Funding 18-1<br />
Federal Funding Programs 18-2<br />
Federal Financing Programs 18-7<br />
Future Federal Funding 18-10<br />
Figures<br />
Figure ES-1 <strong>Rail</strong> freight originating in <strong>Oklahoma</strong>, commodity distribution (by tons)<br />
ES-6<br />
Figure ES-2 <strong>Rail</strong> freight terminating in <strong>Oklahoma</strong>, commodity distribution (by tons)<br />
ES-6<br />
Figure 2-1 U.S. Class I railroads 2-2<br />
Figure 2-2 Intermodal traffic composition 2-4<br />
Figure 2-3 U.S. rail freight commodity mix (tonnage) 2-4<br />
Figure 2-4 Amtrak route system 2-5<br />
Figure 2-5 U.S. high-speed rail corridors 2-6<br />
Figure 3-1 BNSF rail system 3-2<br />
Figure 3-2 BNSF <strong>Oklahoma</strong> rail network 3-2<br />
Figure 3-3 Union Pacific rail system 3-3<br />
Figure 3-4 Union Pacific <strong>Oklahoma</strong> rail network 3-3<br />
Figure 3-5 KCS rail system 3-4<br />
Figure 3-6 KCS <strong>Oklahoma</strong> rail network 3-4<br />
Figure 3-7 BNSF <strong>Rail</strong>way (BNSF) Profile 3-6<br />
Figure 3-8 Kansas City Southern <strong>Rail</strong>way (KCS) Profile 3-7<br />
Figure 3-9 Union Pacific <strong>Rail</strong>road (UP) Profile 3-8<br />
Figure 3-10 Arkansas-<strong>Oklahoma</strong> <strong>Rail</strong>road Company (AOK) Profile 3-9<br />
Figure 3-11 AT&L <strong>Rail</strong>road (AT&L) Profile 3-10<br />
Figure 3-12 Blackwell Northern Gateway <strong>Rail</strong>road (BNGR) Profile 3-11<br />
Figure 3-13 Cimarron Valley <strong>Rail</strong>road (CVR) Profile 3-12<br />
Figure 3-14 Farmrail (FMRC) Profile 3-13<br />
Figure 3-15 Grainbelt (GNBC) Profile 3-14<br />
Figure 3-16 Kiamichi <strong>Rail</strong>road (KRR) Profile 3-15<br />
Figure 3-17 Northwestern <strong>Oklahoma</strong> (NOKL) Profile 3-16<br />
Figure 3-18 Tulsa’s Port of Caloosa (PC) Profile 3-17<br />
Figure 3-19 Port of Muskogee <strong>Rail</strong>road (PMR) Profile 3-18<br />
Figure 3-20 Public Service of <strong>Oklahoma</strong> (PSO) Profile 3-19<br />
Figure 3-21 S<strong>and</strong> Springs <strong>Rail</strong>way (SS) Profile 3-20<br />
Figure 3-22 South Kansas & <strong>Oklahoma</strong> <strong>Rail</strong>road (SKOL) Profile 3-21<br />
Figure 3-23 Stillwater Central <strong>Rail</strong>road (SLWC) Profile 3-22<br />
Figure 3-24 Texas, <strong>Oklahoma</strong> & Eastern <strong>Rail</strong>road (TOE) Profile 3-23<br />
Figure 3-25 Tulsa Sapulpa Union <strong>Rail</strong>way (TSU) Profile 3-24<br />
Figure 3-26 WFEC <strong>Rail</strong>road Company (WFEC) Profile 3-25<br />
Figure 3-27 Wichita, Tillman & Jackson <strong>Rail</strong>way (WTJR) Profile 3-26<br />
Figure 6-1 Source of greenhouse gas emissions 6-1<br />
Figure 6-2 Impact of rail on greenhouse gases 6-1<br />
Figure 6-3 <strong>Rail</strong> fuel efficiency trend 6-2<br />
viii<br />
<strong>Oklahoma</strong> <strong>Statewide</strong> <strong>Freight</strong> <strong>and</strong> <strong>Passenger</strong> <strong>Rail</strong> <strong>Plan</strong>
Table of Contents<br />
Figure 7-1 Transportation contribution to value added by major two-digit industry<br />
in cents per value added 7-2<br />
Figure 7-2 <strong>Rail</strong> freight originating in <strong>Oklahoma</strong>, commodity distribution (by tons) 7-3<br />
Figure 7-3 <strong>Rail</strong> freight terminating in <strong>Oklahoma</strong>, commodity distribution (by tons) 7-3<br />
Figure 7-4 U.S. gross domestic product <strong>and</strong> <strong>Oklahoma</strong> gross state product<br />
(real millions of chained 2005 $) 7-4<br />
Figure 7-5 Contribution to real gross state product by freight rail dependent industries 7-5<br />
Figure 7-6 Employment trends, U.S. <strong>and</strong> <strong>Oklahoma</strong> 7-5<br />
Figure 7-7 Changes in employment over the last recession 7-6<br />
Figure 7-8 Crude oil prices (real $, CPI adjusted 1982–1984 base) 7-8<br />
Figure 7-9 Oil <strong>and</strong> gas deposits across <strong>Oklahoma</strong> 7-9<br />
Figure 7-10 <strong>Oklahoma</strong> grain shuttles by rail line 7-12<br />
Figure 7-11 Strategic <strong>Rail</strong> Corridor Network 7-14<br />
Figure 7-12 <strong>Rail</strong> traffic flows on <strong>Oklahoma</strong>’s rail network 7-16<br />
Figure 7-13 Coal rail traffic flows on <strong>Oklahoma</strong>’s rail network 7-20<br />
Figure 7-14 BEA origins of <strong>Oklahoma</strong>’s inbound rail coal traffic 7-21<br />
Figure 7-15 Stone rail traffic flows on <strong>Oklahoma</strong>’s rail network 7-21<br />
Figure 7-16 BEA terminations of <strong>Oklahoma</strong>’s outbound stone, gravel, <strong>and</strong> s<strong>and</strong> rail traffic 7-22<br />
Figure 7-17 Inbound grain rail traffic flows on <strong>Oklahoma</strong>’s rail network 7-23<br />
Figure 7-18 BEA origins of <strong>Oklahoma</strong> inbound rail grain traffic 7-23<br />
Figure 7-19 Outbound grain rail traffic flows on <strong>Oklahoma</strong>’s rail network 7-24<br />
Figure 7-20 BEA terminations of <strong>Oklahoma</strong>’s outbound rail grain traffic 7-24<br />
Figure 7-21 Fertilizer rail traffic flows on <strong>Oklahoma</strong>’s rail network 7-25<br />
Figure 7-22 BEA terminations of <strong>Oklahoma</strong>’s rail fertilizer traffic 7-26<br />
Figure 7-23 BEA terminations of <strong>Oklahoma</strong>’s rail petroleum traffic 7-26<br />
Figure 7-24 Intermodal traffic flows on <strong>Oklahoma</strong>’s rail network 7-27<br />
Figure 9-1 State-owned 2012 rail mileage 9-2<br />
Figure 10-1 Bulk transload—grain elevator 10-4<br />
Figure 10-2 Dimensional transload—rail to storage yard to truck 10-4<br />
Figure 10-3 <strong>Rail</strong>-served multimodal freight facilities 10-9<br />
Figure 10-4 Ardmore Industrial Airpark 10-10<br />
Figure 10-5 Mid-America Industrial Park 10-12<br />
Figure 10-6 Clinton-Sherman Industrial Airpark 10-13<br />
Figure 10-7 McClellan-Kerr Arkansas River Navigation System 10-15<br />
Figure 10-8 Tulsa Port of Catoosa 10-16<br />
Figure 10-9 General dry cargo dock—channel view 10-18<br />
Figure 10-10 General dry cargo dock—dock view 10-18<br />
Figure 10-11 Ro-Ro low water wharf 10-19<br />
Figure 11-1 <strong>Passenger</strong> rail routes (1966) 11-2<br />
Figure 12-1 Intercity bus routes (2011) 12-3<br />
Figure 13-1 <strong>Rail</strong> safety section funding 13-4<br />
Figure 13-2 Public-involved crashes 13-4<br />
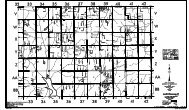
Figure 17-1 Lines with 286,000-pound deficiency 17-23<br />
May 2012<br />
ix
Table of Contents<br />
Tables<br />
Table 5-1 <strong>Oklahoma</strong> transportation infrastructure 5-1<br />
Table 5-2 <strong>Oklahoma</strong> freight mode shares in 2007 (thous<strong>and</strong> tons) 5-2<br />
Table 7-1 TSA Transportation requirements for major goods moving industries two-digit<br />
level, by mode 7-3<br />
Table 7-2 Industry contribution to real gross state product 7-4<br />
Table 7-3 <strong>Rail</strong> traffic in <strong>Oklahoma</strong> by traffic type 7-17<br />
Table 7-4 <strong>Oklahoma</strong> rail traffic through traffic commodity mix 7-17<br />
Table 7-5 <strong>Oklahoma</strong> rail traffic categories—excludes overhead traffic 7-18<br />
Table 7-6 <strong>Oklahoma</strong> inbound rail traffic—commodity mix 7-18<br />
Table 7-7 <strong>Oklahoma</strong> outbound rail traffic—commodity mix 7-19<br />
Table 7-8 <strong>Oklahoma</strong> local rail traffic—commodity mix 7-20<br />
Table 7-9 Inbound rail grain volume in <strong>Oklahoma</strong> by type of grain 7-22<br />
Table 7-10 Outbound rail grain volume in <strong>Oklahoma</strong> by type of grain 7-24<br />
Table 8-1 <strong>Oklahoma</strong> laws governing railroads—early legislation 8-2<br />
Table 8-3 <strong>Oklahoma</strong> laws governing railroads—1968–1976 Legislation 8-5<br />
Table 8-4 <strong>Oklahoma</strong> laws governing railroads—1978–1988 Legislation 8-6<br />
Table 8-5 <strong>Oklahoma</strong> laws governing railroads—1991–1999 Legislation 8-7<br />
Table 8-6 <strong>Oklahoma</strong> laws governing railroads—recent legislation 8-8<br />
Table 10-1 <strong>Oklahoma</strong> rail transload facilities 10-5<br />
Table 10-2 <strong>Oklahoma</strong> rail-served grain elevators 10-5<br />
Table 10-3 Private terminals on the MKARNS in <strong>Oklahoma</strong> 10-21<br />
Table 11-1 <strong>Oklahoma</strong> passenger trains (1966) 11-2<br />
Table 11-2 Heartl<strong>and</strong> Flyer timetable (effective November 7, 2011) 11-4<br />
Table 11-3 Amtrak connections at Fort Worth 11-10<br />
Table 11-4 Trinity <strong>Rail</strong>way Express connections at Fort Worth 11-11<br />
Table 11-5 Heartl<strong>and</strong> Flyer ridership <strong>and</strong> revenues 11-12<br />
Table 11-6 Ridership by station 11-12<br />
Table 11-7 <strong>Passenger</strong> distribution by station pairs 11-12<br />
Table 11-8 Customer satisfaction index scores 11-13<br />
Table 11-9 Heartl<strong>and</strong> Flyer total delays by cause (2010) 11-14<br />
Table 11-10 Origin <strong>and</strong> destination station distribution of passengers 11-18<br />
Table 11-11 Means of station access 11-19<br />
Table 11-12 Origin station access time 11-19<br />
Table 11-13 Access distance to origin station 11-19<br />
Table 11-14 Destination radius 11-20<br />
Table 11-15 Trip purpose 11-20<br />
Table 11-16 Diverted <strong>and</strong> induced trips 11-20<br />
Table 11-17 Trip duration 11-20<br />
Table 17-1 ODOT construction work plan—projects with railroad improvements 17-2<br />
Table 17-2 Proposed Class I railroad improvements 17-4<br />
Table 17-3 Proposed Class III railroad improvements—state-owned lines 17-9<br />
Table 17-4 Proposed Class III railroad improvements—privately owned lines 17-13<br />
Table 17-5 Proposed commuter <strong>and</strong> passenger rail improvements 17-18<br />
Table 17-6 Proposed industrial improvements 17-22<br />
Table 17-7 Proposed 286,000-pound capacity improvements 17-23<br />
x<br />
<strong>Oklahoma</strong> <strong>Statewide</strong> <strong>Freight</strong> <strong>and</strong> <strong>Passenger</strong> <strong>Rail</strong> <strong>Plan</strong>
Acronyms <strong>and</strong> Abbreviations<br />
Acronyms <strong>and</strong> Abbreviations<br />
AAR<br />
ACOG<br />
ADA<br />
AIA<br />
Amtrak<br />
AOK<br />
ARRA<br />
AT&L<br />
BEA<br />
BNGR<br />
BNSF<br />
CAGR<br />
CNG<br />
COTPA<br />
CRIP<br />
CVR<br />
DFW<br />
DPS<br />
EIS<br />
EPA<br />
FHWA<br />
FMRC<br />
FRA<br />
Frisco<br />
FTZ<br />
FY<br />
GDP<br />
GIS<br />
GNBC<br />
GRIP<br />
GSP<br />
HB<br />
HES<br />
HSIPR<br />
ICC<br />
INCOG<br />
ITC<br />
ITS<br />
Association of American <strong>Rail</strong>roads<br />
Association of Central <strong>Oklahoma</strong> Governments<br />
Ardmore Development Authority<br />
Ardmore Industrial Airpark<br />
National <strong>Rail</strong> <strong>Passenger</strong> Corporation<br />
Arkansas-<strong>Oklahoma</strong> <strong>Rail</strong>road Company<br />
American Recovery <strong>and</strong> Reinvestment Act<br />
Austin, Todd & Ladd <strong>Rail</strong>road<br />
Bureau of Economic Analysis<br />
Blackwell Northern Gateway <strong>Rail</strong>road<br />
BNSF <strong>Rail</strong>way Company<br />
compound annual growth rate<br />
compressed natural gas<br />
Central <strong>Oklahoma</strong> Transit <strong>and</strong> Parking Authority<br />
Chicago, Rock Isl<strong>and</strong> <strong>and</strong> Pacific <strong>Rail</strong>road Company<br />
Cimarron Valley <strong>Rail</strong>road<br />
Dallas-Fort Worth Airport<br />
<strong>Oklahoma</strong> Department of Public Safety<br />
environmental impact statement<br />
Environmental Protection Agency<br />
Federal Highway Administration<br />
Farmrail Corporation<br />
Federal <strong>Rail</strong>road Administration<br />
St. Louis-San Francisco <strong>Rail</strong>way<br />
foreign trade zone<br />
fiscal year<br />
gross domestic product<br />
geographic information system<br />
Grainbelt <strong>Rail</strong>road<br />
Graphical Resource Intranet Portal<br />
gross state product<br />
House Bill<br />
Hazard Elimination Safety<br />
High Speed Intercity <strong>Passenger</strong> <strong>Rail</strong> Program<br />
Interstate Commerce Commission<br />
Indian Nations Council of Governments<br />
Intermodal Transit Center<br />
Intelligent Transportation Systems<br />
May 2012<br />
xi
Acronyms <strong>and</strong> Abbreviations<br />
KCS<br />
KDOT<br />
KRR<br />
MAIP<br />
MKARNS<br />
mph<br />
MPO<br />
MTMC<br />
MUTCD<br />
NAFTA<br />
NAICS<br />
NEPA<br />
NOKL<br />
NPCU<br />
OCC<br />
Kansas City Southern <strong>Rail</strong>way<br />
Kansas Department of Transportation<br />
Kiamichi <strong>Rail</strong>road<br />
Mid-America Industrial Park<br />
McClellan-Kerr Arkansas River Navigation System<br />
miles per hour<br />
municipal planning organization<br />
Military Traffic Management Comm<strong>and</strong><br />
Manual of Uniform Traffic Control Devices<br />
North American Free Trade Act<br />
North American Industry Classification System<br />
National Environmental Policy Act<br />
Northwestern <strong>Oklahoma</strong><br />
non-powered control unit<br />
<strong>Oklahoma</strong> Corporation Commission<br />
ODOT <strong>Oklahoma</strong> Department of Transportation<br />
map-based field data collection software<br />
OK.RAIL <strong>Oklahoma</strong> Department of Transportation <strong>Rail</strong> Assessment, Inventory, <strong>and</strong> Location<br />
(<strong>Rail</strong> Programs Division’s inventory management system)<br />
P3<br />
public-private partnership<br />
PC<br />
Tulsa’s Port of Catoosa<br />
PMR Port of Muskogee <strong>Rail</strong>road<br />
PRIIA <strong>Passenger</strong> <strong>Rail</strong> Investment <strong>and</strong> Improvement Act<br />
PSO Public Service of <strong>Oklahoma</strong><br />
PTC positive train control<br />
RMRF <strong>Rail</strong>road Maintenance Revolving Fund<br />
Ro-Ro roll-on roll-off<br />
RPSA <strong>Rail</strong> <strong>Passenger</strong> Service Act of 1970<br />
RRIF <strong>Rail</strong>road Rehabilitation <strong>and</strong> Improvement Financing<br />
SAFETEA- Safe, Accountable, Efficient Transportation Equity Act—A Legacy for Users<br />
LU<br />
Santa Fe Atchison, Topeka <strong>and</strong> Santa Fe <strong>Rail</strong>way<br />
SDP service development plan<br />
SH<br />
State Highway<br />
SIB State Infrastructure Bank<br />
SKOL South Kansas & <strong>Oklahoma</strong> <strong>Rail</strong>road<br />
SLWC Stillwater Central <strong>Rail</strong>road<br />
SS<br />
S<strong>and</strong> Springs <strong>Rail</strong>way<br />
STB Surface Transportation Board<br />
STCC St<strong>and</strong>ard Transportation Commodity Code<br />
xii<br />
<strong>Oklahoma</strong> <strong>Statewide</strong> <strong>Freight</strong> <strong>and</strong> <strong>Passenger</strong> <strong>Rail</strong> <strong>Plan</strong>
Acronyms <strong>and</strong> Abbreviations<br />
STRACNET<br />
TCSP<br />
TEU<br />
TIFIA<br />
TIGER<br />
TOE<br />
Transcon<br />
TRE<br />
TSA<br />
TSU<br />
TxDOT<br />
UP<br />
USC<br />
USDOD<br />
USDOT<br />
WFEC<br />
WTJR<br />
Strategic <strong>Rail</strong> Corridor Network<br />
Transportation <strong>and</strong> Community <strong>and</strong> System Preservation<br />
20-foot equivalent unit<br />
Transportation Infrastructure Finance <strong>and</strong> Innovation Act<br />
Transportation Investment Generating Economic Recovery<br />
Texas, <strong>Oklahoma</strong> & Eastern <strong>Rail</strong>road<br />
transcontinental<br />
Trinity <strong>Rail</strong>way Express<br />
Transportation Security Administration<br />
Tulsa-Sapulpa Union <strong>Rail</strong>way<br />
Texas Department of Transportation<br />
Union Pacific <strong>Rail</strong>road<br />
United States Code<br />
U.S. Department of Defense<br />
U.S. Department of Transportation<br />
WFEC <strong>Rail</strong>road Company<br />
Wichita, Tillman & Jackson <strong>Rail</strong>way<br />
May 2012<br />
xiii
Executive Summary<br />
OKLAHOMA<br />
STATEWIDE FREIGHT &<br />
PASSENGER RAIL PLAN<br />
<strong>Rail</strong> Transportation <strong>and</strong> the State of <strong>Oklahoma</strong><br />
Role of rail transport in <strong>Oklahoma</strong><br />
<strong>Rail</strong> transportation comprises both the movement of goods (freight rail) <strong>and</strong> the movement<br />
of people (passenger rail). <strong>Freight</strong> rail transportation users in <strong>Oklahoma</strong> are served<br />
by 3 major railroads <strong>and</strong> 18 short line railroads, each a private corporation. <strong>Passenger</strong><br />
service in <strong>Oklahoma</strong> is operated by the quasi-governmental agency, National <strong>Rail</strong>road<br />
<strong>Passenger</strong> Corporation (Amtrak), on lines owned by the freight carrier, BNSF <strong>Rail</strong>way<br />
Company (BNSF). <strong>Oklahoma</strong>’s only passenger train is the Heartl<strong>and</strong> Flyer, running<br />
between <strong>Oklahoma</strong> City <strong>and</strong> Fort Worth. While operated by Amtrak, the Heartl<strong>and</strong> Flyer<br />
is a state-sponsored train with <strong>Oklahoma</strong> <strong>and</strong> Texas participating in its support.<br />
<strong>Freight</strong> railroads have proven to be vital in maintaining the nation’s <strong>and</strong> the state’s<br />
economy. The efficiency of steel wheel on steel rail is unmatched by either highway or air<br />
transport. This efficiency has been the underpinning that has perpetuated the rail industry<br />
through enormous changes in the economy <strong>and</strong> the competitive environment.<br />
<strong>Freight</strong> rail brings finished goods <strong>and</strong> raw materials to <strong>Oklahoma</strong>’s businesses, transports<br />
<strong>Oklahoma</strong>’s products to the rest of the nation <strong>and</strong> the world, moves material between<br />
points within the state, <strong>and</strong> provides a path for traffic passing through. For <strong>Oklahoma</strong>, the<br />
freight rail system has proven valuable to the energy <strong>and</strong> agricultural industries <strong>and</strong> in<br />
support of the military.<br />
<strong>Oklahoma</strong>’s passenger train, the Heartl<strong>and</strong> Flyer, provides an important link between the<br />
state, the Dallas/Fort Worth Metroplex, <strong>and</strong> the national Amtrak system. It provides an<br />
alternative to both auto <strong>and</strong> air transport modes <strong>and</strong> provides a transportation choice with<br />
unparalleled energy efficiency.<br />
Purpose of the state rail plan<br />
In 2008, state rail plans took on an increased importance when Congress passed the<br />
<strong>Passenger</strong> <strong>Rail</strong> Investment <strong>and</strong> Improvement Act (PRIIA) (49 USC 22705). It laid the<br />
foundation for an exp<strong>and</strong>ed focus on rail planning. PRIIA requires each state to have an<br />
approved state rail plan as a condition of receiving rail funding in the future for either<br />
passenger or freight improvements. PRIIA requires each state rail plan to include the<br />
following:<br />
• Inventory of the existing rail transportation network<br />
• Review of proposed high-speed rail corridors in the state<br />
May 2012<br />
ES-1
Executive Summary<br />
• Statement of the state’s objectives related to rail transportation<br />
• General analysis of rail’s economic, transportation, <strong>and</strong> environmental impacts<br />
• Long-range investment program for current <strong>and</strong> future rail freight <strong>and</strong> passenger<br />
services<br />
• Discussion of public financing issues for rail projects <strong>and</strong> listing of current <strong>and</strong><br />
potential rail-related funding sources<br />
• Discussion of stakeholder-identified rail infrastructure issues<br />
• Review of freight <strong>and</strong> passenger multimodal rail connections <strong>and</strong> facilities<br />
• Review of publicly funded rail projects that enhance rail-related safety<br />
• Performance evaluation of passenger rail services<br />
• Compilation of previous high-speed rail reports <strong>and</strong> studies<br />
• Statement that the state’s rail plan complies with PRIIA<br />
To be eligible for any future federal funds, a state must have the legal, financial, <strong>and</strong> technical<br />
capacity to execute a project. This state rail plan provides proof of this ability <strong>and</strong> will<br />
include any proposed projects for which the state may apply for funding. The <strong>Oklahoma</strong><br />
<strong>Statewide</strong> <strong>Freight</strong> <strong>and</strong> <strong>Passenger</strong> <strong>Rail</strong> <strong>Plan</strong> has been developed to comply with the requirements<br />
of PRIIA.<br />
Relationship between the railroads <strong>and</strong> the State of <strong>Oklahoma</strong><br />
<strong>Oklahoma</strong>’s railroads are private businesses <strong>and</strong>, for the most part, operate on privately<br />
held property. This is a fundamental difference from much of the world, where railroads<br />
are public institutions like our highways <strong>and</strong> commercial airports. The federal government,<br />
under the commerce clause of the U.S. Constitution, is responsible for most<br />
regulation of the railroad industry, both for safety <strong>and</strong>, to a much lesser degree than in the<br />
past, economic regulation.<br />
The State of <strong>Oklahoma</strong>, however, does impose certain controls <strong>and</strong> provides specific powers<br />
to railroad corporations. Notable among the powers granted to railroads are the power<br />
to purchase, sell, or lease property <strong>and</strong> the use of eminent domain for acquisition of right<br />
of way. Responsibilities of the railroads under state law include the requirement to fence<br />
their rights of way, to operate the railroad in a safe manner, <strong>and</strong> to remit a gross receipts<br />
tax of 4 percent on the use of freight cars. The gross receipt tax is imposed in lieu of ad<br />
valorem (according to value) property taxes. The <strong>Oklahoma</strong> Department of Transportation<br />
has also been granted powers by the Legislature to own railroad rights-of-way <strong>and</strong><br />
to administer the <strong>Rail</strong>road Maintenance Revolving Fund for the upkeep of state-owned<br />
railroad rights-of-way. Revenues from the tax on freight cars <strong>and</strong> lease payments on the<br />
leased line are contributed to the fund. The state has an 8‐year maintenance plan for track<br />
<strong>and</strong> bridge upkeep to ensure that the state-owned lines meet federal st<strong>and</strong>ards for safe<br />
operation <strong>and</strong> continue to serve customers on those lines.<br />
The <strong>Rail</strong> Programs Division of the <strong>Oklahoma</strong> Department of Transportation (ODOT)<br />
was established in 1989 to oversee the state’s interests in the 3,599 miles of rail, 428 miles<br />
of which were owned by the state at that time. The Division is responsible for acquiring<br />
<strong>and</strong> administering federal <strong>and</strong> state funds used to support operation of the Heartl<strong>and</strong><br />
Flyer passenger service, highway construction projects affecting railroad property, railroad<br />
crossing safety improvements, <strong>and</strong> maintenance of the state-owned rail lines. The Division<br />
ES-2<br />
<strong>Oklahoma</strong> <strong>Statewide</strong> <strong>Freight</strong> <strong>and</strong> <strong>Passenger</strong> <strong>Rail</strong> <strong>Plan</strong>
Executive Summary<br />
comprises five sections—State-owned <strong>Rail</strong> Line Management, Safety, <strong>Rail</strong> <strong>Passenger</strong>, Construction,<br />
<strong>and</strong> Federal Programs.<br />
<strong>Oklahoma</strong>’s <strong>Freight</strong> <strong>Rail</strong>roads<br />
Structure <strong>and</strong> routes of <strong>Oklahoma</strong>’s railroads<br />
<strong>Freight</strong> railroads own 140,000 miles of rail line in the U.S. In 2010, rail accounted for<br />
43 percent of goods shipped in the U.S., followed by trucking with 31 percent <strong>and</strong><br />
waterways <strong>and</strong> pipelines each accounting for 13 percent. Air cargo represents less than<br />
1 percent of the ton-miles. Nearly all products are transported by rail, including consumer<br />
goods, industrial products, agricultural products, <strong>and</strong> natural resources.<br />
The Surface Transportation Board (STB), which economically regulates the rail industry, 1<br />
separates freight railroads into three categories based on revenue—Class I, Class II, <strong>and</strong><br />
Class III.<br />
Class I<br />
Class I railroads are the largest railroads <strong>and</strong> are defined by the STB as railroads with<br />
annual revenues exceeding $398.7 million. The majority of rail-based freight movements<br />
occur on Class I railroads operating over 96,000 miles of rail routes. In 2010, the major<br />
railroads hauled 1.9 billion tons of freight. Currently, three of the nation’s seven Class I<br />
railroads operate in <strong>Oklahoma</strong>:<br />
• BNSF <strong>Rail</strong>way Company (BNSF)<br />
• Kansas City Southern <strong>Rail</strong>way (KCS)<br />
• Union Pacific <strong>Rail</strong>road (UP)<br />
Class II<br />
Class II railroads earn revenues between $31.9 million <strong>and</strong> $398.7 million annually.<br />
There are no Class II railroads operating in <strong>Oklahoma</strong>.<br />
Class III<br />
Class III railroads, also called short lines, are the smallest railroads. Revenues for each of<br />
the nation’s 592 Class III railroads are less than $31.9 million annually. The importance<br />
of short lines has grown as these railroads often serve as the initial or final link between<br />
Class I railroads <strong>and</strong> rail customers. Short lines often work together with the Class I railroads<br />
to offer shippers a complete transportation solution. Eighteen short line railroads<br />
operate in <strong>Oklahoma</strong> over 927 miles of route.<br />
Routes<br />
There are over 3,599 route miles of railroad in <strong>Oklahoma</strong>. In 2010, this ranked<br />
<strong>Oklahoma</strong> 18th in the nation in terms of the total railroad mileage according to<br />
the Association of American <strong>Rail</strong>roads (AAR). The three Class I railroads operate<br />
2,360 miles 2 of route in the state.<br />
1<br />
The Surface Transportation Board regulates business <strong>and</strong> economic matter of the railroad industry. Safety regulation is the<br />
responsibility of the Federal <strong>Rail</strong>road Administration.<br />
2<br />
There is some overlap in mileages as certain lines are operated by more than one railroad.<br />
May 2012<br />
ES-3
Executive Summary<br />
The State of <strong>Oklahoma</strong> currently owns 428 miles of railroad. Most of these lines<br />
(420 miles) are under lease/purchase arrangements for operation by Class III railroads.<br />
The state acquired these lines mostly as the result of liquidation of the Chicago, Rock<br />
Isl<strong>and</strong> <strong>and</strong> Pacific <strong>Rail</strong>road Company (CRIP) following its bankruptcy <strong>and</strong> through<br />
ab<strong>and</strong>onments that peaked after the 1980 economic deregulation of the rail industry. Significant<br />
mileage under the lease/purchase arrangements are reverting to the railroads as<br />
they take title to the properties. With the cash flow from the lease payment dwindling, the<br />
state will not have as robust a program as previously operated under the <strong>Rail</strong> Maintenance<br />
Revolving Fund, which was the beneficiary of the payments.<br />
Both BNSF <strong>and</strong> UP operate north-south routes with significant freight traffic through the<br />
central portion of the state. The KCS north-south mainline from Kansas City to Houston<br />
passes along the state’s eastern border. These north-south routes are vital in connecting<br />
ports on the Gulf Coast <strong>and</strong> markets in Mexico with the central U.S.<br />
The main BNSF east-west transcontinental line from Chicago to California passes through<br />
western <strong>Oklahoma</strong> (through Alva <strong>and</strong> Woodward). The UP main Chicago to southern<br />
California east-west route crosses the panh<strong>and</strong>le through Guymon. Another former eastwest<br />
line across the central portion of the state connecting Memphis, Little Rock, <strong>and</strong><br />
<strong>Oklahoma</strong> City to California has gained recent attention of the Governor’s economic task<br />
force. Some segments of this former CRIP line is operated by UP <strong>and</strong> various short line<br />
railroads with other segments inactive.<br />
Current state of the industry in <strong>Oklahoma</strong><br />
Because of decades of poor performance marked by bankruptcies, railroads are often<br />
viewed as a failing, outmoded industry. Quite the opposite, America’s railroads benefitted<br />
immensely from the 1980 Stagger’s Act, which deregulated much of railroad commerce<br />
<strong>and</strong> restored the industry to fiscal health. Before deregulation, the industry was financially<br />
reeling from a punitive regulatory system that did not permit adaptation to existing market<br />
conditions. By 1980, seven major U.S. railroads were in bankruptcy, with one (CRIP)<br />
terminating all service <strong>and</strong> liquidating. The Stagger’s Act changed the railroad’s prospects<br />
allowing the freedom to negotiate with customers, alter the services offered to match those<br />
needed by customers, <strong>and</strong> dispose of unprofitable lines <strong>and</strong> services.<br />
The three Class I railroads originated 183,238 carloads of freight <strong>and</strong> terminated 323,442<br />
carloads of freight in <strong>Oklahoma</strong> in 2010. Due to <strong>Oklahoma</strong>’s location near the middle of<br />
the country, the Class I railroads also transport a significant amount of rail freight traffic<br />
through the state that has neither an origin nor destination within <strong>Oklahoma</strong>. A majority<br />
of this traffic is either coal from mines in northeast Wyoming to electric utilities in Texas<br />
<strong>and</strong> other southeast destinations or various containerized goods moving between California<br />
ports <strong>and</strong> the mid-west.<br />
Class I railroads have high volumes of trains per day, ranging in <strong>Oklahoma</strong> from approximately<br />
10 trains per day on several lines to nearly 60 trains per day on BNSF’s Transcon<br />
(i.e., Transcontinental) route across the northwestern part of the state.<br />
The Class III railroads provide rail service to market areas with inadequate volume to be<br />
served profitably by the larger railroads. In most instances, the short line railroads were<br />
ES-4<br />
<strong>Oklahoma</strong> <strong>Statewide</strong> <strong>Freight</strong> <strong>and</strong> <strong>Passenger</strong> <strong>Rail</strong> <strong>Plan</strong>
Executive Summary<br />
once part of the network of a larger railroad. The short lines serve as the customer service<br />
element for many rail-served businesses <strong>and</strong> provide a collection <strong>and</strong> distribution network<br />
for the Class I railroads, which move the bulk of the rail freight volume in <strong>and</strong> out<br />
of <strong>Oklahoma</strong>. Train service on short lines may range from as needed or seasonal up to a<br />
few trains per day. Short line railroads serve as economic engines in many communities,<br />
providing the vital transportation link to the regional, national, <strong>and</strong> global economies.<br />
According to data received from the short line railroads in surveys for this plan, <strong>Oklahoma</strong>’s<br />
short lines originated 69,869 rail carloads <strong>and</strong> terminated 116,658 carloads within<br />
the state during 2010.<br />
Economy <strong>and</strong> rail traffic<br />
<strong>Oklahoma</strong>’s economy has evolved significantly over the past two decades. The collapse of<br />
oil prices in the 1980s <strong>and</strong> the following slowdown of the state’s economy led <strong>Oklahoma</strong> to<br />
become less dependent on its natural resource bases of energy <strong>and</strong> agriculture. However,<br />
in recent years with the introduction of new technologies (e.g., hydraulic fracturing) <strong>and</strong><br />
rising prices, natural resources have once again become an important part of the <strong>Oklahoma</strong><br />
economy. Exhibit ES-1 <strong>and</strong> Exhibit ES-2 show commodity profiles of rail traffic<br />
originating <strong>and</strong> terminating in the state.<br />
Key industry groups<br />
Energy<br />
According to the Federal Reserve’s most recent Beige Book, in the tenth district, which<br />
includes <strong>Oklahoma</strong>, the energy sector continued to exp<strong>and</strong> strongly in late 2011, with<br />
increases in drilling activity <strong>and</strong> an optimistic outlook for the future. The price of crude<br />
oil remains favorable for drilling, <strong>and</strong> the only constraints the industry faces are shortages<br />
of labor <strong>and</strong> equipment.<br />
Oil <strong>and</strong> natural gas have been a staple of the <strong>Oklahoma</strong> state economy for many years.<br />
Oil <strong>and</strong> gas production imposes specific dem<strong>and</strong>s on <strong>Oklahoma</strong>’s transportation system.<br />
While much of the petroleum <strong>and</strong> petroleum-refining products shipped from <strong>Oklahoma</strong><br />
are moved by truck or pipeline, rail still has an important role to play. Gas is transmitted<br />
almost entirely by pipeline, but the rapid growth in natural gas extraction (as well as oil<br />
extraction from the Anadarko fields) provides opportunities for moving large drilling <strong>and</strong><br />
pipeline installation materials to sites throughout the state.<br />
In 2009, the oil <strong>and</strong> gas sector contributed $13.4 billion to <strong>Oklahoma</strong>’s gross state product<br />
(GSP), or approximately 10 percent, <strong>and</strong> employed 159,800 people.<br />
Green energy<br />
Green energy sectors, while small, are also of interest. Wind energy is an industry with<br />
good growth potential, particularly in the long run. <strong>Oklahoma</strong> already has a green energy<br />
sector. Bergey Wind Power Company in Norman is one of the world’s leading suppliers<br />
of wind turbines. Some modern wind turbines are 236 feet tall <strong>and</strong> have rotor blades that<br />
are roughly 82 feet long. Future windmills may reach higher than 328 feet <strong>and</strong> have blades<br />
measuring 164 feet long. Transport of wind turbine equipment will require the movement<br />
of overweight <strong>and</strong> oversize loads—an important capacity issue facing the <strong>Oklahoma</strong><br />
May 2012<br />
ES-5
Executive Summary<br />
highway system. The freight railroads are interested in increasing their participation in<br />
this economic sector <strong>and</strong> will provide an alternative to moving these large loads over the<br />
highways.<br />
Figure ES-1<br />
<strong>Rail</strong> freight originating in<br />
<strong>Oklahoma</strong>, commodity<br />
distribution (by tons)<br />
Source: WBS 2009<br />
Figure ES-2<br />
<strong>Rail</strong> freight terminating<br />
in <strong>Oklahoma</strong>, commodity<br />
distribution (by tons)<br />
Source: WBS 2009<br />
ES-6<br />
<strong>Oklahoma</strong> <strong>Statewide</strong> <strong>Freight</strong> <strong>and</strong> <strong>Passenger</strong> <strong>Rail</strong> <strong>Plan</strong>
Executive Summary<br />
Minerals <strong>and</strong> mining<br />
<strong>Oklahoma</strong>’s mining economy has been in decline but remains important. In total, mined<br />
minerals contributed approximately $268 million to <strong>Oklahoma</strong>’s real GSP in 2009 3 <strong>and</strong><br />
about 2,000 jobs in direct mining. It is important to remember that GSP only uses final<br />
expenditures to measure economic activity <strong>and</strong>, as such, it is not as broad a measure as<br />
production, which may include the economic impacts of shipments of minerals, their<br />
marketable production, <strong>and</strong> their final sale. <strong>Oklahoma</strong>’s mined minerals include gypsum,<br />
granite, limestone, aggregates, crushed stone, cement s<strong>and</strong> <strong>and</strong> gravel, clay, glass s<strong>and</strong>, salt<br />
feldspar, iodine, lime, pumice, <strong>and</strong> Tripoli (used as an abrasive).<br />
Construction materials, such as aggregates, crushed stone, s<strong>and</strong> <strong>and</strong> gravel, <strong>and</strong> cement,<br />
are important products extracted in southern parts of the state. <strong>Rail</strong>roads transport about<br />
10 percent of broken stone <strong>and</strong> 25 percent of Portl<strong>and</strong> cement.<br />
Fertilizers <strong>and</strong> chemicals<br />
Natural gas is used to produce nitrogen fertilizer. Therefore, domestic fertilizer production<br />
tends to be concentrated in regions rich in natural gas—the Mississippi Delta, the Texas<br />
panh<strong>and</strong>le, <strong>and</strong> <strong>Oklahoma</strong>. Major fertilizer production facilities in <strong>Oklahoma</strong> are located<br />
in Woodward, Verdigris, <strong>and</strong> Enid. Fertilizer <strong>and</strong> chemical production is an important<br />
part of the <strong>Oklahoma</strong> economy, contributing $581 million to real GSP in 2009.<br />
Agriculture<br />
<strong>Oklahoma</strong> is one of the nation’s largest producers of livestock <strong>and</strong> wheat, generating<br />
$5.8 billion of agricultural products in 2007. Over the past decade, the state’s agricultural<br />
sector has become increasingly diversified. The pork <strong>and</strong> poultry industries have increased<br />
rapidly in recent years, making <strong>Oklahoma</strong> the nation’s second <strong>and</strong> third largest producer<br />
of those commodities, respectively. Grain is the dominant agricultural rail export <strong>and</strong><br />
import for <strong>Oklahoma</strong>.<br />
Military<br />
<strong>Oklahoma</strong> contains five major U.S. Department of Defense (USDOD) installations. Both<br />
Fort Sill in Lawton <strong>and</strong> the McAlester Army Ammunition Depot in McAlester regularly<br />
use rail service as critical to their missions. The other three installations have discontinued<br />
rail service, but they are positioned to reactivate rail service should this decision be made<br />
by Military Traffic Management Comm<strong>and</strong> (MTMC).<br />
<strong>Oklahoma</strong> is a part of the Strategic <strong>Rail</strong> Corridor Network (STRACNET), a function<br />
of the <strong>Rail</strong>roads for National Defense. STRACNET consists of 38,800 miles of rail lines<br />
important to national defense serving military installations that require rail service.<br />
Both Fort Sill <strong>and</strong> the McAlester Army Ammunition Depot are actively connected to<br />
STRACNET, while Vance Air Force Base, Altus Air Force Base, <strong>and</strong> Tinker Air Force Base<br />
all have the capability to reconnect to STRACNET should the need arise.<br />
<strong>Freight</strong> multimodal connectivity<br />
The concept of multimodalism, broadly, is the use of two or more transportation modes to<br />
move goods efficiently from origin to destination.<br />
3<br />
Based on Bureau of Economic Analysis statistics; U.S. Geological Survey estimates the value to be in excess of $800 million.<br />
May 2012<br />
ES-7
Executive Summary<br />
A category of multimodalism is intermodal transportation. Intermodal transportation<br />
is commonly defined as the movement of goods by rail in trailers or containers on specialized<br />
flatcars. The use of containers also opened international markets to intermodal<br />
transportation as boxes could be readily exchanged between rail <strong>and</strong> ships. The most<br />
important development has been the invention of the double-stack freight car, which<br />
revolutionized the economics of container transportation.<br />
In 2005, BNSF closed its intermodal terminal near <strong>Oklahoma</strong> City due to lack of dem<strong>and</strong>.<br />
When BNSF closed the terminal, <strong>Oklahoma</strong> lost its only container transfer facility. Although<br />
exceptions exist, a viable terminal today requires at least 10,000 containers each month. Since<br />
then, <strong>Oklahoma</strong> rail intermodal shippers have had to move containers by truck to terminals<br />
in other states. Dallas-Fort Worth, Kansas City, <strong>and</strong> Denver each have terminals operated by<br />
BNSF <strong>and</strong> UP.<br />
Several factors determine the success of intermodal terminals. They are important considerations<br />
when railroads select locations for new terminals:<br />
• Terminals must be located on the railroad intermodal network<br />
• Terminal volumes must be sufficient to support frequent, long trains<br />
• Terminals must be optimally spaced<br />
The immediate development of new intermodal container terminals in <strong>Oklahoma</strong> is<br />
unlikely because of the considerations outlined above.<br />
Transloading is a term describing another category of multimodal transportation, typically<br />
involving the transfer of non-containerized freight from one mode to another. Transloading<br />
freight occurs because of delivery constraints (i.e., a freight shipper or receiver can<br />
only access one mode) or because there are financial benefits to switching modes during<br />
shipping. Transload operations involve products shipped either in bulk or as semi-bulk,<br />
dimensional cargo.<br />
Grain elevators are a type of transload facility. Grain is delivered to the elevator by truck<br />
where it is stored <strong>and</strong> eventually transferred to covered hopper rail cars. The elevator<br />
serves the purpose of consolidating smaller shipments into freight cars or train-size lots<br />
<strong>and</strong> also storing grain until dem<strong>and</strong> appears.<br />
At one time, industrial parks were small facilities serving local needs, typically populated<br />
by a few industrial companies. While these small parks are still prevalent, there has been<br />
increasing interest in larger multimodal facilities providing a range of logistics services.<br />
Major industrial parks developing in <strong>Oklahoma</strong> with multimodal capabilities include<br />
• Ardmore Industrial Airpark<br />
• Mid-America Industrial Park<br />
• Clinton-Sherman Industrial Airpark (<strong>Oklahoma</strong> Spaceport)<br />
The McClellan-Kerr Arkansas River Navigation System (MKARNS) is <strong>Oklahoma</strong>’s<br />
primary navigable waterway originating at the Port of Catoosa <strong>and</strong> flowing southeast connecting<br />
to the Mississippi River. MKARNS is 445 miles long <strong>and</strong> has 18 locks <strong>and</strong> 10 dams<br />
that enable year-round navigation.<br />
ES-8<br />
<strong>Oklahoma</strong> <strong>Statewide</strong> <strong>Freight</strong> <strong>and</strong> <strong>Passenger</strong> <strong>Rail</strong> <strong>Plan</strong>
Executive Summary<br />
The MKARNS can accommodate a tow of eight jumbo barges <strong>and</strong> the towboat. There is<br />
an initiative underway to deepen the MKARNS channel from 9 feet to 12 feet from the<br />
Mississippi River to the Tulsa Port of Catoosa. The 3‐foot difference would allow a barge<br />
to increase its loading capacity by 33 percent. Much of the MKARNS channel is currently<br />
12 feet deep, but 75 miles would require dredging at an estimated cost of $180 million.<br />
Ports in <strong>Oklahoma</strong> along the MKARNS include<br />
• Tulsa Port of Catoosa<br />
• Port of Muskogee<br />
• More than 30 private river terminals<br />
Benefits of rail transport accruing to <strong>Oklahoma</strong><br />
The rail industry has had a great impact on the establishment <strong>and</strong> economic success of<br />
<strong>Oklahoma</strong>. <strong>Oklahoma</strong>’s railroads played a key role in converting the previous frontier into<br />
one of the largest energy <strong>and</strong> agricultural producing regions of the U.S. The rail system has<br />
experienced many changes in the last 30 years <strong>and</strong> has evolved into the network that exists<br />
today.<br />
While the diesel-powered locomotives that operate in the state contribute to air <strong>and</strong> noise<br />
pollution, the principal alternative, truck transportation, has a far greater impact on the<br />
environment. According to Environmental Protection Agency data for 2009, rail transportation<br />
contributed only 2 percent of the greenhouse gas emissions in the U.S. By contrast,<br />
heavy-duty trucks contributed 20 percent of transportation greenhouse gas emissions.<br />
<strong>Rail</strong> traffic was 38 percent greater than truck traffic (measured in ton-miles).<br />
<strong>Rail</strong> transportation is also highly fuel-efficient. According to the AAR, U.S. freight railroads<br />
move a ton of freight 484 miles on a gallon of diesel fuel. This is four times as energy<br />
efficient as a truck. Using the 12.8 billion ton-miles that rail traffic originated in <strong>Oklahoma</strong><br />
in 2007, <strong>Oklahoma</strong> shippers saved 75 million gallons of fuel using rail transportation.<br />
<strong>Rail</strong> transportation has an impact on roadway congestion. Nearly 278 million tons of<br />
freight moves over <strong>Oklahoma</strong>’s rail network each year. A truck hauling freight between<br />
cities typically has an average capacity of 18 tons. If all rail traffic were to move by truck,<br />
<strong>Oklahoma</strong>’s highways would see an additional 15.4 million trucks per year, without considering<br />
the return movement of empty trucks.<br />
<strong>Rail</strong>roads in <strong>Oklahoma</strong> employ approximately 1,770 citizens. The vast majority (84 percent)<br />
work for one of the three Class I railroads in the state. In 2010, the combined payroll<br />
of all railroad companies totaled approximately $115.8 million. Also in <strong>Oklahoma</strong> that<br />
year, the railroads spent $15.1 million on in-state purchases <strong>and</strong> $6 million on capital<br />
improvements. This employment <strong>and</strong> spending by the railroads has direct impacts on the<br />
<strong>Oklahoma</strong> economy <strong>and</strong> also produces indirect <strong>and</strong> induced impacts. Induced impacts<br />
stem from the re-spending of wages earned by workers benefiting from both direct <strong>and</strong><br />
indirect activity of the industry (e.g., those employed by the railroads directly as well as<br />
those employed by companies who provide goods <strong>and</strong> services to the railroads).<br />
May 2012<br />
ES-9
Executive Summary<br />
<strong>Oklahoma</strong>’s <strong>Passenger</strong> <strong>Rail</strong><br />
<strong>Passenger</strong> services<br />
For purposes of state rail plans, passenger rail does not include urban systems, such as<br />
light rail. <strong>Passenger</strong> rail services are broadly categorized as<br />
• Conventional intercity rail service—These are medium- <strong>and</strong> long-distance trains<br />
that operate between towns <strong>and</strong> cities across the country with maximum train<br />
speeds of 79 miles per hour. Conventional intercity services operate over lines<br />
owned by freight railroads.<br />
• High-speed intercity rail service—Although prevalent in Europe <strong>and</strong> Asia, currently<br />
the only high-speed rail service in the U.S. is on the Northeast Corridor<br />
between Washington <strong>and</strong> Boston. Most of that corridor is rated at 125 miles per<br />
hour with 150 miles per hour over selected segments. High-speed rail services<br />
generally require tracks that are separate from slower freight operations for safety<br />
<strong>and</strong> efficiency.<br />
• Commuter rail—Service normally connects urban cores with suburban locations.<br />
The services are heavily concentrated during the morning <strong>and</strong> evening work commutes<br />
when travel is the highest. Currently, 24 commuter rail services operate in<br />
the U.S.<br />
Intercity passenger rail services were once provided by private railroads. As part of an<br />
effort to remedy the financial problems that the railroads were facing in the last half of the<br />
20th century, the federal government relieved the railroads of their passenger service obligations<br />
in the early 1970s. In a complex arrangement, Amtrak took over operation of the<br />
passenger trains with rights to operate those trains over the tracks of the freight railroads.<br />
<strong>Oklahoma</strong> passenger service<br />
<strong>Passenger</strong> rail service in <strong>Oklahoma</strong> is provided by the Heartl<strong>and</strong> Flyer with one train per<br />
day in each direction between <strong>Oklahoma</strong> City <strong>and</strong> Fort Worth, Texas. The service commenced<br />
in 1999, following a 20‐year absence of passenger service in <strong>Oklahoma</strong>.<br />
The Heartl<strong>and</strong> Flyer makes station stops in Norman, Purcell, Pauls Valley, <strong>and</strong> Ardmore<br />
before serving Gainesville, Texas, in addition to <strong>Oklahoma</strong> City <strong>and</strong> Fort Worth. Connections<br />
can be made in Fort Worth to Amtrak’s Texas Eagle, which operates between<br />
Chicago <strong>and</strong> Los Angeles via San Antonio. The Heartl<strong>and</strong> Flyer carried over 81,000 riders<br />
in 2010; this represented an 11‐percent increase over 2009. Ridership continued to grow<br />
in 2011. The Heartl<strong>and</strong> Flyer operates on tracks owned by BNSF. In 2010, the Heartl<strong>and</strong><br />
Flyer won Amtrak’s President’s Award for its high-quality service.<br />
The Heartl<strong>and</strong> Flyer passenger rail operation is funded through two sources—an annual<br />
line item state appropriation that goes into the <strong>Oklahoma</strong> <strong>Passenger</strong> <strong>Rail</strong> <strong>and</strong> Tourism<br />
Revolving Fund <strong>and</strong> House Bill (HB) 1873, passed in 1994, that established a dedicated<br />
public transit revolving fund. This passenger rail fund amounted to approximately<br />
$1.2 million.<br />
ES-10<br />
<strong>Oklahoma</strong> <strong>Statewide</strong> <strong>Freight</strong> <strong>and</strong> <strong>Passenger</strong> <strong>Rail</strong> <strong>Plan</strong>
Commuter <strong>and</strong> passenger service development<br />
Executive Summary<br />
There are three new intercity <strong>and</strong> high-speed passenger railroad services under evaluation<br />
for <strong>Oklahoma</strong>. The first would extend the existing Heartl<strong>and</strong> Flyer northward to Newton,<br />
Kansas, to provide a connection to Amtrak’s Southwest Chief service between Chicago<br />
<strong>and</strong> Los Angeles. A second proposed service would operate in part over the same line as<br />
the Heartl<strong>and</strong> Flyer between Fort Worth <strong>and</strong> Newton; however, the route would extend to<br />
Kansas City. This alternative combined with the Heartl<strong>and</strong> Flyer would provide two trains<br />
in each direction between <strong>Oklahoma</strong> City <strong>and</strong> Fort Worth. Investigation of these potential<br />
services is being led by the Kansas Department of Transportation (KDOT) with ODOT<br />
<strong>and</strong> the Texas Department of Transportation (TxDOT) supporting.<br />
The third proposal being evaluated is a high-speed rail service between Tulsa <strong>and</strong> <strong>Oklahoma</strong><br />
City. This line would connect both of <strong>Oklahoma</strong>’s million-person urban areas.<br />
Initially studied in 2001–2002, a preferred high-speed alignment was identified along the<br />
Turner Turnpike. ODOT will be initiating additional studies in 2012.<br />
Several other smaller scale initiatives are receiving consideration in <strong>Oklahoma</strong> to improve<br />
passenger services:<br />
• The Central <strong>Oklahoma</strong> Transit <strong>and</strong> Parking Authority (COTPA)is planning<br />
overall fixed-guideway transit improvements for <strong>Oklahoma</strong> City. Its 2005 Fixed<br />
Guideway Study includes the modern streetcar downtown circulator, bus rapid<br />
transit, <strong>and</strong> commuter rail (www.gometro.org/fgp).<br />
• Since the 2005 Fixed Guideway Study, further work has been conducted on the<br />
modern streetcar downtown circulator. The most recent information on the ongoing<br />
planning process can be found at www.letstalktransit.com.<br />
• In coordination with the COTPA studies on fixed guideway transit in the <strong>Oklahoma</strong><br />
City region, the Association of Central <strong>Oklahoma</strong> Governments (ACOG)<br />
has recently published a comprehensive study for an intermodal hub to connect<br />
the wide variety of planned transportation options on the edge of the downtown<br />
district. The 2011 Intermodal Transportation Hub Master <strong>Plan</strong> for Central<br />
<strong>Oklahoma</strong> can be downloaded from www.acogok.org/Newsroom/Downloads11/<br />
hubreport.pdf.<br />
• In the Tulsa region, the Indian Nations Council of Governments (INCOG)<br />
released its comprehensive transit development plan in October 2011. Entitled<br />
FastForward, the final report can be obtained at www.fastforwardplan.org.<br />
Multimodal passenger rail connectivity<br />
As with any mass transportation mode, from local transit to the airline industry, passengers<br />
must have the ability to reach their final destinations with a degree of convenience.<br />
Consequently, the presence of last mile alternatives is critical to the success of intercity or<br />
high-speed passenger rail services.<br />
At the Fort Worth end of the Heartl<strong>and</strong> Flyer route, a number of connections are available<br />
for transportation around Fort Worth, <strong>and</strong> the Trinity <strong>Rail</strong>way Express provides a connector<br />
to Dallas <strong>and</strong> its well-developed public transportation network. Current connections<br />
May 2012<br />
ES-11
Executive Summary<br />
in <strong>Oklahoma</strong> are more limited, although the <strong>Oklahoma</strong> City transit system can be<br />
accessed from near the station.<br />
The initiatives outlined in the section above could be instrumental in providing convenient<br />
connections <strong>and</strong>, if properly coordinated, could provide superior service to<br />
<strong>Oklahoma</strong>’s travelers.<br />
Current <strong>Rail</strong>road Development Initiatives<br />
<strong>Freight</strong> railroad <strong>and</strong> short line development<br />
<strong>Oklahoma</strong> freight rail upgrade project<br />
ODOT received Transportation Investment Generating Economic Recovery (TIGER) 4<br />
funding for the upgrade of the rail line serving the Anadarko Basin. The improvements<br />
will exp<strong>and</strong> the capacity of the line <strong>and</strong> permit higher speeds for trains serving the<br />
Anadarko Basin oil fields.<br />
Great Plains freight rail project<br />
KDOT, on behalf of the South Kansas & <strong>Oklahoma</strong> <strong>Rail</strong>road (SKOL), received TIGER<br />
funding for the construction of a new yard <strong>and</strong> rail line improvements that will permit<br />
the operation of heavier freight cars at higher speeds. Part of the improvement project is<br />
located in <strong>Oklahoma</strong>.<br />
<strong>Passenger</strong> rail development<br />
<strong>Oklahoma</strong> City Amtrak station access improvement<br />
ODOT is improving access to the former Santa Fe <strong>Rail</strong>road station in downtown<br />
<strong>Oklahoma</strong> City. The project, funded through a fiscal year (FY) 2010 Federal <strong>Rail</strong>road<br />
Administration (FRA) high-speed <strong>and</strong> intercity passenger rail (HSIPR) construction<br />
grant, will include the installation of a power switch <strong>and</strong> new rail line to provide the<br />
Heartl<strong>and</strong> Flyer in-<strong>and</strong>-out access to the station.<br />
Tulsa–<strong>Oklahoma</strong> City high-speed rail corridor investment plan<br />
With funding received from an FY 2010 FRA HSIPR planning grant, ODOT will be developing<br />
a federally m<strong>and</strong>ated high-speed rail corridor investment plan for a new service<br />
between Tulsa <strong>and</strong> <strong>Oklahoma</strong> City. The investment plan will comprise an updated service<br />
development plan <strong>and</strong> documentation required to comply with National Environmental<br />
Policy Act (NEPA) requirements. At the conclusion of the plan development, the project<br />
can enter the design phase.<br />
Service development plan for exp<strong>and</strong>ed passenger rail service—Fort Worth–<strong>Oklahoma</strong> City–<br />
Kansas City<br />
ODOT is participating in the preparation of a passenger rail service development plan<br />
evaluating the investment required to exp<strong>and</strong> passenger rail service in the region. Two<br />
alternatives are under consideration—extension of existing Heartl<strong>and</strong> Flyer service from<br />
<strong>Oklahoma</strong> City to Newton, Kansas, to connect with Amtrak’s Los Angeles–Chicago<br />
4<br />
TIGER is a competitive grant program established by the American Recovery <strong>and</strong> Reinvestment Act of 2009.<br />
ES-12<br />
<strong>Oklahoma</strong> <strong>Statewide</strong> <strong>Freight</strong> <strong>and</strong> <strong>Passenger</strong> <strong>Rail</strong> <strong>Plan</strong>
Executive Summary<br />
Southwest Chief, <strong>and</strong> the introduction of a new train operating between Fort Worth <strong>and</strong><br />
Kansas City.<br />
South Central HSIPR corridor study—<strong>Oklahoma</strong> City to South Texas<br />
An FY 2010 FRA HSIPR planning grant was awarded to TxDOT to develop a plan for<br />
high-speed passenger rail service from the Mexican border to <strong>Oklahoma</strong> City with the<br />
direction to examine initially the Fort Worth–<strong>Oklahoma</strong> City segment.<br />
Future of <strong>Oklahoma</strong> <strong>Rail</strong> Transport<br />
Strategic initiatives<br />
Outreach meetings <strong>and</strong> stakeholder interviews identified strategic initiatives that should<br />
be considered by ODOT in its rail programs. These initiatives fell into several categories:<br />
• Communication <strong>and</strong> education<br />
• Economic development<br />
• Funding<br />
• Infrastructure <strong>and</strong> system improvements<br />
• Legislative<br />
• <strong>Passenger</strong> rail service<br />
• Safety<br />
• Studies<br />
The following initiatives are designed to move ODOT from a position of preserving rail<br />
service to one of industry growth in the state. As with many states, <strong>Oklahoma</strong> is facing<br />
several strategic challenges:<br />
• The need to support <strong>and</strong> promote rational growth of the short-line industry <strong>and</strong><br />
passenger rail service in the state<br />
• The need to find new sources of funds to replace lease revenues lost as rail lines<br />
owned by the state revert to the rail operators as part of the lease-purchase<br />
program<br />
• The need to exploit the economic <strong>and</strong> public benefits of rail transportation<br />
• The need to inform the public of the benefits of rail transportation<br />
Communication <strong>and</strong> education<br />
Continue developing effective relationships between ODOT <strong>and</strong> freight railroads<br />
Maximize the efficiency of the state’s rail network <strong>and</strong> the public <strong>and</strong> private investments<br />
made in that network by continuing to have regular <strong>and</strong> effective dialogue <strong>and</strong> communication<br />
between ODOT <strong>and</strong> the railroads through the <strong>Oklahoma</strong> <strong>Rail</strong>road Association <strong>and</strong><br />
other venues. The railroads have requested development of a mutual forum to keep them<br />
current on proposed future highway projects with rail infrastructure impacts. This cooperative<br />
effort would enhance planning efforts, <strong>and</strong> it would lead to more efficient project<br />
coordination.<br />
May 2012<br />
ES-13
Executive Summary<br />
Use the state rail plan as a platform for the continuation of a rail information program<br />
As ODOT continues to be active in rail planning <strong>and</strong> other related programs, the need<br />
to educate the public on the benefits of rail transportation will increase. General public<br />
education information campaigns should build off the plan.<br />
Better inform the public on rail policies <strong>and</strong> requirements<br />
The public would benefit from a better underst<strong>and</strong>ing of ODOT activities <strong>and</strong> programs,<br />
such as the rail line acquisition program <strong>and</strong> its ongoing passenger rail service<br />
development.<br />
Incorporate passenger rail stations into the <strong>Oklahoma</strong> official state travel map<br />
Add notations for passenger rail station locations to the state’s travel map that is distributed<br />
to motorists <strong>and</strong> other travelers.<br />
Initiate a state rail workshop<br />
Convene a workshop on a recurring basis with relevant state agencies, such as the Departments<br />
of Transportation, Agriculture, <strong>and</strong> Commerce, along with representatives of the<br />
metropolitan planning organizations (MPO), the rail industry, <strong>and</strong> major shippers, to<br />
discuss current rail issues affecting <strong>Oklahoma</strong>.<br />
Establish regular rail forums between shippers <strong>and</strong> railroads<br />
Improving relationships <strong>and</strong> communication between railroads <strong>and</strong> shippers would<br />
enhance the economy of the state. Such events would allow participants to better underst<strong>and</strong><br />
opportunities <strong>and</strong> issues related to existing <strong>and</strong> emerging markets as well as rail<br />
service issues <strong>and</strong> infrastructure needs faced by both the railroads <strong>and</strong> the shippers.<br />
Continue partnering with adjacent states regarding rail passenger service<br />
Continue to meet on a regular basis with Kansas, Texas, <strong>and</strong> Missouri DOTs—a practice<br />
started with the preparation of the Fort Worth–<strong>Oklahoma</strong> City–Kansas City passenger<br />
rail service development plan—to create a regional base of support to enhance existing<br />
rail passenger services <strong>and</strong> create a regional passenger rail vision for the future, which<br />
includes regional extensions of existing rail passenger services.<br />
Economic development<br />
Integrate rail into <strong>Oklahoma</strong>’s economic development process<br />
ODOT should coordinate with the Governor’s Task Force on Economic Development <strong>and</strong><br />
Job Creation in regard to implementing the rail-related recommendations in that Task<br />
Force’s report entitled Bold Ideas for <strong>Oklahoma</strong>.<br />
Leverage the railroads connections with Mexico to stimulate business with Mexico<br />
The North American Free Trade Act (NAFTA), <strong>and</strong> subsequent related legislation, has<br />
opened up numerous new business opportunities with Mexico. <strong>Oklahoma</strong> should explore<br />
the potential for creating new business alliances with Mexico that would benefit both<br />
<strong>Oklahoma</strong> shippers <strong>and</strong> producers but also its short line <strong>and</strong> Class l railroads.<br />
ES-14<br />
<strong>Oklahoma</strong> <strong>Statewide</strong> <strong>Freight</strong> <strong>and</strong> <strong>Passenger</strong> <strong>Rail</strong> <strong>Plan</strong>
Executive Summary<br />
Promote rail-served industries, industrial parks, <strong>and</strong> transload facilities at strategic locations<br />
The need to establish more rail-served industrial parks was a theme at the workshop/open<br />
house meetings around the state. They would not only generate new rail business for the<br />
short line <strong>and</strong> Class l railroads but would also generate additional economic development<br />
for <strong>Oklahoma</strong>’s economy.<br />
ODOT <strong>and</strong> the Department of Commerce should conduct a workshop on freight rail<br />
transportation <strong>and</strong> invite short line <strong>and</strong> Class l railroads, regional economic development<br />
agencies, <strong>Oklahoma</strong> Chambers of Commerce, <strong>and</strong> other stakeholders.<br />
Should funding be available, the ODOT railroad assistance program should be exp<strong>and</strong>ed<br />
to include transload <strong>and</strong> transfer facilities.<br />
Integrate l<strong>and</strong> use <strong>and</strong> transportation planning<br />
ODOT should provide leadership in the integration of freight <strong>and</strong> passenger transportation<br />
<strong>and</strong> l<strong>and</strong> use planning at local, regional, <strong>and</strong> state levels with both governments <strong>and</strong><br />
businesses.<br />
Establish a trackside l<strong>and</strong> preservation education program<br />
ODOT <strong>and</strong> the <strong>Oklahoma</strong> Department of Commerce would work with local economic<br />
development agencies to preserve trackside for rail-dependent industrial use.<br />
Establish an industrial rail access program<br />
There is a need for funding for rail spurs <strong>and</strong> industrial rail leads connecting <strong>Oklahoma</strong>’s<br />
industrial properties to the <strong>Oklahoma</strong> rail network. The state should explore the creation<br />
of an industrial rail access program <strong>and</strong> sources of funding for the program.<br />
Monitor <strong>and</strong> promote opportunities for development of an intermodal terminal in <strong>Oklahoma</strong><br />
Although conditions today are not favorable to the development of an intermodal container<br />
terminal in the state, the future may be different. The recent interest by the railroads<br />
in short haul domestic containerization may provide a future opportunity for a new terminal<br />
strategically located in <strong>Oklahoma</strong>.<br />
Partner with the Waterways Advisory Board to implement recommendations of <strong>Oklahoma</strong>’s<br />
Intermodal Capacity Study <strong>and</strong> to encourage increased transportation of commodities by both<br />
rail <strong>and</strong> water<br />
Develop strategies with ODOT’s Waterways Advisory Board <strong>and</strong> the ports at Catoosa<br />
<strong>and</strong> Muskogee to increase transportation of commodities <strong>and</strong> goods by rail <strong>and</strong> water, to<br />
increase access to both waterways <strong>and</strong> railways, <strong>and</strong> to take advantage of the efficiencies<br />
of these two modes of transport <strong>and</strong> relieve <strong>Oklahoma</strong>’s highways of unnecessary heavy<br />
truck traffic.<br />
May 2012<br />
ES-15
Executive Summary<br />
Funding<br />
Explore <strong>and</strong> analyze innovative funding <strong>and</strong> financing alternatives, including public-private<br />
partnerships<br />
The transfer of state-owned rail properties to rail operators as part of the state’s lease/<br />
purchase program will reduce revenues for rail improvements. ODOT will need to assess<br />
current approaches to infrastructure funding to compensate for reduced availability of<br />
resources.<br />
Continue to pursue regional approaches to secure federal rail related funding<br />
ODOT should explore multi-state regional initiatives for obtaining federal funding for<br />
both freight <strong>and</strong> passenger rail related projects.<br />
Explore development of innovative local funding mechanisms such as the<br />
Port Authority concept<br />
<strong>Oklahoma</strong> should explore what is required for the creation of local authorities, such as<br />
Kansas Port Authorities, that can issue bonds for rail development.<br />
Educate stakeholders on existing rail funding programs <strong>and</strong> processes<br />
Educate rail stakeholders on the processes for applying for rail-related grants/loans,<br />
including TIGER, Community Development Block Grants (CDBG), <strong>and</strong> Section 108<br />
loans.<br />
Infrastructure <strong>and</strong> system improvements<br />
Support increasing freight rail speeds where supported by business<br />
Increasing permitted speeds on short lines serves to both increase capacity <strong>and</strong> reduce<br />
operating costs. This should be done where warranted to support traffic growth.<br />
Continue to support the development of emerging industries to strengthen <strong>Oklahoma</strong>’s economy<br />
Provide the capacity in the state’s rail network to allow for the use of the rail network in<br />
the development of emerging industries, such as the Bakken Shale <strong>and</strong> wind energy.<br />
Support the upgrading short line rail lines to accommodate 286,000-pound rail cars<br />
As with most states, the short line railroad industry in <strong>Oklahoma</strong> faces the issue of keeping<br />
its infrastructure on a par with its larger counterparts, the Class I railroads. Currently,<br />
the st<strong>and</strong>ard loaded rail car weighs 286,000 pounds. For railroads with infrastructure<br />
that cannot accommodate cars of this size are limited in their ability to interchange<br />
freight cars with Class I railroads, significantly affecting the local shippers. It is important<br />
that <strong>Oklahoma</strong>’s short line industry be able to maintain its infrastructure at the heavier<br />
286,000‐pound classification.<br />
Create a rail corridor preservation program<br />
Continue to preserve ab<strong>and</strong>oned rail lines for future use, even in those instances where<br />
the tracks have been removed or salvaged.<br />
ES-16<br />
<strong>Oklahoma</strong> <strong>Statewide</strong> <strong>Freight</strong> <strong>and</strong> <strong>Passenger</strong> <strong>Rail</strong> <strong>Plan</strong>
Legislative<br />
Executive Summary<br />
Continue to promote legislative action to enable public-private-partnership opportunities<br />
Current state law in <strong>Oklahoma</strong> does not permit public funding in private corporations<br />
or businesses. Legislative changes need to continue to be pursued <strong>and</strong> implemented to<br />
provide other funding alternatives.<br />
<strong>Passenger</strong> rail service<br />
Continue supporting <strong>Oklahoma</strong> City as a multimodal hub<br />
Facilitate institutional arrangements that would enable <strong>Oklahoma</strong> City to become a coordinated<br />
multimodal passenger rail hub—Heartl<strong>and</strong> Flyer, additional proposed intercity<br />
rail services, new proposed commuter rail services, proposed high-speed rail, <strong>and</strong> intercity<br />
bus service, as well as local transit services serving the <strong>Oklahoma</strong> City metropolitan<br />
area.<br />
Develop strategies with the <strong>Oklahoma</strong> City area MPO to enhance the connectivity of passenger<br />
rail options<br />
Strategies should address the development of selected commuter rail lines that would<br />
include linking the downtown area to the Will Rogers World Airport.<br />
Evaluate potential enhancements to existing passenger rail services on an ongoing basis<br />
Evaluate the potential for rail passenger operators other than Amtrak for the Heartl<strong>and</strong><br />
Flyer <strong>and</strong> other new proposed rail passenger services. Also, evaluate potential state-ownership<br />
of rail passenger equipment.<br />
Safety<br />
Partner with the railroads to enhance safety<br />
Specific elements of this effort should include developing plans to contact ODOT in the<br />
event of an emergency or when conducting emergency medical services field training.<br />
Studies<br />
Periodically perform an analysis of <strong>Oklahoma</strong>’s rail network to identify future connectivity gaps<br />
based on changing freight patterns<br />
Periodically, re-evaluate the rail freight network in <strong>Oklahoma</strong> to identify potential gaps<br />
in freight service due to issues such as ab<strong>and</strong>onments or lines taken out of service. The<br />
analysis should take into consideration emerging freight economic sectors <strong>and</strong> distribution<br />
patterns.<br />
Conduct a grain supply chain study to determine future multimodal needs<br />
Conduct a study, in cooperation with the <strong>Oklahoma</strong> Department of Agriculture, to evaluate<br />
the future supply chain requirements of the agriculture industry. The study should<br />
consider changes in grain distribution, future railroad service practices, freight car supply,<br />
storage capacity, <strong>and</strong> modal connectivity.<br />
May 2012<br />
ES-17
Executive Summary<br />
Prepare <strong>and</strong> disseminate a GIS-based statewide rail database<br />
Create a publicly accessible geographic information system (GIS) <strong>and</strong> web-based railroad<br />
inventory which includes items such as right-of-way ownership, weight of rail,<br />
286,000pound load capability, etc.<br />
Develop an unused rail siding inventory<br />
In conjunction with the Department of Commerce, develop an inventory of all unused<br />
rail sidings in the state. This information would be valuable to economic development in<br />
identifying sites <strong>and</strong> locations for potential rail-served businesses in the state.<br />
Projects<br />
A number of rail infrastructure improvement projects for the State of <strong>Oklahoma</strong> have<br />
been identified through submittals from Class I <strong>and</strong> short line railroads, as well as through<br />
identifying potential passenger rail operations projects, including both intercity <strong>and</strong> commuter<br />
rail. At present, ODOT does not have adequate resources to fund all of the major<br />
capital improvement projects compiled.<br />
Funding<br />
State funding<br />
State rail funding in <strong>Oklahoma</strong> is collected from several sources <strong>and</strong> deposited into the<br />
<strong>Rail</strong>road Maintenance Revolving Fund (RMRF). This fund is then utilized for projects on<br />
<strong>Oklahoma</strong>’s state-owned rail system. Major revenue sources for the fund are highlighted<br />
below.<br />
<strong>Oklahoma</strong> freight car tax<br />
This fund, composed of an annual 4‐percent tax on freight rail car revenues, yields a<br />
nearly constant annual income because the freight car tax rate has not been changed since<br />
its inception in 1978.<br />
Lease agreements<br />
ODOT <strong>Rail</strong> Programs Division receives annual lease <strong>and</strong> operations payments from seven<br />
separate short line rail operators. At this time, almost all the state-owned rail line is under<br />
lease <strong>and</strong> in operation.<br />
Right-of-way sales<br />
ODOT occasionally sells portions of l<strong>and</strong> deemed as excess to its needs, <strong>and</strong> some of these<br />
sales are former rail rights-of-way. There are situations where sales are generated as a<br />
result of a mature lease-purchase agreement. Recently, ODOT sold a former rail segment<br />
known as the Guthrie to Fairmont Line following exhaustive efforts to return the rail line<br />
to active use. These sales are infrequent <strong>and</strong> do not constitute any significant amount of<br />
annual funding.<br />
ES-18<br />
<strong>Oklahoma</strong> <strong>Statewide</strong> <strong>Freight</strong> <strong>and</strong> <strong>Passenger</strong> <strong>Rail</strong> <strong>Plan</strong>
Federal funding<br />
Executive Summary<br />
<strong>Passenger</strong> rail improvement <strong>and</strong> investment act<br />
PRIIA was enacted in October 2008 <strong>and</strong> provided for the reauthorization of the National<br />
<strong>Rail</strong>road <strong>Passenger</strong> Corporation (Amtrak). It tasked Amtrak, the U.S. Department of<br />
Transportation (USDOT), the FRA, individual states, <strong>and</strong> other stakeholders with improving<br />
operations, facilities, <strong>and</strong> service. PRIIA authorizes over $13 billion between 2009 <strong>and</strong><br />
2013 <strong>and</strong> promotes the development of new <strong>and</strong> improved intercity rail passenger services,<br />
state-sponsored corridors throughout the U.S., <strong>and</strong> the development of high-speed<br />
rail corridors.<br />
PRIIA established three new competitive grant programs for funding high-speed intercity<br />
passenger rail improvements:<br />
• Intercity <strong>Passenger</strong> <strong>Rail</strong> Service Corridor Capital Assistance Program<br />
• High-speed <strong>Rail</strong> Corridor Development Program<br />
• Congestion Grants<br />
ODOT has received three FRA HSIPR grants, providing matching planning <strong>and</strong> capital<br />
funds towards the state’s effort to improve <strong>and</strong> exp<strong>and</strong> its passenger rail service. These<br />
funds are being used to complete planning <strong>and</strong> environmental studies for the proposed<br />
high-speed rail route from Tulsa to <strong>Oklahoma</strong> City, to complete the state’s <strong>Oklahoma</strong><br />
<strong>Statewide</strong> <strong>Freight</strong> <strong>and</strong> <strong>Passenger</strong> <strong>Rail</strong> <strong>Plan</strong>, <strong>and</strong> to improve infrastructure at <strong>Oklahoma</strong><br />
City’s Santa Fe Depot related to operation of the Heartl<strong>and</strong> Flyer.<br />
Section 130 highway-rail grade crossing program<br />
Section 130 provides federal support to projects in an effort to reduce the incidence of<br />
accidents, injuries, <strong>and</strong> fatalities at public rail-highway crossings. States may utilize funds<br />
to improve the safety of railroad crossings, including installing or upgrading warning<br />
devices, eliminating at-grade crossings through grade separation, or consolidating or closing<br />
at-grade crossings. The federal share for these funds is 90 percent, with the remaining<br />
10 percent to be provided by local matching funds.<br />
<strong>Rail</strong> line relocation <strong>and</strong> improvement capital grant program<br />
This program authorizes funding for the purpose of providing financial assistance for local<br />
rail line <strong>and</strong> improvement projects. Any construction project that improves the route or<br />
structure of a rail line <strong>and</strong> (1) involves a lateral or vertical relocation of any portion of the<br />
rail line or (2) is carried out for the purpose of mitigating the adverse affects of rail traffic<br />
on safety, motor vehicle traffic flow, community quality of life, or economic development<br />
is eligible.<br />
Congestion mitigation <strong>and</strong> air quality improvement program<br />
The Congestion Mitigation <strong>and</strong> Air Quality (CMAQ) Improvement Program funds<br />
transportation projects <strong>and</strong> programs that improve air quality by reducing transportationrelated<br />
emissions in non-attainment <strong>and</strong> maintenance areas for ozone, carbon monoxide,<br />
<strong>and</strong> particulate matter. Examples of CMAQ-funded rail projects include intermodal<br />
facilities, track rehabilitation, diesel engine retrofits, idle-reduction projects, <strong>and</strong> new rail<br />
sidings.<br />
May 2012<br />
ES-19
Executive Summary<br />
Surface transportation program<br />
This is a grant program available for improvement of any federal-aid highway, bridge, or<br />
transit capital project. The program is meant to provide flexible funding to be used by<br />
states <strong>and</strong> localities. Eligible rail improvements include lengthening or increasing vertical<br />
clearance of bridges, eliminating crossings, or improving intermodal connectors.<br />
<strong>Rail</strong> <strong>and</strong> fixed guideway modernization<br />
This transit capital investment program (49 USC 5309) provides capital assistance for new<br />
rail systems (New Starts/Small Starts program), bus systems (Bus <strong>and</strong> Bus Related Equipment<br />
<strong>and</strong> Facilities program), <strong>and</strong> modernization of existing rail systems (Fixed Guideway<br />
Modernization program). Funding can be used for a variety of purposes, including the<br />
following:<br />
• Purchase <strong>and</strong> rehabilitation of rolling stock, track, line equipment, structures,<br />
signals, <strong>and</strong> communications<br />
• Development of power equipment <strong>and</strong> substations<br />
• Construction of passenger stations <strong>and</strong> terminals<br />
• Purchases of security equipment <strong>and</strong> systems<br />
• Construction of maintenance facilities<br />
• Operational support equipment, including computer hardware <strong>and</strong> software<br />
• System extensions<br />
• Preventive maintenance<br />
Transportation <strong>and</strong> community <strong>and</strong> system preservation pilot program<br />
The Transportation <strong>and</strong> Community <strong>and</strong> System Preservation (TCSP) Pilot Program<br />
provides funding for initiatives including planning <strong>and</strong> implementing grants; performing<br />
research to investigate <strong>and</strong> address the relationships between transportation, community,<br />
<strong>and</strong> system preservation; <strong>and</strong> identifying private-sector-based initiatives.<br />
Transportation enhancement program<br />
Enhancement funds are available to strengthen the cultural, aesthetic, <strong>and</strong> environmental<br />
aspects of the nation’s transportation system. Eligible projects include the rehabilitation<br />
of historic transportation facilities, <strong>and</strong> the preservation of ab<strong>and</strong>oned rail corridors. A<br />
number of environmental preservation, scenic beautification, <strong>and</strong> historic preservation<br />
projects would also qualify.<br />
ES-20<br />
<strong>Oklahoma</strong> <strong>Statewide</strong> <strong>Freight</strong> <strong>and</strong> <strong>Passenger</strong> <strong>Rail</strong> <strong>Plan</strong>
1. Background<br />
OKLAHOMA<br />
STATEWIDE FREIGHT &<br />
PASSENGER RAIL PLAN<br />
Although a critical element in the development of <strong>Oklahoma</strong> <strong>and</strong> the West, the U.S. rail<br />
system suffered a significant decline during the mid-20th Century. Excessive regulation<br />
coupled with significant government investment in the national highway system hurt the<br />
rail industry. Following several decades of decline, the rail industry is experiencing resurgence.<br />
Having become a significant driver of economic growth, the U.S. freight railroads<br />
are leaders in the world. Interest is also increasing in passenger rail with Amtrak experiencing<br />
a steady growth in ridership.<br />
The State of <strong>Oklahoma</strong> has been involved in rail transportation since the mid-1970s. The<br />
state’s participation increased in 1978 with the <strong>Oklahoma</strong> Legislature’s passing of the<br />
<strong>Rail</strong>road Rehabilitation Act. This legislation established the RMRF—the principal source of<br />
funding for maintaining <strong>and</strong> rehabilitating state-owned rail lines.<br />
Periodically, <strong>Oklahoma</strong> prepares a state rail plan detailing the existing condition of rail<br />
transportation in the state <strong>and</strong> outlining the state’s future participation in rail transportation.<br />
Many other states also actively participate in rail planning. The passage of PRIIA has made<br />
the preparation of a state rail plan necessary for participation in certain federal funding.<br />
State plans have evolved since the 1970s. This <strong>Oklahoma</strong> <strong>Statewide</strong> <strong>Freight</strong> <strong>and</strong> <strong>Passenger</strong> <strong>Rail</strong><br />
<strong>Plan</strong> is the first <strong>Oklahoma</strong> plan to be prepared under these new requirements.<br />
States have been developing rail plans since the 1970s as shown below:<br />
• 1970s—<strong>Plan</strong>s focused on federal funding (Local <strong>Rail</strong> Service Assistance Program)<br />
to support rail freight service on lines subject to ab<strong>and</strong>onment. The other focus of<br />
these early rail plans was on state-funded Amtrak routes.<br />
• Late 1980s–Early 1990s—<strong>Plan</strong>s focused on funding from a new federal program,<br />
the Local <strong>Rail</strong> <strong>Freight</strong> Assistance Act, which continued assistance to improve light<br />
freight traffic density lines subject to ab<strong>and</strong>onment.<br />
• 1990s–2008—<strong>Plan</strong>s focused more on state investments <strong>and</strong> linking rail to<br />
the federal multimodal planning efforts of the federal surface transportation<br />
re-authorization legislation.<br />
• 2008—<strong>Passenger</strong> <strong>Rail</strong> Investment <strong>and</strong> Improvement Act (PRIIA)—Legislation<br />
m<strong>and</strong>ated updating state rail plans <strong>and</strong> developing a national rail plan. It also<br />
authorized $3.7 billion for high-speed <strong>and</strong> intercity passenger service <strong>and</strong> rail<br />
congestion mitigation.<br />
• 2009—American Recovery <strong>and</strong> Reinvestment Act (ARRA)—This provided an<br />
additional $8.0 billion for high-speed <strong>and</strong> intercity rail corridors <strong>and</strong> created the<br />
$1.5 billion Transportation Investment Generating Economic Recovery (TIGER)<br />
grants program.<br />
• 2010—Appropriation under the federal Surface Transportation Program of<br />
May 2012 1-1
Chapter 1<br />
$50 million for state planning studies <strong>and</strong> an additional $2.5 billion for highspeed<br />
rail corridors.<br />
In 2008, state rail plans took on increased importance when Congress passed PRIIA<br />
(49 USC 22705). While the primary purpose of the act was to provide for improving passenger<br />
rail service in the U.S., it also laid the foundation for an exp<strong>and</strong>ed focus on rail<br />
planning. The act requires each state to have an approved state rail plan as a condition of<br />
receiving future rail funding for either passenger or freight improvements. PRIIA requires<br />
each state rail plan to include the following:<br />
• Inventory of the existing rail transportation network<br />
• Statement of the state’s objectives related to rail transportation<br />
• General analysis of rail’s economic, transportation, <strong>and</strong> environmental impacts<br />
• Long-range investment program for current <strong>and</strong> future rail freight <strong>and</strong> passenger<br />
services<br />
• Discussion of public financing issues for rail projects <strong>and</strong> listing of current <strong>and</strong><br />
potential rail-related funding sources<br />
• Discussion of stakeholder-identified rail infrastructure issues<br />
• Review of freight <strong>and</strong> passenger intermodal rail connections <strong>and</strong> facilities<br />
• Review of publicly funded rail projects that enhance rail-related safety<br />
• Performance evaluation of passenger rail services<br />
• Compilation of previous high-speed rail reports <strong>and</strong> studies <strong>and</strong> a comprehensive<br />
review of a state’s high-speed rail corridor(s) when present<br />
• Statement that the state’s rail plan complies with PRIIA<br />
To be eligible for any future federal funds, a state must have the legal, financial, <strong>and</strong> technical<br />
capacity to carry out a project. The state rail plan will provide proof of this ability<br />
<strong>and</strong> will include any currently proposed projects for which the state or its associated rail<br />
stakeholders may apply for funding.<br />
The <strong>Oklahoma</strong> <strong>Statewide</strong> <strong>Freight</strong> <strong>and</strong> <strong>Passenger</strong> <strong>Rail</strong> <strong>Plan</strong> has been developed to comply<br />
with PRIIA. In addition to meeting the requirements, the plan <strong>and</strong> planning process are to<br />
have the following additional purposes:<br />
• Educate the public on the importance of freight <strong>and</strong> passenger rail transportation<br />
to the economy of <strong>Oklahoma</strong>, the welfare of the state’s communities, <strong>and</strong> its<br />
environment<br />
• Synthesize the perspectives of the public, State of <strong>Oklahoma</strong> government agencies,<br />
local governments <strong>and</strong> planning agencies, shippers, Class I <strong>and</strong> short line rail<br />
carriers, <strong>and</strong> other stakeholders <strong>and</strong> interested parties<br />
• Set forth state freight <strong>and</strong> passenger rail transportation policy<br />
• Present priorities <strong>and</strong> strategies to enhance freight <strong>and</strong> passenger rail service<br />
beneficial to the public<br />
• Advance a rail improvement plan that serves as the basis for federal <strong>and</strong> state<br />
funding of rail infrastructure <strong>and</strong> service investments<br />
The <strong>Oklahoma</strong> <strong>Statewide</strong> <strong>Freight</strong> <strong>and</strong> <strong>Passenger</strong> <strong>Rail</strong> <strong>Plan</strong> has been developed to ensure<br />
that the benefits of freight <strong>and</strong> passenger rail are balanced as <strong>Oklahoma</strong> plans for the<br />
future. The rail plan will comprise the railroad element of the state’s next long-range multimodal<br />
transportation plan. Figure 1-1 illustrates the <strong>Oklahoma</strong> rail system.<br />
1-2<br />
<strong>Oklahoma</strong> <strong>Statewide</strong> <strong>Freight</strong> <strong>and</strong> <strong>Passenger</strong> <strong>Rail</strong> <strong>Plan</strong>
Background<br />
Figure 1-1<br />
<strong>Oklahoma</strong> 2011-2012 State <strong>Rail</strong>road Map<br />
May 2012 1-3
2. The <strong>Rail</strong>road Industry<br />
OKLAHOMA<br />
STATEWIDE FREIGHT &<br />
PASSENGER RAIL PLAN<br />
<strong>Rail</strong> transportation comprises both the movement of goods (freight rail) <strong>and</strong> the movement<br />
of people (passenger rail). Until 1971 with the formation of Amtrak, railroad<br />
companies operated both freight rail <strong>and</strong> passenger rail services. To preserve intercity<br />
passenger rail service in the U.S., the federal government created Amtrak. The railroad<br />
companies had been losing money for decades on their passenger services <strong>and</strong> sought<br />
relief from the regulations requiring provision of those services. Amtrak provided that<br />
relief. Today, two parallel rail systems operate with Amtrak providing service on lines<br />
owned by the freight railroads throughout the country (other than the northeast where<br />
Amtrak owns the lines over which it operates). In addition to Amtrak, commuter rail<br />
services operate in many metropolitan areas.<br />
<strong>Freight</strong> <strong>Rail</strong><br />
The freight rail industry plays a critical role in the country’s economic well-being. <strong>Freight</strong><br />
railroads own 140,000 miles of rail lines in the U.S. In 2010, rail accounted for 43 percent<br />
of goods tonnage shipped in the U.S., followed by trucking with 31 percent, <strong>and</strong> with<br />
waterways <strong>and</strong> pipelines accounting for 13 percent each. Air cargo represents less than<br />
1 percent of the tonnage. Nearly all product types are transported by rail, including consumer<br />
goods, industrial products, agricultural products, <strong>and</strong> natural resources.<br />
The STB, which regulates the rail industry, separates freight railroads into three categories,<br />
based primarily on revenue. The three railroad categories are Class I, Class II, <strong>and</strong><br />
Class III.<br />
Class I<br />
Class I railroads are the nation’s larger railroads. Class I railroads are defined by the STB<br />
as railroads with annual revenues exceeding $398.7 million. 1 The majority of rail-based<br />
freight movements occur on Class I railroads operating over 96,000 miles of rail routes.<br />
In 2010, the major railroads hauled 1.9 billion tons of freight.Currently, there are seven<br />
Class I railroads operating in the United States:<br />
• BNSF <strong>Rail</strong>way Company (BNSF)<br />
• CSX Transportation<br />
• Canadian National <strong>Rail</strong>way<br />
• Canadian Pacific<br />
• Kansas City Southern <strong>Rail</strong>way (KCS) Norfolk Southern<br />
• Union Pacific <strong>Rail</strong>road (UP)<br />
Three of the Class I railroads operate in <strong>Oklahoma</strong>—BNSF, KCS, <strong>and</strong> UP.<br />
1<br />
American Association of <strong>Rail</strong>roads, Class I <strong>Rail</strong>road Statistics, Nov. 2011. Revenue levels defining the STB railroad classes<br />
are adjusted for inflation annually. Figures given are for 2011.<br />
May 2012 2-1
Chapter 2<br />
Figure 2-1<br />
U.S. Class I railroads<br />
Class II<br />
Class II railroads are commonly called regional railroads <strong>and</strong> are smaller in revenue <strong>and</strong><br />
network than Class I railroads. Class II railroads have revenues between $31.9 million <strong>and</strong><br />
$398.7 million. According to the AAR, there are 12 Class II railroads in operation in the<br />
U.S. None operate in <strong>Oklahoma</strong>.<br />
Class III<br />
Class III railroads—also called short lines—are the smallest railroads. Many are former<br />
lines of larger railroads that were sold because they were unprofitable. Revenues for each<br />
of the nearly 592 Class III railroads are less than $31.9 million annually. The importance<br />
of short lines has grown as these railroads often serve as the initial or final link between<br />
Class I railroads <strong>and</strong> rail customers. Short lines often work together with the Class I railroads<br />
to offer shippers a complete transportation solution. Eighteen short line railroads<br />
operate in <strong>Oklahoma</strong>: 2<br />
• Arkansas-<strong>Oklahoma</strong> <strong>Rail</strong>road Company (AOK)<br />
• Austin, Todd & Ladd <strong>Rail</strong>road (AT&L)<br />
• Blackwell Northern Gateway <strong>Rail</strong>road (BNGR)<br />
• Cimarron Valley <strong>Rail</strong>road (CVR)<br />
• Farmrail Corporation (FMRC)<br />
• Grainbelt Corporation (GNBC)<br />
• Kiamichi <strong>Rail</strong>road (KRR)<br />
• Northwestern <strong>Oklahoma</strong> <strong>Rail</strong>road (NOKL)<br />
• Tulsa’s Port of Catoosa (PC)<br />
• Port of Muskogee <strong>Rail</strong>road (PMR)<br />
2<br />
American Association of <strong>Rail</strong>roads, Class I <strong>Rail</strong>road Statistics, November 2011.<br />
2-2<br />
<strong>Oklahoma</strong> <strong>Statewide</strong> <strong>Freight</strong> <strong>and</strong> <strong>Passenger</strong> <strong>Rail</strong> <strong>Plan</strong>
The <strong>Rail</strong>road Industry<br />
• Public Service of <strong>Oklahoma</strong> (PSO)<br />
• S<strong>and</strong> Springs <strong>Rail</strong>way (SS)<br />
• South Kansas & <strong>Oklahoma</strong> <strong>Rail</strong>road (SKOL)<br />
• Stillwater Central <strong>Rail</strong>road (SLWC)<br />
• Texas, <strong>Oklahoma</strong> & Eastern <strong>Rail</strong>road (TOE)<br />
• Tulsa-Sapulpa Union <strong>Rail</strong>way (TSU)<br />
• Western Farmers Electric Cooperative <strong>Rail</strong>road Company (WFEC)<br />
• Wichita, Tillman & Jackson <strong>Rail</strong>way (WTJR)<br />
Types of services<br />
<strong>Freight</strong> rail services are categorized as follows:<br />
• Bulk unit train services are for commodities such as coal, s<strong>and</strong>, gravel, grain,<br />
<strong>and</strong> other merch<strong>and</strong>ise <strong>and</strong> materials moved by unit trains. Unit trains are a set<br />
of railcars all carrying the same commodity from one origin point to one destination<br />
point in full trainload quantities. Other bulk products moved by rail include<br />
barley, oats, animal feed, wood pellets, <strong>and</strong> auto parts, but rarely in unit trains.<br />
• Auto unit train services are unit trains for assembled automobiles, trucks, vans,<br />
<strong>and</strong> other vehicles on stacked rail cars.<br />
• General merch<strong>and</strong>ise train services are trains comprising various freight car<br />
types from multiple origins to multiple destinations. The freight cars include<br />
boxcars, tank cars, <strong>and</strong> open gondola cars among others. These trains can<br />
transport products that move in unit trains but principally haul non-unit train<br />
commodities.<br />
• Intermodal train services are for commodities that move in containers or in<br />
trailers on flat cars. These trains move between major terminals where the containers<br />
are transferred between rail cars <strong>and</strong> trucks or rail cars <strong>and</strong> ships. Unlike<br />
other service types where the railroad picks up or delivers freight cars directly to<br />
customers, intermodal shipments begin or end by truck.<br />
<strong>Rail</strong> freight volume <strong>and</strong> capacity utilization data can serve as a gauge of economic activity.<br />
In general, the volume of goods moved by train is a good indicator for future economic<br />
conditions as raw materials are moved to factories or consumer goods are delivered to<br />
warehouses.<br />
Importance of intermodal train services<br />
The intermodal business segment has become a railroad growth area. Since 1980, intermodal<br />
freight traffic has more than tripled. The principal enabler of intermodal growth<br />
has been the double-stack freight car—flat cars permitting the stacking of one container<br />
on another. This results in a freight train with a carrying capacity operating at nearly the<br />
same cost as a train with half the capacity. The cost savings afforded by this technology<br />
have encouraged railroads to invest heavily in the removal of height restrictions, such as<br />
low bridges <strong>and</strong> other obstructions, along their lines to exp<strong>and</strong> the use of double-stack<br />
intermodal trains.<br />
Products from China <strong>and</strong> other Pacific Rim countries accounted for most of the historic<br />
intermodal growth. However, recently, a considerable shift of domestic truck shipments<br />
May 2012 2-3
Chapter 2<br />
Figure 2-2<br />
Intermodal traffic composition<br />
to intermodal has been occurring due to improved h<strong>and</strong>ling <strong>and</strong> technology. Figure 2-2<br />
shows the recent shift to domestic intermodal.<br />
Commodity moved by rail<br />
Figure 2-3 shows the share of goods moved by Class I railroads in 2010.<br />
Figure 2-3<br />
U.S. rail freight commodity mix<br />
(tonnage)<br />
The most significant single<br />
commodity carried by U.S.<br />
railroads is coal. In terms of<br />
tonnage, coal movements<br />
comprise approximately<br />
44 percent of all commodities<br />
moved by rail in the U.S. Coal<br />
remains the primary means of<br />
electricity generation, though<br />
its share has dropped consistently<br />
as natural gas continues<br />
to increase. Coal exports,<br />
however, are on pace to exceed<br />
levels not seen since the early<br />
1990s.<br />
Note: ISO Containers are st<strong>and</strong>ard international containers of st<strong>and</strong>ardized size<br />
for stacking on ships.<br />
<strong>Passenger</strong> <strong>Rail</strong><br />
<strong>Passenger</strong> rail service is<br />
broadly categorized as conventional<br />
intercity passenger rail service, high-speed intercity passenger rail service, <strong>and</strong><br />
commuter rail service.<br />
• Conventional intercity rail service—These are medium- <strong>and</strong> long-distance trains<br />
that operate between towns <strong>and</strong> cities across the country with maximum train<br />
speeds of 79 miles per hour. Amtrak is the operator, providing service on over 30<br />
routes (Figure 2-4). Conventional intercity services operate over lines owned by<br />
2-4<br />
<strong>Oklahoma</strong> <strong>Statewide</strong> <strong>Freight</strong> <strong>and</strong> <strong>Passenger</strong> <strong>Rail</strong> <strong>Plan</strong>
The <strong>Rail</strong>road Industry<br />
Figure 2-4<br />
Amtrak route system<br />
the freight railroads.<br />
• High-speed intercity rail service—Although prevalent in Europe <strong>and</strong> Asia where<br />
some trains operate in excess of 220 miles per hour, the only high-speed rail<br />
service currently in the U.S. is on the Northeast Corridor between Washington,<br />
D.C., <strong>and</strong> Boston. Most of the corridor is rated at 125 miles per hour with speed<br />
limits of up to 150 miles per hour over selected segments. High-speed rail services<br />
require tracks that are separate from the slower freight operations to prevent<br />
interference.<br />
• Commuter rail—These services normally connect urban cores with suburban<br />
locations <strong>and</strong> are heavily concentrated during the morning <strong>and</strong> evening work<br />
commute periods when travel is the highest.<br />
High-speed rail expansion<br />
The USDOT has been working with states to plan, fund, <strong>and</strong> develop high-speed rail<br />
services. This usually requires the construction of new track to ensure segregation from<br />
freight rail traffic. Since 1991, the FRA identified 11 high-speed rail corridors, positioning<br />
them for federal funding. The Tulsa–<strong>Oklahoma</strong> City–Dallas corridor was officially designated<br />
as a high-speed rail corridor in 2000. It is known as the South Central Corridor.<br />
Figure 2-5 shows the corridors.<br />
<strong>Passenger</strong> rail in <strong>Oklahoma</strong><br />
The <strong>Oklahoma</strong>-funded Heartl<strong>and</strong> Flyer provides passenger rail service in <strong>Oklahoma</strong><br />
which Amtrak operates. Amtrak operates one train per day in each direction between<br />
<strong>Oklahoma</strong> City <strong>and</strong> Fort Worth, Texas. The Heartl<strong>and</strong> Flyer makes station stops in Norman,<br />
Purcell, Pauls Valley, <strong>and</strong> Ardmore before serving Gainesville, Texas, in addition<br />
to <strong>Oklahoma</strong> City <strong>and</strong> Fort Worth. Connections can be made in Fort Worth to Amtrak’s<br />
Texas Eagle, which operates between Chicago <strong>and</strong> Los Angeles via San Antonio. According<br />
to Amtrak, the Heartl<strong>and</strong> Flyer carried over 81,000 riders in 2010; this represented an<br />
11-percent increase over 2009. The Heartl<strong>and</strong> Flyer operates on tracks owned by BNSF. In<br />
May 2012 2-5
Chapter 2<br />
Figure 2-5<br />
U.S. high-speed rail corridors<br />
2010, the Heartl<strong>and</strong> Flyer won Amtrak’s President’s Award for its service.<br />
Future passenger rail in <strong>Oklahoma</strong><br />
Three passenger railroad corridors are under evaluation for <strong>Oklahoma</strong>. Extension <strong>and</strong><br />
expansion of the existing Heartl<strong>and</strong> Flyer is being examined, as is service between <strong>Oklahoma</strong><br />
City <strong>and</strong> Tulsa. ODOT <strong>and</strong> KDOT just completed a Service Development <strong>Plan</strong><br />
looking at expansion of the Heartl<strong>and</strong> Flyer from <strong>Oklahoma</strong> City to Newton, Kansas, as<br />
well as a new st<strong>and</strong>alone daytime service between Kansas City <strong>and</strong> Fort Worth via <strong>Oklahoma</strong><br />
City. TxDOT, in coordination with ODOT <strong>and</strong> KDOT, will soon begin a study<br />
looking at the corridor from <strong>Oklahoma</strong> City to southern Texas that will include examination<br />
of exp<strong>and</strong>ing the Heartl<strong>and</strong> Flyer with a second frequency as well as performance<br />
improvements. And lastly, ODOT just began development of a service development plan<br />
<strong>and</strong> an environmental impact statement for the corridor from <strong>Oklahoma</strong> City to Tulsa.<br />
This line would connect both of <strong>Oklahoma</strong>’s million-person urban areas. Initially studied<br />
in 2001–2002, a preferred high-speed alignment was identified along the Turner Turnpike.<br />
This new study will reinvestigate all options, including those previously examined.<br />
2-6<br />
<strong>Oklahoma</strong> <strong>Statewide</strong> <strong>Freight</strong> <strong>and</strong> <strong>Passenger</strong> <strong>Rail</strong> <strong>Plan</strong>
3. <strong>Oklahoma</strong> <strong>Freight</strong> <strong>Rail</strong>roads<br />
OKLAHOMA<br />
STATEWIDE FREIGHT &<br />
PASSENGER RAIL PLAN<br />
The State of <strong>Oklahoma</strong> has a freight rail network that serves as a key state economic<br />
driver moving a wide variety of products that either are produced or consumed in the<br />
State as well as move through the state. Its freight railroads are integral to the national <strong>and</strong><br />
regional rail system.<br />
This section of the <strong>Oklahoma</strong> <strong>Statewide</strong> <strong>Freight</strong> <strong>and</strong> <strong>Passenger</strong> <strong>Rail</strong> <strong>Plan</strong> is an inventory of<br />
the freight railroads that operate within <strong>and</strong> through the state. <strong>Oklahoma</strong> has 21 railroad<br />
companies that provide freight rail service over 3,599 miles of railroad. In 2010, this<br />
ranked <strong>Oklahoma</strong> 18th in the nation in terms of the total railroad mileage. 1<br />
The State of <strong>Oklahoma</strong> owns 428 miles of railroad. These lines are leased for operation by<br />
the state to Class III railroads.<br />
Class I <strong>Rail</strong>roads<br />
The three Class I railroads in the state are BNSF, which operates 1,037 route-miles in<br />
the state, UP with 1173 route-miles, <strong>and</strong> KCS with 150 route-miles. These three railroads<br />
combined originated 183,238 carloads of freight <strong>and</strong> terminated 323,442 carloads<br />
of freight in <strong>Oklahoma</strong> in 2010. 2 Because of <strong>Oklahoma</strong>’s location near the middle of the<br />
country, the Class I railroads also transport a significant amount of rail freight traffic<br />
through the state that has neither an origin nor a destination within <strong>Oklahoma</strong>. A majority<br />
of this traffic is either coal from mines in northeast Wyoming to electric utilities in<br />
Texas <strong>and</strong> other southeast destinations or various goods moving between California ports<br />
<strong>and</strong> the Mid-West.<br />
Class I railroads have high volumes of trains per day, ranging in <strong>Oklahoma</strong> from approximately<br />
10 trains per day on several Class I lines to nearly 60 trains per day on BNSF’s<br />
Transcon route.<br />
BNSF <strong>Rail</strong>way<br />
BNSF operates the largest number of route-miles in the state <strong>and</strong> is also one of the<br />
largest rail networks in North America. BNSF owns approximately 23,000 miles of<br />
track <strong>and</strong>, additionally, operates over 9,000 miles of trackage rights on lines owned<br />
by other railroads throughout 28 states <strong>and</strong> 2 Canadian provinces. Through connections<br />
with railroads operating east of the Mississippi River, in Canada, <strong>and</strong> in Mexico,<br />
industries located on BNSF rails in <strong>Oklahoma</strong> can ship products to or receive products<br />
from any market in North America. Its connections to the Pacific Coast <strong>and</strong> Gulf of<br />
1<br />
Association of American <strong>Rail</strong>roads<br />
2<br />
Association of American <strong>Rail</strong>roads<br />
May 2012 3-1
Chapter 3<br />
Figure 3-1<br />
BNSF rail system<br />
Figure 3-2<br />
BNSF <strong>Oklahoma</strong> rail network<br />
Mexico seaports<br />
links <strong>Oklahoma</strong> to<br />
economic centers<br />
throughout the<br />
world. Figure 3-1<br />
shows the BNSF<br />
national rail system.<br />
BNSF owns<br />
1,037 miles of <strong>Oklahoma</strong><br />
rail routes <strong>and</strong><br />
operates over another<br />
372 miles owned by<br />
other railroads giving<br />
it the most extensive<br />
rail network in the<br />
Source: BNSF <strong>Rail</strong>way<br />
state. BNSF operates<br />
over two primary<br />
corridors in <strong>Oklahoma</strong>.<br />
The Transcon<br />
operating between<br />
Chicago <strong>and</strong> California<br />
traverses the<br />
northwest corner<br />
of the state <strong>and</strong> the<br />
MidCon, which<br />
operates between<br />
Canada <strong>and</strong> the Gulf<br />
Coast, generally follows<br />
or parallels the<br />
Source: BNSF <strong>Rail</strong>way<br />
I-35 corridor through<br />
<strong>Oklahoma</strong>. Another<br />
through route traverses <strong>Oklahoma</strong> from Kansas City to Dallas-Fort Worth; an east/west<br />
route through <strong>Oklahoma</strong> connects Springfield, Missouri, to the Transcon at Avard. In<br />
all, BNSF moved 3.5 million carloads of freight over these routes in <strong>Oklahoma</strong> in 2010,<br />
most of them passing through the state. Figure 3-2 depicts the BNSF route network in<br />
<strong>Oklahoma</strong>.<br />
3-2<br />
<strong>Oklahoma</strong> <strong>Statewide</strong> <strong>Freight</strong> <strong>and</strong> <strong>Passenger</strong> <strong>Rail</strong> <strong>Plan</strong>
Union Pacific <strong>Rail</strong>road<br />
<strong>Oklahoma</strong> <strong>Freight</strong> <strong>Rail</strong>roads<br />
UP operates in 23 states, owning over 26,000 route-miles of track <strong>and</strong>, additionally, operates<br />
over another 6,000 miles of trackage rights. Like its western competitor, BNSF, UP<br />
also provides service throughout North America through the connecting railroads. UP<br />
owns 26 percent of Mexico’s largest railroad, Ferromex.<br />
UP operates the second<br />
largest network<br />
in the state with<br />
1,173 route-miles<br />
in three primary<br />
corridors. The<br />
Golden State Route,<br />
operating between<br />
Chicago <strong>and</strong> California<br />
through Kansas<br />
City, traverses the<br />
<strong>Oklahoma</strong> panh<strong>and</strong>le.<br />
The former<br />
Missouri Pacific <strong>and</strong><br />
KATY lines in the<br />
eastern portion of<br />
the state connect<br />
the Kansas City area<br />
<strong>and</strong> Texas, Mexico,<br />
<strong>and</strong> destinations in<br />
the southeast. An<br />
additional north/<br />
south route connects<br />
Wichita, Kansas, to<br />
Fort Worth, Texas.<br />
Source: Union Pacific <strong>Rail</strong>road<br />
Figure 3-3<br />
Union Pacific rail system<br />
Figure 3-4<br />
Union Pacific <strong>Oklahoma</strong> rail<br />
network<br />
May 2012 3-3
Chapter 3<br />
Kansas City Southern <strong>Rail</strong>way<br />
The KCS railway network consists of the Kansas City Southern <strong>Rail</strong>road <strong>and</strong> the Texas<br />
Mexican <strong>Rail</strong>way (operating solely in Texas) as well as two railroads operating outside the<br />
U.S.—Kansas City Southern de Mexico <strong>and</strong> the Panama Canal <strong>Rail</strong>way Company. KCS<br />
operates in 10 states, owning approximately 2,600 miles of track <strong>and</strong>, additionally, operates<br />
over 600 miles of trackage rights.<br />
KCS owns 150 miles of track in eastern <strong>Oklahoma</strong>. KCS serves the central <strong>and</strong> southern<br />
U.S. <strong>and</strong> has the shortest route between Kansas City <strong>and</strong> the Gulf of Mexico.<br />
KCS operations in <strong>Oklahoma</strong> are primarily overhead shipments of coal <strong>and</strong> feed products<br />
traveling between the Kansas City area <strong>and</strong> destinations in Texas <strong>and</strong> Mexico. KCS<br />
originates <strong>and</strong> terminates approximately 20,000 total carloads per year in the State of<br />
<strong>Oklahoma</strong>. The route is the north/south mainline of KCS through Arkansas, which enters<br />
into <strong>Oklahoma</strong> near Watts <strong>and</strong> exits the state near Page (Figure 3-6).<br />
Figure 3-5<br />
KCS rail system<br />
Figure 3-6<br />
KCS <strong>Oklahoma</strong> rail network<br />
3-4<br />
<strong>Oklahoma</strong> <strong>Statewide</strong> <strong>Freight</strong> <strong>and</strong> <strong>Passenger</strong> <strong>Rail</strong> <strong>Plan</strong>
<strong>Oklahoma</strong> <strong>Freight</strong> <strong>Rail</strong>roads<br />
Class III <strong>Rail</strong>roads<br />
The primary purpose of Class III railroads, also commonly referred to as short line<br />
railroads, is to provide rail service to market areas with inadequate volume to be served<br />
profitably by the larger railroads. In most instances, the short line railroads were once part<br />
of the network of a larger railroad. The short lines serve as the customer service element<br />
of many rail-served businesses <strong>and</strong> serves as a collector network for the Class I railroads<br />
which move the bulk of the rail freight volume in <strong>and</strong> through <strong>Oklahoma</strong>. Train volumes<br />
on short lines may range from as needed or seasonal up to six trains per day. Short line<br />
railroads serve as economic engines in many communities, providing the vital transportation<br />
link to regional, national, <strong>and</strong> global economies. According to data received from the<br />
short line railroads in surveys for this plan, <strong>Oklahoma</strong>’s short lines originated 69,869 rail<br />
carloads <strong>and</strong> terminated 116,658 rail carloads within the state during 2010.<br />
Role of the State of <strong>Oklahoma</strong><br />
The State of <strong>Oklahoma</strong> stepped in <strong>and</strong> assisted in saving many rail lines from being ab<strong>and</strong>oned<br />
<strong>and</strong> dismantled in the 1980s after several Class I railroads declared bankruptcy.<br />
CRIP discontinued service in late 1979. In 1980 <strong>and</strong> 1981, the <strong>Oklahoma</strong> legislature<br />
appropriated $12 million <strong>and</strong> $10 million, respectively, to be invested in the <strong>Oklahoma</strong><br />
rail system. The State of <strong>Oklahoma</strong> acquired nearly 500 miles of railroads from CRIP <strong>and</strong><br />
the Missouri-Kansas-Texas <strong>Rail</strong>road Company in 1981–1983. To this date, the state continues<br />
to own track <strong>and</strong> leases the majority of these tracks to Class III railroads in order to<br />
have continued rail service for many <strong>Oklahoma</strong> communities <strong>and</strong> businesses.<br />
<strong>Rail</strong>road Profiles<br />
Figure 3-7 through Figure 3-27 are profiles of <strong>Oklahoma</strong>’s railroads. The Class l railroads<br />
are listed first, followed by the Class III railroads. Route-miles is the number of combined<br />
miles owned, leased, or under trackage rights agreements. Information for the<br />
profiles was provided by the railroad companies.<br />
May 2012 3-5
Chapter 3<br />
Figure 3-7<br />
BNSF <strong>Rail</strong>way (BNSF) Profile<br />
3-6<br />
<strong>Oklahoma</strong> <strong>Statewide</strong> <strong>Freight</strong> <strong>and</strong> <strong>Passenger</strong> <strong>Rail</strong> <strong>Plan</strong>
<strong>Oklahoma</strong> <strong>Freight</strong> <strong>Rail</strong>roads<br />
Figure 3-8<br />
Kansas City Southern <strong>Rail</strong>way<br />
(KCS) Profile<br />
May 2012 3-7
Chapter 3<br />
Figure 3-9<br />
Union Pacific <strong>Rail</strong>road (UP)<br />
Profile<br />
3-8<br />
<strong>Oklahoma</strong> <strong>Statewide</strong> <strong>Freight</strong> <strong>and</strong> <strong>Passenger</strong> <strong>Rail</strong> <strong>Plan</strong>
<strong>Oklahoma</strong> <strong>Freight</strong> <strong>Rail</strong>roads<br />
Figure 3-10<br />
Arkansas-<strong>Oklahoma</strong> <strong>Rail</strong>road<br />
Company (AOK) Profile<br />
May 2012 3-9
Chapter 3<br />
Figure 3-11<br />
AT&L <strong>Rail</strong>road (AT&L) Profile<br />
3-10<br />
<strong>Oklahoma</strong> <strong>Statewide</strong> <strong>Freight</strong> <strong>and</strong> <strong>Passenger</strong> <strong>Rail</strong> <strong>Plan</strong>
<strong>Oklahoma</strong> <strong>Freight</strong> <strong>Rail</strong>roads<br />
Figure 3-12<br />
Blackwell Northern Gateway<br />
<strong>Rail</strong>road (BNGR) Profile<br />
May 2012 3-11
Chapter 3<br />
Figure 3-13<br />
Cimarron Valley <strong>Rail</strong>road (CVR)<br />
Profile<br />
3-12<br />
<strong>Oklahoma</strong> <strong>Statewide</strong> <strong>Freight</strong> <strong>and</strong> <strong>Passenger</strong> <strong>Rail</strong> <strong>Plan</strong>
<strong>Oklahoma</strong> <strong>Freight</strong> <strong>Rail</strong>roads<br />
Figure 3-14<br />
Farmrail (FMRC) Profile<br />
May 2012 3-13
Chapter 3<br />
Figure 3-15<br />
Grainbelt (GNBC) Profile<br />
3-14<br />
<strong>Oklahoma</strong> <strong>Statewide</strong> <strong>Freight</strong> <strong>and</strong> <strong>Passenger</strong> <strong>Rail</strong> <strong>Plan</strong>
<strong>Oklahoma</strong> <strong>Freight</strong> <strong>Rail</strong>roads<br />
Figure 3-16<br />
Kiamichi <strong>Rail</strong>road (KRR) Profile<br />
May 2012 3-15
Chapter 3<br />
Figure 3-17<br />
Northwestern <strong>Oklahoma</strong> (NOKL)<br />
Profile<br />
3-16<br />
<strong>Oklahoma</strong> <strong>Statewide</strong> <strong>Freight</strong> <strong>and</strong> <strong>Passenger</strong> <strong>Rail</strong> <strong>Plan</strong>
<strong>Oklahoma</strong> <strong>Freight</strong> <strong>Rail</strong>roads<br />
Figure 3-18<br />
Tulsa’s Port of Caloosa (PC)<br />
Profile<br />
May 2012 3-17
Chapter 3<br />
Figure 3-19<br />
Port of Muskogee <strong>Rail</strong>road<br />
(PMR) Profile<br />
3-18<br />
<strong>Oklahoma</strong> <strong>Statewide</strong> <strong>Freight</strong> <strong>and</strong> <strong>Passenger</strong> <strong>Rail</strong> <strong>Plan</strong>
<strong>Oklahoma</strong> <strong>Freight</strong> <strong>Rail</strong>roads<br />
Figure 3-20<br />
Public Service of <strong>Oklahoma</strong><br />
(PSO) Profile<br />
May 2012 3-19
Chapter 3<br />
Figure 3-21<br />
S<strong>and</strong> Springs <strong>Rail</strong>way (SS)<br />
Profile<br />
3-20<br />
<strong>Oklahoma</strong> <strong>Statewide</strong> <strong>Freight</strong> <strong>and</strong> <strong>Passenger</strong> <strong>Rail</strong> <strong>Plan</strong>
<strong>Oklahoma</strong> <strong>Freight</strong> <strong>Rail</strong>roads<br />
Figure 3-22<br />
South Kansas & <strong>Oklahoma</strong><br />
<strong>Rail</strong>road (SKOL) Profile<br />
May 2012 3-21
Chapter 3<br />
Figure 3-23<br />
Stillwater Central <strong>Rail</strong>road<br />
(SLWC) Profile<br />
3-22<br />
<strong>Oklahoma</strong> <strong>Statewide</strong> <strong>Freight</strong> <strong>and</strong> <strong>Passenger</strong> <strong>Rail</strong> <strong>Plan</strong>
<strong>Oklahoma</strong> <strong>Freight</strong> <strong>Rail</strong>roads<br />
Figure 3-24<br />
Texas, <strong>Oklahoma</strong> & Eastern<br />
<strong>Rail</strong>road (TOE) Profile<br />
May 2012 3-23
Chapter 3<br />
Figure 3-25<br />
Tulsa Sapulpa Union <strong>Rail</strong>way<br />
(TSU) Profile<br />
3-24<br />
<strong>Oklahoma</strong> <strong>Statewide</strong> <strong>Freight</strong> <strong>and</strong> <strong>Passenger</strong> <strong>Rail</strong> <strong>Plan</strong>
<strong>Oklahoma</strong> <strong>Freight</strong> <strong>Rail</strong>roads<br />
Figure 3-26<br />
WFEC <strong>Rail</strong>road Company<br />
(WFEC) Profile<br />
May 2012 3-25
Chapter 3<br />
Figure 3-27<br />
Wichita, Tillman & Jackson<br />
<strong>Rail</strong>way (WTJR) Profile<br />
3-26<br />
<strong>Oklahoma</strong> <strong>Statewide</strong> <strong>Freight</strong> <strong>and</strong> <strong>Passenger</strong> <strong>Rail</strong> <strong>Plan</strong>
4. History of <strong>Rail</strong>road Development<br />
in <strong>Oklahoma</strong><br />
OKLAHOMA<br />
STATEWIDE FREIGHT &<br />
PASSENGER RAIL PLAN<br />
<strong>Rail</strong>roads have long played a significant role in <strong>Oklahoma</strong>’s development. By the time<br />
of the L<strong>and</strong> Run of 1889, the state’s railroad network had begun to develop. After the<br />
Civil War, the Missouri-Kansas-Texas <strong>Rail</strong>road (known as the Katy) laid the first rails in<br />
<strong>Oklahoma</strong> in 1870, completing a north-south line to Denison, Texas, in late 1872. The<br />
railroad network has been meeting the dem<strong>and</strong> for transportation in the state for over<br />
100 years except for a brief absence of passenger rail in the 1980s <strong>and</strong> 1990s. A majority of<br />
today’s highways <strong>and</strong> roadways in the state lie adjacent to existing or ab<strong>and</strong>oned railroad<br />
corridors.<br />
The advent of the Interstate Highway System in the mid-1950s changed the way Americans<br />
traveled. The automobile began to replace passenger rail as a preferred mode of<br />
long distance travel for a majority of Americans. Commercial air travel also hastened the<br />
demise of long distance passenger rail service. The extensive network of passenger trains<br />
that served <strong>Oklahoma</strong> in the 1950s had largely disappeared by the 1970s. As passenger rail<br />
declined in popularity, the private railroad companies focused almost entirely on freight.<br />
The creation of the National <strong>Rail</strong> <strong>Passenger</strong> Corporation (Amtrak) in 1971 signaled the<br />
end of most passenger service in <strong>Oklahoma</strong>. <strong>Passenger</strong> services were eliminated, other<br />
than the Amtrak route between Chicago, Kansas City, Wichita, <strong>Oklahoma</strong> City, Fort<br />
Worth, <strong>and</strong> Houston. Amtrak terminated this service in 1979. The states of <strong>Oklahoma</strong> <strong>and</strong><br />
Texas reestablished passenger service between <strong>Oklahoma</strong> City <strong>and</strong> Fort Worth in 1999<br />
with the operation of the Heartl<strong>and</strong> Flyer.<br />
The Class I railroads continue to transport the largest share of rail freight in <strong>Oklahoma</strong>.<br />
<strong>Rail</strong> moves much of the bulk commodity tonnage in <strong>Oklahoma</strong>. More recently, the development<br />
of intermodal freight operations with trains of containers has grown. These trains<br />
carry st<strong>and</strong>ard shipping containers either 40, 48, or 53 feet long, stacked in two levels on<br />
special freight cars. Large numbers of these trains are seen on the BNSF Transcon corridor,<br />
the east-west rail line connecting California ports with Chicago <strong>and</strong> eastern rail lines,<br />
<strong>and</strong> on the connecting line through Enid, Perry, Tulsa <strong>and</strong> on to Memphis <strong>and</strong> points in<br />
the southeast. UP also h<strong>and</strong>les large numbers of containers on its Chicago–Southern California<br />
route (Golden State route) across <strong>Oklahoma</strong>’s panh<strong>and</strong>le.<br />
The railroad, more than any other institution, has been responsible for the building of<br />
communities <strong>and</strong> industry throughout U.S. history. <strong>Oklahoma</strong> was no exception. Virtually<br />
all major cities established in the latter half of the 19th century were located where a<br />
railroad line crossed a river. Water <strong>and</strong> transportation are perhaps the two most important<br />
elements needed by a community. Before there were pipelines, nearness to rivers<br />
was the source of a community’s water, <strong>and</strong> the train was the most effective means of<br />
May 2012 4-1
Chapter 4<br />
transportation, especially for long distance travel or goods movement. <strong>Oklahoma</strong> City <strong>and</strong><br />
Tulsa developed by having both water <strong>and</strong> railroads.<br />
The Early Years—Development of <strong>Oklahoma</strong>’s <strong>Rail</strong> Network<br />
Until the mid-19th Century, railroads were not allowed to cross Indian Territory. However,<br />
following the Civil War, permits were issued to railroad companies to cross Indian<br />
l<strong>and</strong>s. While the Katy line passed through the eastern part of the Territory in the early<br />
1870s, the first railroad allowed through the Unassigned L<strong>and</strong>s of Central <strong>Oklahoma</strong> 1 was<br />
the Atchison, Topeka <strong>and</strong> Santa Fe <strong>Rail</strong>way (Santa Fe). The Santa Fe was chartered in Kansas<br />
in 1859, but construction actually began in 1868. The Santa Fe reached the future site<br />
of <strong>Oklahoma</strong> City in 1887. That line was initially part of the Southern Kansas <strong>Rail</strong>road,<br />
wholly owned by the Santa Fe. <strong>Oklahoma</strong> construction started in 1885 <strong>and</strong> was completed<br />
to Purcell in 1887. The Southern Kansas also built the rail line from Kiowa, Kansas,<br />
through Woodward to Amarillo, Texas, in 1887 (now part of the BNSF Transcon).<br />
At the time of the L<strong>and</strong> Run of 1889, the new Choctaw Line, later part of CRIP, was<br />
approaching <strong>Oklahoma</strong> City from the east, from Little Rock <strong>and</strong> Memphis. Since <strong>Oklahoma</strong><br />
City was also located on the north-south Santa Fe line, which was the only means<br />
of long distance goods transportation in the region, it became the trade center for nearby<br />
towns to its east <strong>and</strong> west. In 1890, the Chicago, Kansas <strong>and</strong> Nebraska <strong>Rail</strong>road line (after<br />
1891 owned by CRIP), being constructed between Kansas <strong>and</strong> Texas, reached El Reno. In<br />
1892, the Choctaw Coal <strong>and</strong> <strong>Rail</strong>way Company (also later acquired by CRIP) completed<br />
a line from El Reno to <strong>Oklahoma</strong> City. This was followed by various company expansions<br />
<strong>and</strong> acquisitions, <strong>and</strong> El Reno became the crossroads of the main north-south <strong>and</strong><br />
east-west lines of the CRIP system, including a line west to Amarillo <strong>and</strong> connecting with<br />
the Southern Pacific at Santa Rosa, New Mexico. Another key CRIP line between Kansas<br />
City <strong>and</strong> the Southern Pacific at Santa Rosa passed through the <strong>Oklahoma</strong> panh<strong>and</strong>le at<br />
Guymon.<br />
During the same period, the St. Louis-San Francisco <strong>Rail</strong>way (Frisco) was building a line<br />
from Joplin, Missouri, to Tulsa. Local <strong>Oklahoma</strong> City developers formed the St. Louis <strong>and</strong><br />
<strong>Oklahoma</strong> City <strong>Rail</strong>road to extend to Sapulpa connecting with the Frisco <strong>and</strong> bringing<br />
a third line to <strong>Oklahoma</strong> City. Thus, the Frisco came to <strong>Oklahoma</strong> City in 1898. At that<br />
time, <strong>Oklahoma</strong> City became the only community in the state with three railroad lines<br />
<strong>and</strong> became the state’s principal distribution center. Two more rail lines were to follow—<br />
the Missouri-Kansas-Texas <strong>Rail</strong>road in 1902 <strong>and</strong> the <strong>Oklahoma</strong> City <strong>and</strong> Western in 1903.<br />
The Katy actually laid its first rails in <strong>Oklahoma</strong> in 1870, reaching Vinita in 1872. In the<br />
early 1900s, the Katy connected Shreveport, Louisiana, San Antonio, Texas, <strong>and</strong> Tulsa <strong>and</strong><br />
<strong>Oklahoma</strong> City. Through aggressive expansion, the Katy developed a 3,865-mile system<br />
extending from St. Louis <strong>and</strong> Kansas City to Galveston <strong>and</strong> San Antonio on its northsouth<br />
axis <strong>and</strong> east-west from Shreveport to the <strong>Oklahoma</strong> panh<strong>and</strong>le. The Katy main line<br />
passed through Vinita, Muskogee, <strong>and</strong> McAlester en route from Kansas City <strong>and</strong> St. Louis<br />
to Dallas <strong>and</strong> Fort Worth.<br />
1<br />
The Unassigned L<strong>and</strong>s were several county areas in central <strong>Oklahoma</strong> that had not been assigned to any native tribe by<br />
treaty. In 1889, these l<strong>and</strong>s were opened to settlement <strong>and</strong> were the objective of the <strong>Oklahoma</strong> L<strong>and</strong> Rush.<br />
4-2<br />
<strong>Oklahoma</strong> <strong>Statewide</strong> <strong>Freight</strong> <strong>and</strong> <strong>Passenger</strong> <strong>Rail</strong> <strong>Plan</strong>
History of <strong>Rail</strong>road Development in <strong>Oklahoma</strong><br />
The Atlantic & Pacific <strong>Rail</strong>road, which subsequently became part of the Frisco, reached<br />
Vinita in 1871. It was extended to Tulsa in 1881–1882 <strong>and</strong> reached Sapulpa in 1886. It was<br />
not until the St. Louis & <strong>Oklahoma</strong> City <strong>Rail</strong>road Company built from Sapulpa to <strong>Oklahoma</strong><br />
City in 1898 that the Atlantic & Pacific enjoyed adequate revenue.<br />
Santa Fe’s main line entered the state just south of Arkansas City, Kansas, <strong>and</strong> passed<br />
through Ponca City, Perry, <strong>and</strong> Guthrie into <strong>Oklahoma</strong> City, then south to Fort Worth.<br />
This line is still in use today as a main line of BNSF, successor to the Santa Fe, <strong>and</strong> is the<br />
route of the Heartl<strong>and</strong> Flyer between <strong>Oklahoma</strong> City <strong>and</strong> Fort Worth. An alternative main<br />
line was constructed between 1900 <strong>and</strong> 1904 from Newkirk, located on the original main<br />
line, through Cushing <strong>and</strong> Shawnee to Pauls Valley, where it rejoined the original main<br />
line. The alternative line through Cushing is no longer in operation except for 8 miles<br />
between Shawnee <strong>and</strong> Aydelotte.<br />
The Santa Fe network in the state filled out as numerous branches were added, chiefly<br />
promoted by nominally independent companies. Two important railroads were the<br />
Kansas, <strong>Oklahoma</strong> Central <strong>and</strong> Southwestern, absorbed by the Santa Fe in 1900 (currently<br />
operated by SKOL), with a line from Owen to Owasso <strong>and</strong> Tulsa, <strong>and</strong> the<br />
<strong>Oklahoma</strong> Central, with trackage from Lehigh to Chickasha by way of Ada <strong>and</strong> Purcell.<br />
The latter at one time was a principal east-west route, but operations ceased in 1942.<br />
In the Panh<strong>and</strong>le, the Southern Kansas <strong>Rail</strong>way of Texas, in 1914 renamed Panh<strong>and</strong>le <strong>and</strong><br />
Santa Fe, built several lines around Boise City with connections into Kansas <strong>and</strong> Texas,<br />
but the Santa Fe operated the lines from the beginning. The Kansas City, Mexico <strong>and</strong> Orient,<br />
with its line from Waldron, Kansas, through Fairview, Clinton, <strong>and</strong> Altus into Texas<br />
became part of the Santa Fe in 1928.<br />
Eventually, an extensive network of Santa Fe main <strong>and</strong> branch lines covered <strong>Oklahoma</strong>.<br />
Altogether, some 1,500 miles connected most of the oil fields with markets throughout the<br />
country <strong>and</strong> provided transportation for agriculture <strong>and</strong> industry. Most of the Santa Fe<br />
main lines are still in use today with only the old Eastern <strong>Oklahoma</strong> line, Newkirk–Shawnee–Pauls<br />
Valley, <strong>and</strong> the <strong>Oklahoma</strong> Central lines having been ab<strong>and</strong>oned, along with<br />
some other branches. In 1997, the Santa Fe merged with the Burlington Northern <strong>Rail</strong>road<br />
to form the Burlington Northern Santa Fe system (now BNSF), which also includes<br />
the former St. Louis-San Francisco <strong>Rail</strong>way (Frisco).<br />
The Frisco also contributed to <strong>Oklahoma</strong>’s development. It operated an extensive route<br />
network that was permitted throughout the entire state <strong>and</strong> built when <strong>Oklahoma</strong> was still<br />
Indian Territory. Oil was discovered adjacent to the Frisco line in 1907 <strong>and</strong> the Frisco rails<br />
reached many important oil fields.<br />
Another independent rail line was constructed from Sapulpa to Denison, Texas, in the late<br />
1890s. This line was almost 200 miles long, with a little more than 190 miles located in<br />
<strong>Oklahoma</strong>. The line, equipment, <strong>and</strong> other property became part of the Frisco in 1901.<br />
Many other rail lines started operations in <strong>Oklahoma</strong>, contributing to the state’s early<br />
development. The <strong>Oklahoma</strong> City & Western <strong>Rail</strong>road Company, an <strong>Oklahoma</strong> corporation,<br />
together with the <strong>Oklahoma</strong> City & Texas <strong>Rail</strong>road Company, a Texas corporation,<br />
built the line from the end of the track of the former St. Louis & <strong>Oklahoma</strong> City <strong>Rail</strong>road<br />
May 2012 4-3
Chapter 4<br />
Company, at <strong>Oklahoma</strong> City, to Quanah, Texas. Approximately 175 miles of this road was<br />
in <strong>Oklahoma</strong>.<br />
The Arkansas Valley & Western <strong>Rail</strong>way Company, incorporated in <strong>Oklahoma</strong> Territory<br />
in 1902, constructed a line connecting West Tulsa to the Santa Fe at Avard in 1904. The<br />
Blackwell, Enid & Southwestern <strong>Rail</strong>way Company, incorporated in 1900, constructed the<br />
railroad from Blackwell through Enid to Red River north of Vernon, Texas. The Ozark<br />
& Cherokee Central <strong>Rail</strong>way Company, an Arkansas corporation, constructed a railroad<br />
from Fayetteville, Arkansas, to Muskogee, completed in 1903. In 1895 the Kansas City,<br />
Pittsburg <strong>and</strong> Gulf, predecessor to today’s Kansas City Southern <strong>Rail</strong>way, constructed a<br />
line through the eastern part of the Indian Territory along the Missouri <strong>and</strong> Arkansas<br />
borders.<br />
Reshaping of <strong>Oklahoma</strong>’s <strong>Rail</strong>roads<br />
As noted in <strong>Rail</strong>roads of <strong>Oklahoma</strong>, by Preston George <strong>and</strong> Sylvan Wood, first published<br />
in 1943 <strong>and</strong> reprinted by ODOT in the 1970s, “the network of railroads in <strong>Oklahoma</strong> was<br />
virtually completed during the 37-year period between 1870 <strong>and</strong> 1907.” Many smaller<br />
branch lines were ab<strong>and</strong>oned in the subsequent decades, but the major changes in the<br />
nation’s rail network began in the 1970s with major mergers <strong>and</strong> line ab<strong>and</strong>onments. Key<br />
events during the last decades of the 20th Century affecting these mergers <strong>and</strong> ab<strong>and</strong>onments<br />
include:<br />
• 1956—Federal-Aid Highway Act of 1956 signed into law on June 29 for the<br />
construction of 41,000 miles of interstate highways over a 20-year period. This<br />
national highway network had immense adverse economic consequences for<br />
the nation’s railroads. <strong>Rail</strong> traffic had been declining since World War II <strong>and</strong> the<br />
interstate system further contributed to the reduction in rail shipping <strong>and</strong> use of<br />
passenger trains.<br />
• 1968—In January, the nation’s two largest railroads blanketing the Northeast <strong>and</strong><br />
Midwest, the Pennsylvania <strong>and</strong> New York Central, merged to become Penn Central<br />
Transportation Company.<br />
• 1970—The Chicago Burlington & Quincy, Northern Pacific, Great Northern,<br />
<strong>and</strong> Spokane Portl<strong>and</strong> & Seattle railroads merged to form the Burlington Northern<br />
<strong>Rail</strong>way in March. In June, Penn Central went into bankruptcy, the largest<br />
business failure in the U.S. at that time, affecting the entire rail industry. By<br />
1976, Penn Central was one of seven major Northeast <strong>and</strong> Midwest railroads in<br />
bankruptcy.<br />
• 1971—On May 1, Amtrak (the National <strong>Rail</strong>road <strong>Passenger</strong> Corporation) took<br />
over operation of most intercity passenger trains from the freight railroads in a<br />
stopgap to keep trains running across Penn Central <strong>and</strong> other bankrupt carriers<br />
until the service could be ended or sold.<br />
• 1974–80—Development of the Powder River Basin in northeastern Wyoming<br />
into the largest coal source in the U.S. provided western railroads with exp<strong>and</strong>ed<br />
business opportunities. The Chicago & North Western <strong>Rail</strong>way gained access to<br />
the Powder River Basin in 1984 <strong>and</strong> was eventually acquired by Union Pacific.<br />
• 1975—The effect of bankruptcies on the major railroads reached <strong>Oklahoma</strong> with<br />
CRIP’s filing for bankruptcy protection in February. CRIP served <strong>Oklahoma</strong> on a<br />
4-4<br />
<strong>Oklahoma</strong> <strong>Statewide</strong> <strong>Freight</strong> <strong>and</strong> <strong>Passenger</strong> <strong>Rail</strong> <strong>Plan</strong>
History of <strong>Rail</strong>road Development in <strong>Oklahoma</strong><br />
north-south route from Wichita to Fort Worth through El Reno <strong>and</strong> an east-west<br />
route from Memphis to New Mexico, connecting to California.<br />
• 1980—CRIP shut down at the end of March <strong>and</strong> was later liquidated. <strong>Freight</strong><br />
service on the previous CRIP route was reinstated with the purchase of its lines<br />
by the State of <strong>Oklahoma</strong> <strong>and</strong> lease to Union Pacific under a purchase-lease<br />
agreement.<br />
• 1980—The Staggers <strong>Rail</strong> Act of 1980, 2 signed into law by President Carter on October<br />
14, deregulated the U.S. railroad industry, replacing the regulatory structure<br />
that existed since the 1887 Interstate Commerce Act. This l<strong>and</strong>mark legislation was<br />
one of three major acts passed in a 2-year period culminating in the transport<br />
regulation reform effort begun in 1971 during the Nixon Administration. 3 The rail<br />
act was meant to restore the nation’s freight rail network to economic health following<br />
the wave of industry bankruptcies.<br />
• 1982—Missouri Pacific <strong>Rail</strong>road <strong>and</strong> Western Pacific <strong>Rail</strong>road were merged into<br />
the Union Pacific. Although operations were integrated, the legal consolidation of<br />
Missouri Pacific with Union Pacific was not complete until 1997 due to outst<strong>and</strong>ing<br />
bonds.<br />
• 1988—The Southern Pacific was acquired by the Denver & Rio Gr<strong>and</strong>e Western<br />
retaining the name Southern Pacific. The Rio Gr<strong>and</strong>e was a regional railroad<br />
operating across the Rockies in Colorado <strong>and</strong> Utah.<br />
• 1995—Burlington Northern <strong>and</strong> Santa Fe merged to become the Burlington<br />
Northern Santa Fe <strong>Rail</strong>way Company (later renamed BNSF).<br />
• 1996—Union Pacific acquired the Southern Pacific. The Union Pacific-Southern<br />
Pacific transaction essentially completed the restructuring of the railroads west of<br />
the Mississippi River. Today BNSF <strong>and</strong> UP provide service throughout the West.<br />
Role of <strong>Oklahoma</strong> Department of Transportation in<br />
<strong>Rail</strong> Restructuring<br />
In response to the increasing number of rail line ab<strong>and</strong>onments in the 1970s <strong>and</strong> early<br />
1980s, the State of <strong>Oklahoma</strong> acquired several rail lines threatened with ab<strong>and</strong>onment.<br />
The state recognized the need to preserve branch lines that were important to <strong>Oklahoma</strong>’s<br />
commerce. ODOT initially acquired over 600 miles of rail lines with $22 million in state<br />
funds. As revenues developed from the leases of these initial purchases, the state made<br />
additional acquisitions. <strong>Oklahoma</strong> now owns 428 miles of rail lines. Currently, all but less<br />
than 8 miles are in service with five different operators.<br />
One of the important acquired group of rail lines consists of the former north-south CRIP<br />
main line between Kansas <strong>and</strong> Texas, the branch line between El Reno <strong>and</strong> <strong>Oklahoma</strong><br />
City, <strong>and</strong> the branch line north of Lawton. These lines were subsequently leased to UP<br />
through a lease-purchase arrangement with final payment made to the state in October<br />
2011. The line is now fully owned by UP <strong>and</strong> has become an integral part of its network.<br />
2<br />
The act was named for Congressman Harley Staggers (D-WV), who chaired the House Interstate <strong>and</strong> Foreign Commerce<br />
Committee<br />
3<br />
The other two acts were the Airline Deregulation Act (1978) <strong>and</strong> the Motor Carrier Regulatory Reform <strong>and</strong> Modernization<br />
Act (1980).<br />
May 2012 4-5
Chapter 4<br />
The former lease revenues were a major source of the funding for ODOT’s program to<br />
upgrade other short lines. Subsequently, total lease revenues are now greatly reduced.<br />
Funding for state-owned line maintenance comes from the <strong>Oklahoma</strong> <strong>Rail</strong>road Maintenance<br />
Revolving Fund established by the <strong>Rail</strong>road Rehabilitation Act of 1978. Revenues<br />
from a tax on freight cars <strong>and</strong> lease payments on the line are contributed to the fund. The<br />
state has an 8-year maintenance plan for track <strong>and</strong> bridge upkeep to address the basic<br />
needs of the state-owned lines to meet federal st<strong>and</strong>ards for safe operation <strong>and</strong> continued<br />
service.<br />
With BNSF operating two parallel east-west lines in <strong>Oklahoma</strong> City as a consequence of<br />
merger (the former Frisco line passing through <strong>Oklahoma</strong> City’s Union Station <strong>and</strong> the<br />
Packingtown Lead [also known as the Stockyards Spur south of the <strong>Oklahoma</strong> River]),<br />
ODOT recognized that rebuilding the I-40 Crosstown Freeway provided an ideal opportunity<br />
to consolidate operations <strong>and</strong> eliminate several street-level crossings through<br />
downtown. When completed, the Crosstown project will permit the removal of the<br />
deteriorating elevated highway structure through downtown <strong>Oklahoma</strong> City <strong>and</strong> provide<br />
BNSF <strong>and</strong> UP with new facilities related to further consolidating <strong>and</strong> streamlining<br />
railroad operations in <strong>Oklahoma</strong> City. This joint development of a railroad <strong>and</strong> highway<br />
corridor is an example of a cooperative transportation project that can serve as a beneficial<br />
model in the future. This project has been instrumental in the recent transformation<br />
of <strong>Oklahoma</strong> City.<br />
4-6<br />
<strong>Oklahoma</strong> <strong>Statewide</strong> <strong>Freight</strong> <strong>and</strong> <strong>Passenger</strong> <strong>Rail</strong> <strong>Plan</strong>
5. <strong>Rail</strong> Transportation’s Role in the<br />
<strong>Oklahoma</strong> Transportation Network<br />
OKLAHOMA<br />
STATEWIDE FREIGHT &<br />
PASSENGER RAIL PLAN<br />
The Role of <strong>Freight</strong> <strong>Rail</strong> in the <strong>Oklahoma</strong><br />
Transportation Network<br />
The rail industry has had a great impact on the establishment <strong>and</strong> economic success of<br />
<strong>Oklahoma</strong>. <strong>Oklahoma</strong>’s railroads played a key role in converting the previous frontier into<br />
one of the largest energy- <strong>and</strong> agricultural-producing regions of the U.S. The <strong>Oklahoma</strong><br />
rail system, like systems in most states, has experienced many changes in the last 30 years<br />
as it has evolved into the network that exists today.<br />
The <strong>Oklahoma</strong> freight system is multimodal comprising highway, air, <strong>and</strong> water transportation<br />
as well as rail. In addition, the system includes the connector facilities that make<br />
the efficient transfer<br />
of freight between<br />
Type of Infrastructure<br />
Miles/Number<br />
modes possible.<br />
All public roads<br />
112,634 miles<br />
Table 5-1 describes<br />
the <strong>Oklahoma</strong> freight<br />
Interstate<br />
930 miles<br />
network.<br />
Class I railroad trackage 2,360 miles (2011)<br />
Class III railroad trackage 1,239 miles (2011)<br />
<strong>Oklahoma</strong>’s freight<br />
Inl<strong>and</strong> waterways<br />
150 miles<br />
rail system is expected<br />
to continue to<br />
Public-use airports<br />
8 certificated for air carrier operations<br />
Source: Bureau of Transportation Statistics<br />
play a leading role<br />
in the state’s maintaining<br />
its leadership position in the energy <strong>and</strong> agriculture sectors of the U.S. economy.<br />
The railroads in the state provide essential goods movement services that are strategically<br />
connected to other modes. Improving the rail system productivity is critical to keeping<br />
<strong>Oklahoma</strong> a significant economic force.<br />
Table 5-1<br />
<strong>Oklahoma</strong> transportation<br />
infrastructure<br />
<strong>Oklahoma</strong>’s central location within the U.S. results in the state’s being a bridge for freight<br />
moving across the country. Notwithst<strong>and</strong>ing that position, <strong>Oklahoma</strong>’s economy produces<br />
<strong>and</strong> consumes significant amounts of goods, much of it moving by rail. Table 5-2 shows<br />
the modal shares of freight originating <strong>and</strong> terminating in <strong>Oklahoma</strong>.<strong>Rail</strong> transportation<br />
plays a major role in moving products produced or consumed in the state. Its lesser role in<br />
May 2012 5-1
Chapter 5<br />
Table 5-2<br />
<strong>Oklahoma</strong> freight mode shares<br />
in 2007 (thous<strong>and</strong> tons)<br />
Within Outbound Inbound<br />
Mode<br />
Weight Percent Weight Percent Weight Percent<br />
Truck 136,614 87.11% 49,106 43.21% 38,516 35.59%<br />
<strong>Rail</strong> 2,819 1.80% 18,179 16.00% 30,597 28.28%<br />
Water 0 0.00% 124 0.11% 1,441 1.26%<br />
Air (including truck-air) 0 0.00% 9 0.01% 9 0.01%<br />
Multiple modes <strong>and</strong> mail 1,267 0.81% 6,043 5.32% 4,215 3.90%<br />
Pipeline 15,182 9.68% 39,546 34.80% 32,534 30.07%<br />
Other <strong>and</strong> unknown 952 0.61% 625 0.55% 895 0.81%<br />
Total 156,834 100.00% 113,632 100.00% 108,208 100.00%<br />
Source: FHWA FAF-3<br />
transporting freight within the state is attributable to freight distances that are too short to<br />
make rail a cost-effective alternative.<br />
The state’s central location in the U.S. emphasizes the importance of the need to work in<br />
partnership with its neighboring states relative to future improvements to moving freight<br />
within <strong>and</strong> through the state.<br />
The Role of <strong>Passenger</strong> <strong>Rail</strong> in the <strong>Oklahoma</strong><br />
Transportation Network<br />
Recent development of passenger rail service<br />
Following World War II, national transportation policy emphasized a two-mode transportation<br />
system of highways <strong>and</strong> aviation. America’s relationship with its railroads was<br />
forged by forces that were very different from those that fostered our roads <strong>and</strong> airports<br />
<strong>and</strong> even our waterway transport systems.<br />
The railroad industry’s exploitive market behavior toward farmers in the late 1800s created<br />
a situation that would haunt the industry for nearly a century. Several western states,<br />
known as the Granger 1 states, enacted laws regulating the business practices of the railroads.<br />
These laws were overturned under the commerce clause of the U.S. constitution<br />
but were replaced by the passage of the Interstate Commerce Act of 1887. Regulation of the<br />
railroads by the Interstate Commerce Commission (ICC) lasted until 1980 when the Staggers<br />
Act largely deregulated the railroad business.<br />
The railroad industry’s passenger services were regulated along with its freight business.<br />
The passenger business had grown before <strong>and</strong> through World War II, with railroads being<br />
instrumental in moving troops about the country <strong>and</strong> ultimately to their points of embarkation<br />
for overseas deployment. After the war, the situation changed dramatically. As a<br />
result of the wartime dem<strong>and</strong>s, the rail infrastructure <strong>and</strong> equipment were distressed <strong>and</strong><br />
1<br />
The National Grange of the Order of Patrons of Husb<strong>and</strong>ry (The Grange) was formed in 1867. The Grange advocated for<br />
rural agricultural interests <strong>and</strong> was instrumental in the regulation of the railroads.<br />
5-2<br />
<strong>Oklahoma</strong> <strong>Statewide</strong> <strong>Freight</strong> <strong>and</strong> <strong>Passenger</strong> <strong>Rail</strong> <strong>Plan</strong>
<strong>Rail</strong> Transportation’s Role in the <strong>Oklahoma</strong> Transportation Network<br />
in need of maintenance <strong>and</strong> reinvestment. However, without wartime dem<strong>and</strong>, rail business<br />
dwindled reducing capital available for improvements.<br />
Before the war, competition from air travel was minor. Some of the railroads even participated<br />
by offering long-distance plane <strong>and</strong> train services where passengers flew by day<br />
<strong>and</strong> slept on the train at night. At war’s end, large numbers of military transport aircraft<br />
were made available at surplus prices for conversion to passenger airliners. 2 This permitted<br />
passenger airlines to be established with inexpensive aircraft flying to a network of<br />
military-built airports throughout the country.<br />
Possibly of greater consequence were the improvements to the highway system. Based on<br />
observations of Germany’s autobahns by General Dwight Eisenhower, the interstate highway<br />
system was established <strong>and</strong> provided fast automobile travel on a national scale. The<br />
interstate highways also fostered the diversion of freight from railroads to trucks, further<br />
eroding the railroad industry’s revenues.<br />
In spite of the new competition faced by the railroad passenger services, passenger trains<br />
were required to operate regardless of their profitability. This situation continued to worsen<br />
until the late 1960s when passenger service losses eventually threatened the financial<br />
viability of the entire rail industry. In response, Congress passed the <strong>Rail</strong> <strong>Passenger</strong> Service<br />
Act of 1970. The act established the National <strong>Rail</strong>road <strong>Passenger</strong> Corporation (Amtrak).<br />
<strong>Rail</strong>road participation in Amtrak was voluntary but permitted railroad companies to<br />
relieve themselves of their passenger service obligations.<br />
The Amtrak business arrangements with the volunteer railroads were based on the following<br />
principles:<br />
• In exchange for capital stock in Amtrak, a railroad transferred title to its passenger<br />
train equipment to Amtrak<br />
• The railroad granted to Amtrak the right to operate passenger trains on any tracks<br />
in its system<br />
• The railroad was granted relief from its passenger service obligations<br />
• Amtrak paid the railroad the incremental cost of maintaining its lines over which<br />
Amtrak operated (the costs covered where those required to maintain the freight<br />
tracks up to passenger track st<strong>and</strong>ards)<br />
• The railroad was indemnified for most liability arising out of passenger operations<br />
<strong>Oklahoma</strong> passenger rail service<br />
Amtrak commenced operating on May 1, 1971. <strong>Passenger</strong> train operations in <strong>Oklahoma</strong><br />
prior to the formation of Amtrak can be found in Chapter 11. From the commencement<br />
of Amtrak until October 9, 1979, <strong>Oklahoma</strong>’s sole remaining passenger train was the<br />
Texas Chief, renamed the Lone Star on March 15, 1974. The train operated on the tracks<br />
of the Santa Fe <strong>Rail</strong>road between Chicago <strong>and</strong> Houston. Congressional action required<br />
Amtrak to rationalize their system in 1979 by eliminating the least financially viable<br />
trains. Congress accepted Amtrak’s plan, which included termination of the Lone Star.<br />
2<br />
Particularly the Douglas C-47, which was built in large numbers for military use <strong>and</strong> is easily converted to its civilian counterpart,<br />
the DC-3.<br />
May 2012 5-3
Chapter 5<br />
<strong>Oklahoma</strong> remained without any passenger rail service until 1999 when the Heartl<strong>and</strong><br />
Flyer began operations.<br />
<strong>Passenger</strong> rail service in <strong>Oklahoma</strong> plays a limited role in its transportation system. The<br />
Heartl<strong>and</strong> Flyer operates between <strong>Oklahoma</strong> City <strong>and</strong> Fort Worth, Texas ,daily with<br />
intermediate stops in <strong>Oklahoma</strong> at Norman, Purcell, Pauls Valley, <strong>and</strong> Ardmore. The<br />
southbound train departs <strong>Oklahoma</strong> City at 8:25 a.m., <strong>and</strong> the northbound train departs<br />
Fort Worth in the dinner hour, arriving at <strong>Oklahoma</strong> City at 9:39 p.m. A convenient connection<br />
to Amtrak’s Chicago to San Antonio <strong>and</strong> Los Angeles Texas Eagle is available at<br />
Fort Worth.<br />
The Heartl<strong>and</strong> Flyer is co-sponsored by the states of Texas <strong>and</strong> <strong>Oklahoma</strong> <strong>and</strong> sanctioned<br />
by Amtrak under Section 403(b) of the <strong>Rail</strong> <strong>Passenger</strong> Service Act of 1970. Section 403(b)<br />
provides a mechanism for a state, regional, or local entity to establish a passenger rail<br />
service using local funds but benefiting from the operating authorities granted to Amtrak<br />
under the law. <strong>Oklahoma</strong> has chosen to be an active investor in its train service, paying<br />
close attention to the service quality since its inception on June 14, 1999. The state’s<br />
stewardship has resulted in the award of the Amtrak President’s Award for outst<strong>and</strong>ing<br />
service <strong>and</strong> has also resulted in a trend of growing ridership over the past decade. A more<br />
complete description of the Heartl<strong>and</strong> Flyer is provided in Chapter 11.<br />
The emerging trend toward regional train system growth is exemplified by the service.<br />
Several states—California, North Carolina, <strong>and</strong> New York being notable—have developed<br />
successful, multiple daily departure trains serving their constituents. These services are<br />
both cost <strong>and</strong> time competitive with highway travel. Long-distance travel is dominated<br />
by the airlines, but recent trends have the airlines reducing or eliminating shorter routes<br />
because of increasing costs per seat-mile, most evident on the shorter flights.<br />
The substitution of trains for short-haul air travel has not been universally accepted in the<br />
U.S. as it has in other parts of the world. France’s famed TGV trains serve Paris’ Charles<br />
de Gaulle airport directly. London’s Heathrow, Gatwick, Stansted, <strong>and</strong> Luton airports have<br />
direct train service, as do many others in Europe <strong>and</strong> Asia. Several American airports have<br />
rail connections but, with the exceptions of Newark Liberty <strong>and</strong> Baltimore’s Thurgood<br />
Marshall Airport, Burbank’s Bob Hope Airport, <strong>and</strong> Anchorage International, the connections<br />
are to local transit or commuter rail systems if any connection at all.<br />
America’s transportation policies tend to cast each mode of transport into its own silo,<br />
treating each mode separately. Highway, rail, air, <strong>and</strong> water transportation each have<br />
their own funding mechanisms <strong>and</strong> funding of improvements rarely straddles multiple<br />
modes. Although multimodal transportation improvement programs are often discussed<br />
<strong>and</strong>, sometimes even planned, the boundaries set by the funding mechanisms impede<br />
their implementation. Because of the unique relationship between the federal government<br />
<strong>and</strong> the railroad industry, public funding for rail has always been comparatively<br />
limited. Transit <strong>and</strong> commuter rail services do receive funding through the Federal Transit<br />
Administration, but intercity rail funds have mostly been restricted to Amtrak.<br />
In 2009, the Obama Administration announced plans to develop high-speed intercity<br />
rail with the goal of serving 80 percent of the American population within 25 years.<br />
5-4<br />
<strong>Oklahoma</strong> <strong>Statewide</strong> <strong>Freight</strong> <strong>and</strong> <strong>Passenger</strong> <strong>Rail</strong> <strong>Plan</strong>
<strong>Rail</strong> Transportation’s Role in the <strong>Oklahoma</strong> Transportation Network<br />
An initial funding package of $8 billion was made available through ARRA, plus an<br />
additional $2.5 billion through transportation appropriations. Largely resulting from<br />
budgetary restraints following the 2008 recession, further funding has not been forthcoming.<br />
However, various states, including <strong>Oklahoma</strong>, continue to plan commuter, intercity,<br />
<strong>and</strong> high-speed rail improvements assuming that funding will resume as the economy<br />
improves.<br />
Travel between <strong>Oklahoma</strong>’s two largest metropolitan areas, <strong>Oklahoma</strong> City <strong>and</strong> Tulsa,<br />
provide an attractive market for intercity rail transport. The 110 miles separating <strong>Oklahoma</strong><br />
City <strong>and</strong> Tulsa represents a distance where the economics of rail technology are<br />
very favorable. Both cities also plan to develop commuter rail services connected to their<br />
suburban areas providing linkages to surrounding population centers. Chapter 12 provides<br />
more information on future rail transportation plans.<br />
May 2012 5-5
6. Impacts of <strong>Rail</strong> Transportation<br />
OKLAHOMA<br />
STATEWIDE FREIGHT<br />
&<br />
PASSENGER RAIL PLAN<br />
Both freight <strong>and</strong> passenger rail transportation in <strong>Oklahoma</strong> has significant impacts on the<br />
state’s industries <strong>and</strong> the public. This chapter outlines the impacts on the environment,<br />
energy consumption, <strong>and</strong> the overall quality of life. Chapter 7 describes the impact of the<br />
rail industry to <strong>Oklahoma</strong>’s economy.<br />
Impact on the Environment<br />
While the diesel-powered locomotives operating in the state contribute to air <strong>and</strong> noise<br />
pollution, the principal alternative, truck transportation, has a far greater adverse impact<br />
on the economy. According to the U.S. Environmental Protection Agency data for 2009,<br />
rail transportation contributed<br />
only 2 percent<br />
of the greenhouse gas<br />
emissions in the U.S.<br />
By contrast, heavy-duty<br />
trucks contributed 20 percent<br />
of transportation<br />
greenhouse gas emissions<br />
(Figure 6-1). <strong>Rail</strong> traffic,<br />
measured in ton-miles,<br />
was 38 percent greater<br />
than truck ton-miles.<br />
Figure 6-1<br />
Source of greenhouse gas<br />
emissions<br />
Figure 6-2 provides another perspective on the efficiency of rail transportation. It shows<br />
the cumulative benefit of shifting freight from trucks to rail, in this case the impact of a<br />
10-percent diversion.<br />
Although data are not available to readily calculate the exact benefits of rail transportation<br />
to the <strong>Oklahoma</strong> environment, the importance<br />
can be quantitatively demonstrated. In 2007,<br />
rail freight originating in <strong>Oklahoma</strong> measured<br />
12.8 billion ton-miles as it moved to destinations<br />
throughout North America. Those rail<br />
shipments produced 394,000 tons of carbon<br />
dioxide emissions. 1 If rail transportation were<br />
not available, those same shipments would have<br />
Figure 6-2<br />
Impact of rail on greenhouse<br />
gases<br />
Source: Association of American <strong>Rail</strong>roads<br />
1<br />
CSX Transportation Emissions Calculator<br />
May 2012 6-1
Chapter 6<br />
generated 1.1 million tons of emitted carbon dioxide, nearly three times the level of green<br />
house gas pollutants produced by rail.<br />
Comparable ton-mileage data are not available for freight rail traffic destined or passing<br />
through the state. However, with rail tonnage terminating nearly double the originating<br />
tonnage <strong>and</strong> an additional 229 million tons passing through the state, the reduction in<br />
emissions is significant, more than ten times the tonnage originated.<br />
The railroads are also focusing on reducing other forms of pollutants. Advances in<br />
locomotive technology have produced new locomotives that meet the most stringent<br />
Environmental Protection Agency (EPA) st<strong>and</strong>ards for nitrous oxide <strong>and</strong> particulate<br />
matter emissions. Locomotives now emit 67 percent less nitrous oxide <strong>and</strong> 50 percent less<br />
particulate matter than they did 10 years ago. The railroads are also participants in EPA’s<br />
SmartWay Transport partnership. The partnership includes freight carriers <strong>and</strong> shippers<br />
who are targeting reducing emissions.<br />
Energy Impacts<br />
<strong>Rail</strong> transportation has become increasingly fuel-efficient more than doubling its capability<br />
to move freight on a gallon of fuel from 30 years ago, as shown in Figure 6-3. The U.S.<br />
freight railroads moved a ton of freight 484 miles on a gallon of diesel fuel in 2010 up<br />
from 235 miles in 1980. According to the AAR, this is four times as energy efficient truck<br />
transportation.<br />
Figure 6-3<br />
<strong>Rail</strong> fuel efficiency trend<br />
Using the 12.8 billion<br />
ton-miles that rail traffic<br />
originated in <strong>Oklahoma</strong> in<br />
2007, <strong>Oklahoma</strong> shippers<br />
saved 75 million gallons of<br />
fuel using rail transportation.<br />
As with the reduced<br />
emissions, even greater fuel<br />
savings can be assumed for<br />
inbound freight consumed<br />
by <strong>Oklahoma</strong>’s residents <strong>and</strong><br />
industries.<br />
The railroads have been<br />
focused on reducing fuel consumption because it is a significant cost of operations, <strong>and</strong><br />
greater efficiencies improve the railroads’ competitive position with respect to trucks. 2 The<br />
railroads have taken a number of initiatives:<br />
• Increased the carrying capacity of rail cars <strong>and</strong> increased the number of cars in a<br />
train through a combination of technology <strong>and</strong> infrastructure improvements—<br />
Train productivity has increased 61 percent over 1980. Some freight cars can now<br />
transport up to 140 tons with some trains up to 180 cars long.<br />
• The use of energy efficient locomotive technology.<br />
2<br />
Association of American <strong>Rail</strong>roads, <strong>Freight</strong> <strong>Rail</strong>roads Help Reduce Greenhouse Gas Emissions, November 2011.<br />
6-2<br />
<strong>Oklahoma</strong> <strong>Statewide</strong> <strong>Freight</strong> <strong>and</strong> <strong>Passenger</strong> <strong>Rail</strong> <strong>Plan</strong>
Impacts of <strong>Rail</strong> Transportation<br />
• The application of computer technology to control operations that maximize fuel<br />
efficiency of a single train <strong>and</strong> the fuel efficiency of the network by controlling<br />
train schedules—The technology also is designed to reduce delays in train operations,<br />
thus benefiting the railroads’ customers.<br />
• Reduced idling of locomotives—Technology is being used to turn off locomotive<br />
power when conditions permit.<br />
• The adoption of distributed power, a practice where locomotives are positioned<br />
in the middle <strong>and</strong> the end of trains <strong>and</strong> controlled by technology in the front<br />
locomotive—This practice reduces required horsepower <strong>and</strong> permits operation of<br />
longer trains.<br />
Quality of Life Impacts<br />
One important area that rail transportation has an impact on is roadway congestion.<br />
Nearly 278 million tons of freight is transported over <strong>Oklahoma</strong>’s rail network each year.<br />
A truck hauling freight between cities typically has an average capacity of 18 tons. If all the<br />
rail traffic were to move by truck, <strong>Oklahoma</strong>’s highways would see an additional 42,300<br />
trucks each day, 15.4 million trucks per year, without considering the movement of empty<br />
trucks.<br />
May 2012 6-3
7. Relationship of <strong>Oklahoma</strong>’s <strong>Freight</strong> <strong>Rail</strong><br />
System to the <strong>Oklahoma</strong> Economy<br />
OKLAHOMA<br />
STATEWIDE FREIGHT &<br />
PASSENGER RAIL PLAN<br />
This section describes the impacts of rail transportation on <strong>Oklahoma</strong> <strong>and</strong> how <strong>Oklahoma</strong>’s<br />
economy is affected by freight mobility. The key questions it addresses are<br />
• What are <strong>Oklahoma</strong>’s top rail-dependent industry sectors?<br />
• What is the economic geography of major rail-dependent industry sectors within<br />
<strong>Oklahoma</strong>; where are these industries distributed geographically?<br />
• What role does rail play in the supply chain for these industry sectors?<br />
• What is the contribution of rail-dependent sectors to the <strong>Oklahoma</strong> economy?<br />
• What do freight railroads contribute directly to the <strong>Oklahoma</strong> economy, in terms<br />
of employment, in-state purchases, <strong>and</strong> indirect <strong>and</strong> induced economic impacts?<br />
Defining <strong>and</strong> Measuring <strong>Freight</strong> <strong>Rail</strong> Importance<br />
<strong>Rail</strong> freight importance for <strong>Oklahoma</strong>’s industries may be measured in a number of ways:<br />
• In economic terms, by how much is spent on transportation as a share of the total<br />
output of industries<br />
• By the value of goods exported to the rest of the U.S. <strong>and</strong> the world on freight rail<br />
from <strong>Oklahoma</strong><br />
• By the volume <strong>and</strong> value of goods shipped by rail <strong>and</strong> other freight modes<br />
Economic measurement of freight transportation importance<br />
Describing overall freight transportation dependency, the USDOT <strong>and</strong> the Bureau of Economic<br />
Analysis (BEA) Transportation Satellite Account database provides national data<br />
on the per-dollar amount of industrial output that is spent on transporting each industry’s<br />
product. 1 Unfortunately, Transportation Satellite Account data are relatively outdated, having<br />
been developed in the 1990s. Since then, technologies, logistics practices, <strong>and</strong> industry<br />
structures have changed greatly. However, the Transportation Satellite Account database<br />
continues to provide valuable information about freight dependencies of different industry<br />
sectors.<br />
According to Transportation Satellite Account data, the industries with the greatest shares<br />
of direct transport requirements of industry output are natural resources <strong>and</strong> mining<br />
(21 percent), manufacturing (36 percent), <strong>and</strong> information (17 percent). In other words,<br />
to produce $1 of output, the mining industry requires 21 cents in transportation output.<br />
Of those industries, natural resources <strong>and</strong> mining rely heavily on rail, whereas manufacturing<br />
tends to use truck <strong>and</strong> the information industry relies on air.<br />
The TSA data shows that in-house transportation (i.e., transportation services that take<br />
place within non-transportation industries, such as proprietary fleets owned by major<br />
1<br />
www.bea.gov/industry/tourism_data.htm<br />
May 2012 7-1
Chapter 7<br />
retail chains) <strong>and</strong> for-hire transportation generated $121.5 billion <strong>and</strong> $191.6 billion of<br />
value added, 2 respectively. Together, this accounted for approximately 5 percent of U.S.<br />
gross domestic product (GDP) in 1992.<br />
Figure 7-1<br />
Transportation contribution to<br />
value added by major two-digit<br />
industry in cents per value<br />
added<br />
From a value-added perspective, Figure 7-1 summarizes the transportation share of<br />
industry output by the major two-digit industry sectors, as defined by the North American<br />
Industry Classification System (NAICS). NAICS codes have been developed from<br />
st<strong>and</strong>ard industrial classification codes to harmonize industry definitions among the U.S.,<br />
Canada, <strong>and</strong> other countries participating in<br />
the NAICS accounting protocols.<br />
Note: Total requirements, direct <strong>and</strong> indirect, per dollar<br />
of delivery to final dem<strong>and</strong>, at producers’ prices<br />
At an aggregate level, agriculture products,<br />
construction, <strong>and</strong> manufacturing are the<br />
most transport-dependent sectors. For<br />
example, transportation services contribute<br />
14.2 percent to the value added for the<br />
agriculture, forestry, <strong>and</strong> fisheries sector (i.e.,<br />
transportation adds about 14 percent to the<br />
value of all products sent to market by agriculture,<br />
forestry, <strong>and</strong> fishing enterprises).<br />
Of the key industries in <strong>Oklahoma</strong>, in terms of contribution to GSP, 3 agriculture <strong>and</strong> mining<br />
have the largest transportation value-added component (i.e., 14 cents <strong>and</strong> 8 cents for<br />
each $1 increase in dem<strong>and</strong>, respectively).<br />
Table 7-1 disaggregates further the two-digit sector dependencies by mode. As shown,<br />
trucking, which includes both motor freight <strong>and</strong> in-house transportation, comprises by<br />
far the largest share of transportation’s contribution to value added of any mode, followed<br />
by railroads.<br />
Volume as a measure of freight rail importance<br />
Generally, low-value commodities are moved in large volumes by the lower-cost rail<br />
or barge modes, while the higher-value products are typically transported by truck or<br />
intermodal rail or as air cargo. The containerized products are usually shipped over longer<br />
distances to or from a port or major intermodal transfer facility. The very-high-value<br />
goods are typically shipped by plane with trucks providing local connections.<br />
In 2009, 18.4 million tons of rail freight originated in <strong>Oklahoma</strong>. Of the rail freight originating<br />
in <strong>Oklahoma</strong>, 7.2 million tons (45 percent) were broken stone or riprap, 2.3 million<br />
tons (14 percent) were grain, <strong>and</strong> 1.4 million tons (9 percent) were fertilizer.<br />
2<br />
Value-added for an industry is the gross receipts of the firms in that industry minus the purchase of intermediate goods<br />
<strong>and</strong> services used. Output on the other h<strong>and</strong> simply represents the value of industry production <strong>and</strong> does not remove costs<br />
faced by the industry.<br />
3<br />
GSP measures the value of all goods <strong>and</strong> services produced in a state in a given year using the prices prevailing in that year,<br />
while real GSP is the value of all goods <strong>and</strong> services expressed in the prices of the base year. In evaluating the state economy<br />
over a period of time, real GSP is often used instead of GSP. This is because GSP can over-estimate the growth of the economy—the<br />
general increase in prices over time (inflation) can cause GSP to increase even if the volume of the state’s goods <strong>and</strong><br />
services produced remains unchanged. Real GSP growth is adjusted for inflation <strong>and</strong>, thus, a more accurate measure of how<br />
much the economy has grown in terms of output over a given period of time.<br />
7-2<br />
<strong>Oklahoma</strong> <strong>Statewide</strong> <strong>Freight</strong> <strong>and</strong> <strong>Passenger</strong> <strong>Rail</strong> <strong>Plan</strong>
Relationship of <strong>Oklahoma</strong>’s <strong>Freight</strong> <strong>Rail</strong> System to the <strong>Oklahoma</strong> Economy<br />
Agriculture,<br />
Forestry,<br />
<strong>and</strong><br />
Fisheries Mining Construction Manufacturing<br />
Communications<br />
<strong>and</strong> Utilities<br />
Wholesale<br />
<strong>and</strong> Retail<br />
Trade<br />
<strong>Rail</strong>roads 0.011 0.010 0.006 0.010 0.013 0.002<br />
Motor freight<br />
0.033 0.017 0.032 0.035 0.039 0.009<br />
transportation <strong>and</strong><br />
warehousing<br />
Water transportation 0.004 0.004 0.002 0.003 0.003 0.001<br />
Air transportation 0.006 0.005 0.005 0.008 0.005 0.006<br />
Pipelines, freight forwarders,<br />
0.004 0.002 0.003 0.006 0.004 0.002<br />
<strong>and</strong> related<br />
services<br />
State <strong>and</strong> local passenger<br />
0.001 0.001 0.001 0.001 0.001 0.0002<br />
transit<br />
In-house transportation<br />
0.085 0.038 0.073 0.027 0.016 0.046<br />
Total Transportation 0.14230 0.07853 0.12286 0.09078 0.08242 0.06605<br />
Example: for every $1 of final goods sold by the agriculture, forestry, <strong>and</strong> fisheries industries, $0.011 was spent on railroad transportation.<br />
Table 7-1<br />
TSA Transportation<br />
requirements for major goods<br />
moving industries two-digit<br />
level, by mode (cents per dollar<br />
of final dem<strong>and</strong>; excludes<br />
non-freight-oriented sectors,<br />
such as finance, insurance, <strong>and</strong><br />
real estate)<br />
These three commodities account<br />
for almost 70 percent of all rail<br />
freight that originated in <strong>Oklahoma</strong><br />
(Figure 7-2).<br />
In the same year, 36.1 million tons<br />
were shipped to <strong>Oklahoma</strong>. Of the<br />
rail freight terminating in <strong>Oklahoma</strong>,<br />
22.2 million tons were coal, making<br />
up 70 percent of all rail freight<br />
shipped into the state (Figure 7-3).<br />
<strong>Oklahoma</strong>’s Economy <strong>and</strong><br />
Key Industry Groups<br />
Source: WBS 2009<br />
<strong>Oklahoma</strong>’s economy has changed<br />
over the past two decades. The<br />
collapse of oil prices in the 1980s,<br />
with related slowdown of the state’s<br />
economy, has led <strong>Oklahoma</strong> to try to<br />
become less dependent on its natural Source: WBS 2009<br />
resource bases of energy <strong>and</strong> agriculture.<br />
However, in recent years with the introduction of new technologies (e.g. hydraulic<br />
fracturing) <strong>and</strong> rising prices, energy production has once again become an important part<br />
of the <strong>Oklahoma</strong> economy.<br />
Figure 7-2<br />
<strong>Rail</strong> freight originating in<br />
<strong>Oklahoma</strong>, commodity<br />
distribution (by tons)<br />
Figure 7-3<br />
<strong>Rail</strong> freight terminating<br />
in <strong>Oklahoma</strong>, commodity<br />
distribution (by tons)<br />
May 2012 7-3
Chapter 7<br />
Overview of <strong>Oklahoma</strong> economy<br />
Gross state product<br />
In 2010, the real GSP of <strong>Oklahoma</strong> was $133 billion (chained 2005 dollars) accounting<br />
for 1 percent of U.S. real GDP. The largest contributors in 2010 to <strong>Oklahoma</strong>’s real GSP, in<br />
order, were government (17.5 percent), manufacturing (11.3 percent), mining (10.9 percent),<br />
real estate (9.9 percent), retail trade (6.7 percent), health services (6.7 percent), <strong>and</strong><br />
wholesale trade (5.5 percent). The state’s real GSP increased at a compound annual growth<br />
rate (CAGR) of 1.9 percent from 2000 to 2010 <strong>and</strong> outpaced the nation’s GDP growth of<br />
1.6 percent over this same period (Figure 7-4).<br />
Figure 7-4<br />
U.S. gross domestic product <strong>and</strong><br />
<strong>Oklahoma</strong> gross state product<br />
(real millions of chained 2005 $)<br />
Source: U.S. Bureau of Economic Analysis<br />
Table 7-2<br />
Industry contribution to real<br />
gross state product<br />
Direction 2006 2007 2008 2009<br />
Oil <strong>and</strong> gas extraction 8.6% 8.8% 7.6% 10.2%<br />
Transportation <strong>and</strong> warehousing 3.3% 3.4% 3.4% 2.9%<br />
Military 2.2% 2.1% 2.0% 2.2%<br />
Agriculture, forestry, fishing, 1.5% 1.2% 1.3% 1.0%<br />
hunting<br />
Mining 0.2% 0.2% 0.2% 0.2%<br />
Totals 15.7% 15.6% 14.5% 16.4%<br />
Source: Bureau of Economic Analysis<br />
The BEA maintains a<br />
national database on<br />
economic contributions<br />
of various industries, by<br />
state, to real GSP. Statistics<br />
for <strong>Oklahoma</strong>’s<br />
transportation-intensive<br />
industries are shown in<br />
Table 7-2. Together, these<br />
sectors typically account for<br />
approximately 15 percent<br />
of <strong>Oklahoma</strong>’s real GSP. Oil<br />
<strong>and</strong> gas extraction, which accounted for 10.2 percent of <strong>Oklahoma</strong>’s 2010 GSP, is by far<br />
the sector with the greatest economic impact on the state’s economy. Further, as a share of<br />
state GDP, the oil <strong>and</strong> gas industry increased its share of <strong>Oklahoma</strong>’s real GSP by 1.6 percent<br />
between 2008 <strong>and</strong> 2009. Finally, over the past few years, not only has the percent that<br />
7-4<br />
<strong>Oklahoma</strong> <strong>Statewide</strong> <strong>Freight</strong> <strong>and</strong> <strong>Passenger</strong> <strong>Rail</strong> <strong>Plan</strong>
Relationship of <strong>Oklahoma</strong>’s <strong>Freight</strong> <strong>Rail</strong> System to the <strong>Oklahoma</strong> Economy<br />
oil <strong>and</strong> gas has contributed to <strong>Oklahoma</strong>’s GSP increased, so has its dollar contribution (in<br />
real terms), again in contrast with the other sectors in this report (Figure 7-5).<br />
Employment<br />
According to the U.S. Bureau of Labor Statistics, total non-farm employment in the State<br />
of <strong>Oklahoma</strong> has increased at a CAGR of 0.2 percent from 2001 to 2010, outpacing the<br />
nationwide CAGR of -0.2 percent over the same time. High oil prices <strong>and</strong> the expansion<br />
of the mining sector are partly responsible for the state’s higher employment growth, as is<br />
the state’s expansion of its service sectors (Figure 7-6).<br />
Figure 7-5<br />
Contribution to real gross<br />
state product by freight rail<br />
dependent industries<br />
Source: U.S. Bureau of Economic Analysis<br />
Figure 7-6<br />
Employment trends, U.S. <strong>and</strong><br />
<strong>Oklahoma</strong><br />
Source: U.S. Bureau of Labor Statistic<br />
May 2012 7-5
Chapter 7<br />
In 2010, 1.5 million individuals were employed in non-farm sectors of the <strong>Oklahoma</strong><br />
economy. The largest employer is government, followed by trade, transportation <strong>and</strong> utilities,<br />
education <strong>and</strong> health services, <strong>and</strong> professional <strong>and</strong> business services.<br />
In general, the economy of the West South Central Division of the U.S., which includes<br />
Texas, <strong>Oklahoma</strong>, Arkansas, <strong>and</strong> Louisiana, has done well measured by employment. Over<br />
the last two phases of the employment cycle,<br />
it ranked first in the nation, both losing relatively fewer jobs than other regions <strong>and</strong> gaining<br />
disproportionately more. While this region accounted for 11 percent of the nation’s<br />
employment before the recession, of jobs lost nationally, only 7 percent were located<br />
within this area, <strong>and</strong> post recession has captured 19.1 percent of the total national private<br />
sector job gains as of June 2011. While much of this trend has been driven by Texas,<br />
<strong>Oklahoma</strong> has followed a similar pattern in terms of job gains, most of which have come<br />
from manufacturing <strong>and</strong> energy-related activities.<br />
<strong>Oklahoma</strong>’s relative good fortune in terms of employment generation during what has<br />
been an uneven recovery can also be seen by its ranking in the top 10 states in three different<br />
measures of job recovery. In fact, the best performing states (including <strong>Oklahoma</strong>) are<br />
oil-producing states that have benefited from high oil prices (Figure 7-7).<br />
Figure 7-7<br />
Changes in employment over<br />
the last recession<br />
Source NY Times<br />
Key Industry Groups<br />
Energy<br />
Energy has been a strong economic driver in this region. According to the Federal<br />
Reserve’s most recent Beige Book, in the tenth district (which includes <strong>Oklahoma</strong>), the<br />
energy sector continued to exp<strong>and</strong> strongly in October <strong>and</strong> early November 2011, with<br />
7-6<br />
<strong>Oklahoma</strong> <strong>Statewide</strong> <strong>Freight</strong> <strong>and</strong> <strong>Passenger</strong> <strong>Rail</strong> <strong>Plan</strong>
Relationship of <strong>Oklahoma</strong>’s <strong>Freight</strong> <strong>Rail</strong> System to the <strong>Oklahoma</strong> Economy<br />
almost all respondents reporting an increase in drilling activity <strong>and</strong> an optimistic outlook<br />
for the future. The price of crude oil remains favorable for drilling, <strong>and</strong> the only constraints<br />
the industry faces are shortages of labor <strong>and</strong> equipment. This is despite the fact<br />
that during this period the district’s economy has only grown moderately overall.<br />
Oil <strong>and</strong> natural gas<br />
Oil <strong>and</strong> natural gas have been a staple<br />
of the <strong>Oklahoma</strong> state economy for<br />
many years. Historical boom periods<br />
have helped to drive the state’s<br />
economy beginning in the 1920s <strong>and</strong><br />
this continues through today. However,<br />
the boom <strong>and</strong> bust nature of oil<br />
<strong>and</strong> gas has made it an uncertain <strong>and</strong><br />
potentially unpredictable economic<br />
driver. Petroleum <strong>and</strong> gas are found<br />
in almost every county of <strong>Oklahoma</strong>,<br />
but the best pools have been around<br />
Tulsa, Seminole, <strong>Oklahoma</strong>, Healdton, Kingfisher, <strong>and</strong> Osage counties. Oil <strong>and</strong> gas production<br />
imposes specific dem<strong>and</strong>s on <strong>Oklahoma</strong>’s transportation system. While much of<br />
the petroleum <strong>and</strong> petroleum-refining products that is shipped from <strong>Oklahoma</strong> is moved<br />
by truck or pipeline, rail still has an important role to play. Natural gas is transmitted<br />
almost entirely by pipeline, but the rapid growth in natural gas extraction (as well as oil<br />
extraction from the Anadarko fields) provides both substantial potential opportunities as<br />
well as places dem<strong>and</strong>s on the rail system—dem<strong>and</strong>s such as the need to move large drilling<br />
<strong>and</strong> pipeline installation materials to sites throughout the state where both oil <strong>and</strong> gas<br />
extraction are rapidly exp<strong>and</strong>ing in scope.<br />
In 2009, the oil <strong>and</strong> gas sector contributed $13.4 billion to <strong>Oklahoma</strong>’s GSP (approximately<br />
10 percent) <strong>and</strong> employed 159,800 people. The oil <strong>and</strong> gas contribution to<br />
<strong>Oklahoma</strong> real GSP in chained 2005 dollars from 2006 through 2009 4 follows:<br />
• 2006—$10,853,000<br />
• 2007—$11,441,000<br />
• 2008—$10,078,000<br />
• 2009—$13,416,000<br />
Employment in the oil <strong>and</strong> gas sector from 2006 through 2010 5 follows:<br />
• 2006—134,500<br />
• 2007—146,200<br />
• 2008—160,500<br />
• 2009—159,800<br />
• 2010—158,900<br />
Current elevated prices for petroleum (Figure 7-8) <strong>and</strong> petroleum products, as well as<br />
new technologies for extracting these deposits (e.g., hydraulic fracturing), have resulted<br />
4<br />
U.S. Bureau of Economic Analysis<br />
5<br />
U.S. Bureau of Labor <strong>and</strong> Statistics<br />
May 2012 7-7
Chapter 7<br />
Figure 7-8<br />
Crude oil prices (real $, CPI<br />
adjusted 1982–1984 base)<br />
Source: U.S. EIA Short-Term Energy Outlook, November 2011<br />
in previously unprofitable ventures becoming attractive prospects. In <strong>Oklahoma</strong>, this has<br />
meant more activity in the Anadarko Basin as well as more oil coming in from the Bakken<br />
Shale deposits in Montana, North Dakota, <strong>and</strong> Saskatchewan.<br />
According to experts, approximately 200,000 barrels of oil per day could be obtained from the<br />
Anadarko Basin. However, transporation capacity is limited as no pipelines <strong>and</strong> only one rail<br />
line serve the basin. Additionally, a segment of this track is rated as excepted track <strong>and</strong> can only<br />
support trains limited to five partially loaded freight cars moving at less than 10 mph. This<br />
greatly constrains the current flow of oil out of the basin.<br />
A TIGER III grant was recently awarded for improvements to this line operated by<br />
Farmrail permitting heavier trains operating at higher speeds, thus increasing capacity.<br />
Upgrading the Farmrail line will be completed in 6 to 9 months. The short time required<br />
to upgrade the ilne is partly why the improvement is preferred to building a pipeline.<br />
Operation of this line has a direct benefit to the state. The line is owned by the state <strong>and</strong><br />
leased to Farmrail. Ten percent of Farmrail’s revenue from this line is turned over to the<br />
state as lease payments. This is an important revenue source to ODOT as lease revenues<br />
from other state-owned lines diminish as they revert to railroad ownership under the<br />
lease/purchase agreements. Farmrail also operates through Sayre, where there are already<br />
five companies that are or will shortly be using rail to transport oil <strong>and</strong> two companies<br />
receiving hydraulic fracturing s<strong>and</strong>.<br />
An increasingly important opportunity for railroads in the energy sector is transporting<br />
oil from the Bakken Shale deposits. Stroud, <strong>Oklahoma</strong> has become a delivery point<br />
for oil transported from the Bakken Shale deposit in North Dakota to Stroud, where it is<br />
transferred to a pipeline. <strong>Rail</strong> has become important to the movement of this oil because<br />
of limited pipeline capacity at the extraction locations. The oil is first moved by BNSF in<br />
unit tank trains <strong>and</strong> then delivered to the Stillwater Central, a short line providing the<br />
7-8<br />
<strong>Oklahoma</strong> <strong>Statewide</strong> <strong>Freight</strong> <strong>and</strong> <strong>Passenger</strong> <strong>Rail</strong> <strong>Plan</strong>
Relationship of <strong>Oklahoma</strong>’s <strong>Freight</strong> <strong>Rail</strong> System to the <strong>Oklahoma</strong> Economy<br />
connection to Stroud. From Stroud, the oil is piped to Cushing, which does not have rail<br />
service. WATCO, owner of Stillwater Central, <strong>and</strong> Kinder Morgan have a joint venture to<br />
construct <strong>and</strong> operate a new transfer terminal to exp<strong>and</strong> the existing rail-pipeline transfer<br />
capacity.<br />
Currently, outbound pipeline capacity at Cushing is significantly constrained resulting<br />
in a buildup of inventories in storage depressing oil prices. In response to this, some oil<br />
producers are now sending oil from the Bakken Shale region by rail straight to the Gulf<br />
of Mexico, where prices are higher. One plan to make Cushing oil more competitive, is to<br />
reverse the flow on one of the five pipelines, the Seaway pipeline that feeds Cushing from<br />
the Gulf of Mexico. Once it is reversed, the pipeline is expected to be able to ship an initial<br />
150,000 barrels of oil per day from Cushing to the Houston area.<br />
Figure 7-9<br />
Oil <strong>and</strong> gas deposits across<br />
<strong>Oklahoma</strong><br />
<strong>Oklahoma</strong> Geological Survey, Shale-Shaker March-April 2009<br />
Green energy<br />
Green energy sectors, while small, are increasing in importance The Edmund-based<br />
<strong>Oklahoma</strong> Municipal Power Authority’s wind turbines, at the <strong>Oklahoma</strong> Wind Energy<br />
Center northeast of Woodward, provide power for the Authority’s electric grid; the Bergey<br />
Wind Power Company in Norman is the world’s leading supplier of wind turbines. Virtually<br />
all of <strong>Oklahoma</strong> west of I-35 has the potential to support substantial wind generating<br />
capacity, with the greatest opportunity just east of the panh<strong>and</strong>le. The current operations<br />
contributed to <strong>Oklahoma</strong>’s ranking of eighth among the states in wind-generating<br />
May 2012 7-9
Chapter 7<br />
potential. Some modern wind turbines are 236 feet tall with rotor blades that are roughly<br />
82 feet long. Future windmills are expected to reach 328 feet <strong>and</strong> have blades measuring<br />
164 feet long. Transportation of wind turbine parts, such as towers <strong>and</strong> blades, will require<br />
the movement of over-weight <strong>and</strong> over-sized loads, affecting both capacity <strong>and</strong> saety of<br />
the <strong>Oklahoma</strong> highway system. ODOT has initiated programs to increase bridge clearances<br />
<strong>and</strong> improve its over-weight <strong>and</strong> over-height permitting process. Regardless, the<br />
freight railroads can provide an alternative to moving these large loads over the highways.<br />
Minerals <strong>and</strong> mining (excluding oil <strong>and</strong> natural gas)<br />
<strong>Oklahoma</strong>’s mining economy (excluding oil <strong>and</strong> natural gas) has been in decline but<br />
remains important to selected parts of the state. In total, mined minerals contributed<br />
approximately $268 million 6 (real chained 2005 $) to <strong>Oklahoma</strong>’s GSP in 2009 <strong>and</strong> approximately<br />
2,000 direct mining jobs.<br />
Mined minerals include gypsum, granite, limestone, aggregates, crushed stone, cement<br />
s<strong>and</strong> <strong>and</strong> gravel, clay, glass s<strong>and</strong>, salt feldspar, iodine, lime, pumice, tripoli (used as an<br />
abrasive), <strong>and</strong> coal. The most shipped commodities in this category are (1) coal <strong>and</strong><br />
(2) the granular construction materials (aggregate, crushed stone, s<strong>and</strong>, <strong>and</strong> gravel).<br />
Aggregates, crushed stone, s<strong>and</strong>, <strong>and</strong> gravel<br />
Construction materials (e.g., aggregates, crushed stone, s<strong>and</strong>, <strong>and</strong> gravel) <strong>and</strong> cement are<br />
important products extracted in southern parts of the state, such as Ardmore <strong>and</strong> Durant.<br />
Although a bulk commodity conducive to shipping by rail, the short distances shipped<br />
result in rail having a lower-than-expected participation in this market. Approximately<br />
10 percent of gravel, 9 percent of non-metallic mineral, <strong>and</strong> 6 percent of s<strong>and</strong> shipments<br />
originating in <strong>Oklahoma</strong> move by rail. These are principally the longer-distance shipments<br />
into Texas.<br />
Fertilizers <strong>and</strong> chemicals<br />
Natural gas is the major source of energy used to produce nitrogen fertilizer. Therefore,<br />
domestic fertilizer production tends to be concentrated in regions rich in natural gas—the<br />
Mississippi Delta, the Texas panh<strong>and</strong>le, <strong>and</strong> <strong>Oklahoma</strong>. Major fertilizer production facilities<br />
in <strong>Oklahoma</strong> are located in Woodward, Verdigris, <strong>and</strong> Enid. Fertilizer <strong>and</strong> chemical<br />
production is an important part of the <strong>Oklahoma</strong> economy, contributing $581 million<br />
(real chained 2005 $) to real GSP in 2009. The fertilizer <strong>and</strong> chemical production contribution<br />
to <strong>Oklahoma</strong> real GSP in chained 2005 dollars from 2006 through 2009 7 follows:<br />
• 2006—$446,000,000<br />
• 2007—$633,000,000<br />
• 2008—$679,000,000<br />
• 2009—$581,000,000<br />
<strong>Oklahoma</strong>’s fertilizer output is, by <strong>and</strong> large, destined for other Midwest states. Kansas,<br />
Nebraska, <strong>and</strong> Colorado are all significant recipients of <strong>Oklahoma</strong>-produced fertilizer.<br />
6<br />
Based on Bureau of Economic Analysis statistics; U.S. Geological Survey estimates the value to be in excess of $800 million.<br />
7<br />
U.S. Bureau of Economic Analysis<br />
7-10<br />
<strong>Oklahoma</strong> <strong>Statewide</strong> <strong>Freight</strong> <strong>and</strong> <strong>Passenger</strong> <strong>Rail</strong> <strong>Plan</strong>
Agriculture<br />
Relationship of <strong>Oklahoma</strong>’s <strong>Freight</strong> <strong>Rail</strong> System to the <strong>Oklahoma</strong> Economy<br />
<strong>Oklahoma</strong> is one of the nation’s largest producers of livestock <strong>and</strong> wheat; it generated<br />
$5.8 billion of agricultural products in 2007.<br />
Over the past decade, the state’s agricultural sector has become increasingly diversified.<br />
While it has historically been dominated by wheat <strong>and</strong> cattle production, the pork <strong>and</strong><br />
poultry industries have increased rapidly in recent years, making <strong>Oklahoma</strong> the nation’s<br />
second <strong>and</strong> third largest producers of the respective commodities.<br />
The 2007 National Agriculture<br />
Statistics Survey found there were<br />
approximately 86,500 farms in <strong>Oklahoma</strong>,<br />
a slight increase over 1997<br />
when 84,000 farms were in operation.<br />
Similarly, farm acreage over this time<br />
has remained relatively unchanged.<br />
Despite the relative stability of the<br />
size of <strong>Oklahoma</strong> agriculture, the<br />
industry as a whole has been changing<br />
in terms of structure. It has been<br />
shifting away from small independent<br />
farming to large corporate-based<br />
farming. In addition to the directly owned <strong>and</strong> operated agribusiness enterprises, many<br />
small farms contract with large agribusiness firms <strong>and</strong> can, therefore, be viewed as virtual<br />
extensions of these enterprises.<br />
Grain is the dominant agricultural rail export <strong>and</strong> import of <strong>Oklahoma</strong>. To underst<strong>and</strong><br />
the role that rail plays in grain movement, it is important to underst<strong>and</strong> the grain supply<br />
chain.<br />
Grain supply chain<br />
The grain supply chain is made up of three distinct links—elevators, milling, <strong>and</strong> baking.<br />
Grain elevators serve two purposes. First, they act as a central location or mechanism<br />
for accumulating <strong>and</strong> combining the wheat production of multiple famers; second, they<br />
provide storage since wheat is a seasonal commodity. Over time there have been dramatic<br />
changes to U. S. grain transportation, much of which has been driven by changes in the<br />
rail industry—ab<strong>and</strong>onment of rail lines serving the agriculture hinterl<strong>and</strong>s, adoption<br />
of multiple railcar grain rates encouraging large shipment sizes, energy considerations,<br />
<strong>and</strong> other technological advancements. The result has put pressure on elevators to attain<br />
greater <strong>and</strong> greater levels of efficiency. 8 For example, BNSF began offering incentives to<br />
customers who were able to ship in trainload quantities <strong>and</strong> for loading <strong>and</strong> releasing the<br />
empty cars of dedicated grain trains, or shuttles, quickly. This has led some grain elevators<br />
in turn to invest in additional grain h<strong>and</strong>ling capacity to meet shuttle rate performance<br />
requirements set forth by BNSF. This places non-shuttle elevators at a disadvantage <strong>and</strong>,<br />
8<br />
Barber, Jason, Titus, <strong>and</strong> Matthew, “Structure of the U.S. Wheat Supply Chain,” UGPTI Staff Paper No. 131, December<br />
1995.<br />
May 2012 7-11
Chapter 7<br />
increasingly, such elevators have gone out of business as they are no longer able to compete.<br />
9 Figure 7-10 is a map of shuttle train loading facilities <strong>and</strong> routes in <strong>Oklahoma</strong>.<br />
The next link in the wheat supply chain is milling, which is the process of grinding <strong>and</strong><br />
sifting wheat into flour for baked goods, <strong>and</strong> mill feeds, which is sold as animal feed.<br />
Because of changes in rail transportation, new mills have generally been built near population<br />
centers, whereas historically mills where located near wheat growing areas. Two<br />
technological innovations drove this shift. The first innovation was the introduction of<br />
multiple car, or unit train, technology that provided transportation cost incentive to ship<br />
larger quantities at a given time. Bakers do not typically require large amounts of flour<br />
nor do they wish to hold large amounts in inventory. The result is that large quantities<br />
of wheat are shipped to mills located near areas with high dem<strong>and</strong> for flour. The second<br />
innovation was the enhanced hopper car that reduced the costs of bulk wheat shipments.<br />
Similar to grain elevators, the number of U.S. mills has decreased over the years. Mill<br />
ownership has shifted from single-plant firms that were family owned <strong>and</strong> managed to<br />
large multi-plant corporations that often have agribusiness interests other than milling.<br />
The next part of the supply chain is baking. However, rail has little to no role once the<br />
wheat reaches this stage for two reasons: first, as previously discussed, mills are now<br />
located close to the dem<strong>and</strong> for flour, <strong>and</strong> second, the outputs of this stage are often perishable<br />
<strong>and</strong> ill suited to rail travel.<br />
Figure 7-10<br />
<strong>Oklahoma</strong> grain shuttles by<br />
rail line<br />
Source: Blaszak, Michael, “Your Next Meal Starts Here, Grains Special,” Trains Magazine, April 2009.<br />
<strong>Rail</strong> traffic<br />
Agricultural traffic is a significant contributor to freight rail revenues. According to annual<br />
reports by the seven major North American railroads, even though agricultural products<br />
only comprised 9 percent of all revenue tons, they accounted for 13 percent of total revenues,<br />
<strong>and</strong> the curve is trending upward.<br />
Farm products <strong>and</strong> food/kindred products are among the top five commodities shipped<br />
to, from, <strong>and</strong> within <strong>Oklahoma</strong> <strong>and</strong> are projected to remain in the top five through<br />
2020. Grain is the largest category of farm products by weight shipped from <strong>Oklahoma</strong><br />
(4.8 million tons); 90 percent of <strong>Oklahoma</strong>’s grain exports are carried by rail. While grain<br />
was exported to all domestic regions, the primary destinations include Texas, Colorado,<br />
9<br />
Blaszak, Michael, “Your Next Meal Starts Here, Grains Special,” Trains Magazine, April 2009.<br />
7-12<br />
<strong>Oklahoma</strong> <strong>Statewide</strong> <strong>Freight</strong> <strong>and</strong> <strong>Passenger</strong> <strong>Rail</strong> <strong>Plan</strong>
Relationship of <strong>Oklahoma</strong>’s <strong>Freight</strong> <strong>Rail</strong> System to the <strong>Oklahoma</strong> Economy<br />
Kansas, <strong>and</strong> Nebraska. Currently, the majority of <strong>Oklahoma</strong>’s agriculture products are<br />
commodity-like products, such as grain, meaning that little of it is perishable. Thus, these<br />
products can be shipped via rail without risking spoilage or the high costs of shipping<br />
frozen items.<br />
If <strong>Oklahoma</strong> moves into value-added food processing, less rail transport will be used<br />
<strong>and</strong> there will be more reliance on trucks. Value-added food processing produces goods<br />
of higher value than raw agricultural products. For some time, most of the value-added<br />
products produced from <strong>Oklahoma</strong> farms have been processed outside the state. A switch<br />
to higher value <strong>and</strong> perishable foods will require a shift toward the more expensive but<br />
time-reliable trucks. Increasingly, efficient supply chain systems, including efficient truck<br />
distribution systems <strong>and</strong> even potentially air transport of highly perishable or high-cost<br />
specialty food items, could come more to the fore.<br />
Military<br />
Department of Defense installations<br />
Five major USDOD installations are located in <strong>Oklahoma</strong>, as shown in Figure 7-11. Each<br />
installation has a rail connection, but only Fort Sill in Lawton <strong>and</strong> the McAlester Army<br />
Ammunition Depot in McAlester regularly use rail transportation. The other three installations,<br />
all air force bases, have discontinued use of rail, but are positioned to re-activate<br />
rail service if MTMC decides service is warranted.<br />
• McAlester Army Ammunition Depot—This facility in McAlester relies on<br />
freight rail service to ensure its mission critical performance objectives are met.<br />
The facility is served by UP <strong>and</strong> is directly connected to the railroad’s mainline.<br />
This facility has a second rail gate located on its north border, but is currently not<br />
operational. McAlester officials would this section of railroad placed back into<br />
service to provide a backup connection to the rail network.<br />
• Fort Sill—Located in Lawton, Fort Sill has a direct connection to both UP <strong>and</strong><br />
the Stillwater Central <strong>Rail</strong>road. It actively uses freight rail service, <strong>and</strong> they<br />
recently installed a wye track 10 on the base that has greatly enhanced rail operating<br />
flexibility.<br />
• Tinker Air Force Base—Tinker AFB in <strong>Oklahoma</strong> City is located at the end of<br />
a state-owned rail line that is a c<strong>and</strong>idate for commuter rail service. Tinker AFB<br />
also recently leased the nearby former General Motors <strong>Plan</strong>t. The facility has an<br />
extensive rail network with a connection to the BNSF north-south mainline track<br />
through central <strong>Oklahoma</strong>.<br />
• Vance Air Force Base—Vance AFB in Enid has discontinued rail service to the<br />
installation, but it is adjacent to multiple active railroads, including BNSF, UP, <strong>and</strong><br />
the Grainbelt <strong>Rail</strong>road.<br />
• Altus Air Force Base—Altus AFB in Altus has discontinued its rail service to the<br />
facility.<br />
Because of the strategic importance of rail service to the military, especially in the event<br />
of a significant mobilization, ODOT supports retaining the rail infrastructure even if<br />
currently inactive. <strong>Rail</strong> routes in <strong>Oklahoma</strong> are part of STRACNET, a function of the<br />
10<br />
Wye tracks are configurations that permit a train to be turned around <strong>and</strong> travel in the opposite direction.<br />
May 2012 7-13
Chapter 7<br />
Figure 7-11<br />
Strategic <strong>Rail</strong> Corridor Network<br />
<strong>Rail</strong>roads for National Defense. Both Fort Sill <strong>and</strong> the McAlester Army Ammunition<br />
Depot are connected to STRACNET, while Vance Air Force Base, Altus Air Force Base,<br />
<strong>and</strong> Tinker Air Force Base all have the capability to reconnect to STRACNET should the<br />
need arise.<br />
Under its <strong>Rail</strong>roads <strong>and</strong> Highways for National Defense Program, USDOD, with the support<br />
of USDOT, ensures the nation’s rail <strong>and</strong> highway infrastructure can support defense<br />
emergencies. STRACNET consists of 38,800 miles of rail lines important to national<br />
7-14<br />
<strong>Oklahoma</strong> <strong>Statewide</strong> <strong>Freight</strong> <strong>and</strong> <strong>Passenger</strong> <strong>Rail</strong> <strong>Plan</strong>
Relationship of <strong>Oklahoma</strong>’s <strong>Freight</strong> <strong>Rail</strong> System to the <strong>Oklahoma</strong> Economy<br />
defense <strong>and</strong> provides service to 193 defense installations whose mission requires rail<br />
service.<br />
The military places heavy <strong>and</strong> direct reliance on railroads to integrate bases <strong>and</strong> connect<br />
installations predominantly to ocean ports of embarkation. Mainlines, connecting<br />
lines, <strong>and</strong> high/wide clearance lines must all combine to support movement of heavy <strong>and</strong><br />
oversized equipment. To ensure that military needs are considered in railroad company<br />
decisions that may affect national defense, the USDOD relies on the MTMC. In this<br />
capacity, MTMC identifies facilities of the railroad infrastructure important to national<br />
defense, informs the commercial <strong>and</strong> civil sectors of defense needs, <strong>and</strong> encourages the<br />
retention <strong>and</strong> upkeep of railroad assets vital to support military movements.<br />
In addition to identifying key lines <strong>and</strong> facilities, MTMC also conducts analysis of<br />
potential railroad industry construction, mergers, bankruptcies, <strong>and</strong> ab<strong>and</strong>onments to<br />
determine how any of these actions may affect USDOD mobility capabilities. Since 1976,<br />
MTMC has reviewed more than 2,100 ab<strong>and</strong>onments affecting 33,000 miles of track, as<br />
well as eight bankruptcies affecting one-third of the nation’s railroad network. MTMC<br />
analysis <strong>and</strong> reviews are the main source of USDOD input to the railroad industry in<br />
attempts to preclude the loss of critical facilities or track sections essential to effective<br />
movement of heavy military lift requirements.<br />
The <strong>Rail</strong>roads for National Defense Program ensures the readiness capability of the<br />
national railroad network to support defense deployment <strong>and</strong> peacetime needs. The Program<br />
works to integrate defense rail needs into civil sector planning affecting the nation’s<br />
railroad system.<br />
MTMC’s Transportation Engineering Agency works with state DOTs <strong>and</strong> other stakeholders<br />
to protect railroad infrastructure. Among these stakeholders are the AAR, STB,<br />
American <strong>Rail</strong>way Engineering <strong>and</strong> Maintenance of Way Association, <strong>Rail</strong>way Industrial<br />
Clearance Association, FRA, <strong>and</strong> individual railroad companies.<br />
FRA has defined a core rail system known as Principal <strong>Rail</strong>road Lines. These rail lines<br />
have the following attributes—Amtrak service, national defense essential, or annual<br />
freight volumes exceeding 20 million gross ton-miles per mile. An advantage of STRAC-<br />
NET over other transport modes is the ability of these lines to transport over-size (high/<br />
wide) loads.<br />
<strong>Freight</strong> <strong>Rail</strong> Employment, Earnings, <strong>and</strong> Multiplier Effects<br />
<strong>Oklahoma</strong> is served by 21 railroads. These companies employ approximately 1,770<br />
<strong>Oklahoma</strong>ns, the vast majority of which (84 percent) work for one of the three Class I<br />
railroads in the state—BNSF (55 percent), UP (19 percent), <strong>and</strong> KCS (10 percent). In<br />
2010, the combined payroll of all 21 companies totaled approximately $115.8 million; that<br />
year they also spent roughly $15.1 million on in-state purchases <strong>and</strong> $6 million on capital<br />
improvements within <strong>Oklahoma</strong>. This employment <strong>and</strong> spending by the railroads has not<br />
only direct impacts on the <strong>Oklahoma</strong> economy but also produces indirect <strong>and</strong> induced<br />
impacts. Induced impacts stem from the re-spending of wages earned by workers benefiting<br />
from both direct <strong>and</strong> indirect activity of the industry (e.g., those employed by the<br />
May 2012 7-15
Chapter 7<br />
railroads directly as well as those employed by companies who provide goods <strong>and</strong> services<br />
to the railroads). For example, an employee of the railroad receives a salary that he or she<br />
then uses to make purchases, pay bills, etc., <strong>and</strong> this further contributes to the <strong>Oklahoma</strong><br />
economy. Thus, the direct employment/payroll, spending, <strong>and</strong> investment by the freight<br />
railroad industry in <strong>Oklahoma</strong> are conservative estimates of the contribution of freight<br />
rail industry to the state’s economy.<br />
<strong>Oklahoma</strong> <strong>Rail</strong> Commodity Flows<br />
<strong>Oklahoma</strong>’s rail network carries a wide variety of products critical to the state <strong>and</strong> the<br />
national economy. This section describes the <strong>Oklahoma</strong> rail traffic base <strong>and</strong> the rail network<br />
from the perspective of key freight rail commodities. Data presented in this section<br />
are drawn from the 2009 STB <strong>Rail</strong> Waybill Sample for the State of <strong>Oklahoma</strong>.<br />
Overview of <strong>Oklahoma</strong>’s freight rail traffic flows<br />
In 2009, over 278 million tons <strong>and</strong> over 46 million carloads of rail freight moved through<br />
the <strong>Oklahoma</strong> rail network. Figure 7-12 depicts the concentrations of rail traffic on the<br />
various lines.<br />
A mapping of rail flows in <strong>Oklahoma</strong> shows most rail traffic in the state moves in a northsouth<br />
direction over five Class I mainlines:<br />
• BNSF line in the far western part of the state through Boise City, part of the BNSF<br />
route between the Powder River Basin <strong>and</strong> Texas<br />
• BNSF west-central <strong>Oklahoma</strong> line through Woodward/Alva, part of the east-west<br />
Transcon<br />
• BNSF line through <strong>Oklahoma</strong> City, the former Santa Fe line between Kansas City<br />
<strong>and</strong> Fort Worth, which is part of the MidCon traffic lane<br />
• UP mainline in eastern <strong>Oklahoma</strong> through Muskogee/Durant, the former Katy<br />
line Kansas City to Dallas<br />
Figure 7-12<br />
<strong>Rail</strong> traffic flows on <strong>Oklahoma</strong>’s<br />
rail network<br />
Source: 2009 Surface Transportation Board <strong>Rail</strong> Waybill Sample<br />
7-16<br />
<strong>Oklahoma</strong> <strong>Statewide</strong> <strong>Freight</strong> <strong>and</strong> <strong>Passenger</strong> <strong>Rail</strong> <strong>Plan</strong>
Relationship of <strong>Oklahoma</strong>’s <strong>Freight</strong> <strong>Rail</strong> System to the <strong>Oklahoma</strong> Economy<br />
• KCS mainline in far eastern <strong>Oklahoma</strong> through Sallisaw connecting Kansas City<br />
<strong>and</strong> the Gulf ports<br />
Some of the east-west intermodal 11 traffic on the BNSF Transcon also uses the route<br />
through Tulsa to reach destinations in Memphis <strong>and</strong> Birmingham.<br />
As shown in Table 7-3, a vast majority of this freight is through traffic that neither<br />
originated nor terminated in <strong>Oklahoma</strong>. This traffic is predominately coal, grain, <strong>and</strong><br />
intermodal containers or trailers. Together, these commodities make up over 65 percent of<br />
the state’s through rail traffic (Table 7-4).<br />
Inbound, outbound, <strong>and</strong> local <strong>Oklahoma</strong> freight rail flows<br />
Eighteen of <strong>Oklahoma</strong>’s rail traffic, approximately 49 million tons, either originates or<br />
terminates within the state. Unlike through (also termed overhead) rail freight, which<br />
simply passes through the state, this traffic is both driven by <strong>and</strong> has a direct impact on<br />
Direction<br />
Tons<br />
(thous<strong>and</strong>s)<br />
Percent<br />
Units<br />
(thous<strong>and</strong>s)<br />
Percent<br />
Through 229,043 82% 4,905 91%<br />
Inbound 31,704 11% 297 6%<br />
Outbound 16,006 6% 165 3%<br />
Local 1,636 1% 17 0%<br />
Total 278,389 100% 5,384 100%<br />
Source: 2009 Surface Transportation Board <strong>Rail</strong> Waybill Sample<br />
Table 7-3<br />
<strong>Rail</strong> traffic in <strong>Oklahoma</strong> by<br />
traffic type<br />
STCC Commodity<br />
Tons<br />
(thous<strong>and</strong>s)<br />
Percent<br />
Total<br />
11 21 Bituminous coal 92,337 40.3%<br />
46 11 Fak shipments 29,859 13.0%<br />
01 13 Grain 28,128 12.3%<br />
28 18 Miscellaneous industrial organic chemicals 6,002 2.6%<br />
01 14 Oil kernels, nuts, or seeds 5,324 2.3%<br />
28 21 Plastic matter or synthetic fibers 5,258 2.3%<br />
28 12 Potassium or sodium compound 5,023 2.2%<br />
20 92 Soybean oil or by-products 5,002 2.2%<br />
20 46 Wet corn milling or milo 3,808 1.7%<br />
20 42 Prepared or canned feed 3,628 1.6%<br />
All other 44,675 19.5%<br />
Total Tons 229,043 100.0%<br />
Source: 2009 Surface Transportation Board <strong>Rail</strong> Waybill Sample<br />
STCC = St<strong>and</strong>ard Transportation Commodity Code<br />
Table 7-4<br />
<strong>Oklahoma</strong> rail traffic through<br />
traffic commodity mix<br />
11<br />
Intermodal traffic consists of shipping containers or highway trailers. The goods shipped can vary greatly but tend toward<br />
high-value goods, such as manufactured products.<br />
May 2012 7-17
Chapter 7<br />
<strong>Oklahoma</strong>’s economy. Originating rail traffic reflects the production sectors of the economy.<br />
Terminating traffic meets the dem<strong>and</strong>s of the state’s consumers as well as feeds the<br />
state’s industries. Almost two thirds of the non-through traffic terminates in <strong>Oklahoma</strong>,<br />
making it a consumer of rail shipped products (Table 7-5). The remaining one-third of the<br />
non-through traffic originates with <strong>Oklahoma</strong> products.<br />
Table 7-5<br />
<strong>Oklahoma</strong> rail traffic<br />
categories—excludes overhead<br />
traffic<br />
Direction<br />
Tons<br />
(thous<strong>and</strong>s)<br />
Percent<br />
Total<br />
Inbound 31,704 64%<br />
Outbound 16,006 32%<br />
Local 1,636 3%<br />
Table 7-6 shows the top ten inbound rail<br />
commodities, which account for more<br />
than 90 percent of the state’s inbound<br />
rail traffic. Coal <strong>and</strong> grain constitute<br />
almost 80 percent of the state’s rail<br />
terminations.<br />
Total 49,345 100%<br />
Given that the traffic statistics are for<br />
Source: 2009 Surface Transportation Board<strong>Rail</strong> Waybill Sample<br />
2009, most traffic numbers are less<br />
than moving today resulting from the<br />
economic conditions following the recent recession. The petroleum volume understates<br />
current traffic as it does not include crude petroleum being shipped into <strong>Oklahoma</strong> from<br />
the Dakotas, a growing business for the railroads. Only recently has a significant volume<br />
of oil been shipped by rail into <strong>Oklahoma</strong> for transfer to pipeline.<br />
Table 7-6<br />
<strong>Oklahoma</strong> inbound rail<br />
traffic—commodity mix<br />
STCC Commodity<br />
Tons<br />
(thous<strong>and</strong>s)<br />
Percent<br />
Total<br />
11 21 Bituminous coal 22,194 70.0%<br />
01 13 Grain 2,545 8.0%<br />
24 11 Primary forest materials 736 2.3%<br />
20 92 Soybean oil or by-products 641 2.0%<br />
33 12 Primary iron or steel products 621 2.0%<br />
14 41 Gravel or s<strong>and</strong> 607 1.9%<br />
28 21 Plastic matter or synthetic fibers 460 1.5%<br />
13 11 Crude petroleum 426 1.3%<br />
24 21 Lumber or dimension stock 284 0.9%<br />
28 12 Potassium or sodium compound 281 0.9%<br />
All other 2,910 9.2%<br />
Total Tons 31,704 100.0%<br />
Source: 2009 Surface Transportation Board <strong>Rail</strong> Waybill Sample<br />
STCC = St<strong>and</strong>ard Transportation Commodity Code<br />
<strong>Rail</strong> shipments originating in <strong>Oklahoma</strong> are more diversified than terminations. Table 7-7<br />
shows the top ten originating rail commodities in <strong>Oklahoma</strong> by a 4-digit St<strong>and</strong>ard Transportation<br />
Commodity Code (STCC). Although the leading ten commodities account for<br />
90 percent of outbound rail tonnage, as with inbound traffic, greater diversification among<br />
the principal ten rail-transported products exists with stone, grain, <strong>and</strong> fertilizers being<br />
the leading commodities. Stone shipments alone constitute 45 percent of all originations.<br />
7-18<br />
<strong>Oklahoma</strong> <strong>Statewide</strong> <strong>Freight</strong> <strong>and</strong> <strong>Passenger</strong> <strong>Rail</strong> <strong>Plan</strong>
Relationship of <strong>Oklahoma</strong>’s <strong>Freight</strong> <strong>Rail</strong> System to the <strong>Oklahoma</strong> Economy<br />
STCC Commodity<br />
Tons<br />
(thous<strong>and</strong>s)<br />
Percent<br />
Total<br />
14 21 Broken stone or riprap 7,148 44.7%<br />
01 13 Grain 2,334 14.6%<br />
28 71 Fertilizers 1,401 8.8%<br />
26 31 Fiber, paper, or pulpboard 791 4.9%<br />
14 41 Gravel or s<strong>and</strong> 758 4.7%<br />
29 11 Petroleum refining products 658 4.1%<br />
28 19 Miscellaneous industrial inorganic chemicals 510 3.2%<br />
14 91 Miscellaneous nonmetallic minerals, nec 277 1.7%<br />
29 91 Miscellaneous coal or petroleum products 260 1.6%<br />
40 21 Metal scrap or tailings 225 1.4%<br />
All other 1,643 10.3%<br />
Total Tons 16,006 100.0%<br />
Source: 2009 Surface Transportation Board <strong>Rail</strong> Waybill Sample<br />
STCC = St<strong>and</strong>ard Transportation Commodity Code<br />
Table 7-7<br />
<strong>Oklahoma</strong> outbound rail<br />
traffic—commodity mix<br />
Combined with grain <strong>and</strong> fertilizer, these three commodities make up almost 70 percent<br />
of all rail tons originating in <strong>Oklahoma</strong>. Table 7-8 shows major local rail commodities in<br />
<strong>Oklahoma</strong> (i.e. rail shipments both originating <strong>and</strong> terminating within the state). Local<br />
<strong>Oklahoma</strong> rail traffic is primarily bulk stone, gravel, <strong>and</strong> cement.<br />
<strong>Oklahoma</strong>’s rail commodity networks<br />
<strong>Oklahoma</strong>’s rail traffic is primarily composed of five major commodities—coal, grain,<br />
stone, petroleum, <strong>and</strong> fertilizers. Eighty percent of the state’s originating or terminating<br />
rail traffic is in one of these five commodity categories.<br />
Coal<br />
Coal is produced in <strong>Oklahoma</strong> but not in large quantities. In 2010, 1.4 million tons of<br />
bituminous coal was mined in seven counties of eastern <strong>Oklahoma</strong>. Consequently, most<br />
coal traffic moving in the state is from out-of-state mines. Much is overhead traffic passing<br />
through the state to other destinations; some terminates in the state. Figure 7-13 shows<br />
the flow of this traffic over the <strong>Oklahoma</strong> rail network. Flows are concentrated along the<br />
eastern <strong>Oklahoma</strong> UP mainline to coal-burning utility plants near Muskogee. Not surprisingly,<br />
the majority of coal traffic originates in the producing regions of Colorado <strong>and</strong> the<br />
Wyoming Powder River Basin (Figure 7-14).<br />
Stone<br />
Stone, gravel, <strong>and</strong> s<strong>and</strong> (STCC codes 14 21 <strong>and</strong> 14 41) are the major outbound <strong>and</strong> local<br />
rail commodities in <strong>Oklahoma</strong>, constituting half of all state rail originations. Figure 7-15<br />
shows the <strong>Oklahoma</strong> rail network for these products. The major stone flow in <strong>Oklahoma</strong><br />
is south from Atoka on the UP mainline to Texas. The principal movement of stone is in<br />
southeast <strong>Oklahoma</strong>. Other flows include movements between Tulsa <strong>and</strong> Johnson County<br />
May 2012 7-19
Chapter 7<br />
Table 7-8<br />
<strong>Oklahoma</strong> local rail traffic—<br />
commodity mix<br />
STCC<br />
Commodity<br />
Tons<br />
(thous<strong>and</strong>s)<br />
Percent<br />
Total<br />
14 21 Broken stone or riprap 979 59.9%<br />
14 41 Gravel or s<strong>and</strong> 288 17.6%<br />
32 41 Portl<strong>and</strong> cement 130 8.0%<br />
29 91 Miscellaneous coal or petroleum products 56 3.4%<br />
28 71 Fertilizers 44 2.7%<br />
29 11 Petroleum refining products 38 2.3%<br />
01 13 Grain 25 1.5%<br />
24 11 Primary forest materials 23 1.4%<br />
32 95 Nonmetal minerals, processed 15 0.9%<br />
33 12 Primary iron or steel products 8 0.5%<br />
28 19 Miscellaneous industrial inorganic chemicals 7 0.4%<br />
26 31 Fiber, paper, or pulpboard 5 0.3%<br />
37 42 <strong>Rail</strong>road cars 4 0.3%<br />
20 85 Distilled or blended liquors 4 0.2%<br />
40 29 Miscellaneous waste or scrap 3 0.2%<br />
28 18 Miscellaneous industrial organic chemical 3 0.2%<br />
26 11 Pulp or pulp mill products 3 0.2%<br />
Total Tons 1,636 100.0%<br />
Source: 2009 Surface Transportation Board <strong>Rail</strong> Waybill Sample<br />
STCC = St<strong>and</strong>ard Transportation Commodity Code<br />
Figure 7-13<br />
Coal rail traffic flows on<br />
<strong>Oklahoma</strong>’s rail network<br />
Source: 2009 Surface Transportation Board <strong>Rail</strong> Waybill Sample<br />
7-20<br />
<strong>Oklahoma</strong> <strong>Statewide</strong> <strong>Freight</strong> <strong>and</strong> <strong>Passenger</strong> <strong>Rail</strong> <strong>Plan</strong>
Relationship of <strong>Oklahoma</strong>’s <strong>Freight</strong> <strong>Rail</strong> System to the <strong>Oklahoma</strong> Economy<br />
Figure 7-14<br />
BEA origins of <strong>Oklahoma</strong>’s<br />
inbound rail coal traffic<br />
Source: 2009 Surface Transportation Board <strong>Rail</strong> Waybill Sample<br />
Figure 7-15<br />
Stone rail traffic flows on<br />
<strong>Oklahoma</strong>’s rail network<br />
Source: 2009 Surface Transportation Board <strong>Rail</strong> Waybill Sample<br />
May 2012 7-21
Chapter 7<br />
Figure 7-16<br />
BEA terminations of <strong>Oklahoma</strong>’s<br />
outbound stone, gravel, <strong>and</strong><br />
s<strong>and</strong> rail traffic<br />
Source: 2009 Surface Transportation Board <strong>Rail</strong> Waybill Sample<br />
on BNSF as well as UP movements between Tulsa/El Reno <strong>and</strong> Comanche County north<br />
of Lawton. As Figure 7-16 shows, most <strong>Oklahoma</strong> stone shipments are local or regional<br />
short-haul shipments. They terminate either within the state or in neighboring states,<br />
primarily Texas, Colorado, <strong>and</strong> Kansas. As a low-value product with many sources<br />
throughout the U.S., shipping distances are short to keep delivery costs low.<br />
Grain<br />
Grain rail shipments in <strong>Oklahoma</strong> move in <strong>and</strong> out of the state in equal volumes—2.5 million<br />
tons terminated in the state in 2009 while 2.3 million tons originated in <strong>Oklahoma</strong>.<br />
The characteristics of these flows differ markedly between inbound <strong>and</strong> outbound. Over<br />
70 percent of <strong>Oklahoma</strong>’s inbound grain is corn (Table 7-9), which travels primarily on<br />
the KCS mainline in eastern <strong>Oklahoma</strong> to Le Flore County or on the BNSF mainline in<br />
central <strong>Oklahoma</strong> to the Perry area (Figure 7-17). Originations of these grain movements<br />
to <strong>Oklahoma</strong> are fairly concentrated in only seven BEAs (Figure 7-18), particularly eastern<br />
Kansas <strong>and</strong> longer-haul shipments from Louisiana <strong>and</strong> Mississippi.<br />
7-22<br />
Table 7-9<br />
Inbound rail grain volume in<br />
<strong>Oklahoma</strong> by type of grain<br />
STCC<br />
Commodity<br />
<strong>Oklahoma</strong> <strong>Statewide</strong> <strong>Freight</strong> <strong>and</strong> <strong>Passenger</strong> <strong>Rail</strong> <strong>Plan</strong><br />
Tons<br />
(thous<strong>and</strong>s)<br />
Percent<br />
Total<br />
01 132 Corn 1,821 72%<br />
01 133 Oats 27 1%<br />
01 137 Wheat 693 27%<br />
01 139 Grain, nec 4 0%<br />
Total Inbound Grain 2,545 100%<br />
Source: 2009 Surface Transportation Board <strong>Rail</strong> Waybill Sample<br />
STCC = St<strong>and</strong>ard Transportation Commodity Code<br />
Outbound grain from<br />
<strong>Oklahoma</strong> is almost<br />
exclusively wheat<br />
(Table 7-10). Destinations<br />
for this traffic are<br />
reasonably evenly distributed<br />
throughout west<br />
of the Mississippi River.<br />
Major outbound lanes in<br />
<strong>Oklahoma</strong> are shipments<br />
from Garfield County
Relationship of <strong>Oklahoma</strong>’s <strong>Freight</strong> <strong>Rail</strong> System to the <strong>Oklahoma</strong> Economy<br />
Figure 7-17<br />
Inbound grain rail traffic flows<br />
on <strong>Oklahoma</strong>’s rail network<br />
Source: 2009 Surface Transportation Board <strong>Rail</strong> Waybill Sample<br />
Figure 7-18<br />
BEA origins of <strong>Oklahoma</strong><br />
inbound rail grain traffic<br />
Source: 2009 Surface Transportation Board <strong>Rail</strong> Waybill Sample<br />
(Enid) on BNSF mainline in central <strong>Oklahoma</strong> south to Texas. A secondary outbound<br />
flow is movements from Jackson County (Altus) on BNSF to Texas (Figure 7-19). Destination<br />
BEAs (Figure 7-20) reflect primarily short-haul moves to neighboring states north<br />
of <strong>Oklahoma</strong>, including Kansas <strong>and</strong> Nebraska <strong>and</strong> south to northern Texas. Longer-haul<br />
destinations are in Washington, presumably for export.<br />
May 2012 7-23
Chapter 7<br />
Table 7-10<br />
Outbound rail grain volume in<br />
<strong>Oklahoma</strong> by type of grain<br />
STCC Commodity<br />
Tons<br />
(thous<strong>and</strong>s)<br />
Percent<br />
Total<br />
01 132 Corn 10 0%<br />
01 136 Sorghum grains 142 6%<br />
01 137 Wheat 2,182 93%<br />
Total Outbound Grain 2,334 100%<br />
Source: 2009 Surface Transportation Board <strong>Rail</strong> Waybill Sample, STCC = St<strong>and</strong>ard Transportation Commodity Code<br />
Figure 7-19<br />
Outbound grain rail traffic flows<br />
on <strong>Oklahoma</strong>’s rail network<br />
Source: 2009 Surface Transportation Board <strong>Rail</strong> Waybill Sample<br />
Figure 7-20<br />
BEA terminations of <strong>Oklahoma</strong>’s<br />
outbound rail grain traffic<br />
7-24<br />
Source: 2009 Surface Transportation Board <strong>Rail</strong> Waybill Sample<br />
<strong>Oklahoma</strong> <strong>Statewide</strong> <strong>Freight</strong> <strong>and</strong> <strong>Passenger</strong> <strong>Rail</strong> <strong>Plan</strong>
Relationship of <strong>Oklahoma</strong>’s <strong>Freight</strong> <strong>Rail</strong> System to the <strong>Oklahoma</strong> Economy<br />
Fertilizer<br />
Fertilizer is <strong>Oklahoma</strong>’s third largest outbound rail commodity with over 1.4 million tons<br />
shipped in 2009. Unlike the state’s other commodities, fertilizer shipments flow primarily<br />
east <strong>and</strong> west through the northern part of the state between Woodward, Enid, <strong>and</strong> Tulsa<br />
<strong>and</strong> the border to Missouri (Figure 7-21). <strong>Rail</strong> destinations of fertilizer from <strong>Oklahoma</strong><br />
exhibit a similar pattern as outbound grain (Figure 7-22), scattered throughout the midwestern<br />
<strong>and</strong> western U.S. They are primarily short-haul locations in Amarillo <strong>and</strong> nearby<br />
states north of <strong>Oklahoma</strong>—Kansas, Colorado, <strong>and</strong> Nebraska. Longer haul shipments also<br />
terminate in California <strong>and</strong> Washington.<br />
Figure 7-21<br />
Fertilizer rail traffic flows on<br />
<strong>Oklahoma</strong>’s rail network<br />
Source: 2009 Surface Transportation Board <strong>Rail</strong> Waybill Sample<br />
Petroleum<br />
Petroleum is one of <strong>Oklahoma</strong>’s major outbound rail commodities with over 700,000 tons<br />
shipped from the state in 2009. These movements are highly scattered throughout the<br />
county with major BEA terminations being Houston, Atlanta, Clevel<strong>and</strong>, Mobile, Tampa,<br />
Omaha, <strong>and</strong> northern Nevada (Figure 7-23).<br />
No picture of inbound oil shipments is presented in this report since the surge in oil shipments<br />
terminating in the state is a very recent phenomenon. The significant volume of oil<br />
to be extracted from the Bakken formation <strong>and</strong> the development of additional unloading<br />
capacity in <strong>Oklahoma</strong> will create a significant inflow of oil to the state. Although starting<br />
slow, greater volumes of <strong>Oklahoma</strong>-produced Anadarko Basin oil will increase once the<br />
rail facilities serving the area are refurbished.<br />
May 2012 7-25
Chapter 7<br />
Figure 7-22<br />
BEA terminations of <strong>Oklahoma</strong><br />
rail fertilizer traffic<br />
Source: 2009 Surface Transportation Board <strong>Rail</strong> Waybill Sample<br />
Figure 7-23<br />
BEA terminations of <strong>Oklahoma</strong>’s<br />
rail petroleum traffic<br />
Source: 2009 Surface Transportation Board <strong>Rail</strong> Waybill Sample<br />
7-26<br />
<strong>Oklahoma</strong> <strong>Statewide</strong> <strong>Freight</strong> <strong>and</strong> <strong>Passenger</strong> <strong>Rail</strong> <strong>Plan</strong>
Relationship of <strong>Oklahoma</strong>’s <strong>Freight</strong> <strong>Rail</strong> System to the <strong>Oklahoma</strong> Economy<br />
Intermodal<br />
Since <strong>Oklahoma</strong> does not currently have an intermodal container/trailer transfer facility,<br />
all reported intermodal traffic is pass-through. Intermodal traffic is the second largest type<br />
of freight traveling through <strong>Oklahoma</strong> by rail. Much of this traffic moves on the BNSF<br />
Transcon line through Woodward <strong>and</strong> over the Avard subdivision to Tulsa <strong>and</strong> beyond<br />
to Memphis <strong>and</strong> Birmingham. (Figure 7-24). Additional intermodal traffic traverses the<br />
<strong>Oklahoma</strong> panh<strong>and</strong>le on the UP Golden State route.<br />
Figure 7-24<br />
Intermodal traffic flows on<br />
<strong>Oklahoma</strong>’s rail network<br />
Source: 2009 Surface Transportation Board <strong>Rail</strong> Waybill Sample<br />
Summary<br />
Most rail traffic in <strong>Oklahoma</strong> (over 80 percent) is through or overhead traffic that neither<br />
originates nor terminates in the state. This traffic is predominately coal, intermodal, <strong>and</strong><br />
grain. <strong>Rail</strong> shipments that begin or end in <strong>Oklahoma</strong> are primarily coal, grain, <strong>and</strong> stone<br />
aggregates. These are traditional, heavy-loading, bulk rail commodities that primarily<br />
move locally or regionally between neighboring states. Grain in particular is balanced<br />
between outbound (wheat) <strong>and</strong> inbound (corn).<br />
May 2012 7-27
8. Overview of <strong>Oklahoma</strong> <strong>Rail</strong> Legislation<br />
OKLAHOMA<br />
STATEWIDE FREIGHT<br />
&<br />
PASSENGER RAIL PLAN<br />
<strong>Oklahoma</strong> statutes that include provisions for current railroad-related activities date<br />
back to some of the earliest laws on record in <strong>Oklahoma</strong>, including the law recognizing<br />
foreign corporations operating in <strong>Oklahoma</strong> before statehood. The majority of the initial<br />
legislation pertaining to railroads in <strong>Oklahoma</strong> relates to the definition of a railroad corporation,<br />
the powers granted those corporations, rules regarding the acquisition <strong>and</strong> use<br />
of l<strong>and</strong>s in <strong>Oklahoma</strong>, <strong>and</strong> operating practices or requirements to help safeguard <strong>Oklahoma</strong><br />
residents <strong>and</strong> property.<br />
<strong>Oklahoma</strong> <strong>Rail</strong> Legislation History<br />
Title 66 of the <strong>Oklahoma</strong> Statutes governs railroads <strong>and</strong> their operations in <strong>Oklahoma</strong>. A<br />
history of its important provisions is summarized in this section. Table 8-1 outlines early<br />
<strong>Oklahoma</strong> laws addressing significant railroad issues.<br />
Primary issues addressed in the initial legislation included establishing railroads as entities<br />
with perpetual succession <strong>and</strong> the members of the board listed as the primary contacts<br />
for any legal matters or affairs. These laws also outlined the powers granted to railroad<br />
corporations, including the right to extend routes into <strong>Oklahoma</strong> l<strong>and</strong>s, acquire property<br />
for the construction of railroad infrastructure through eminent domain, to lease or sell<br />
infrastructure or property, <strong>and</strong> the responsibilities of the railroad to ensure safe operation<br />
within the state. The primary operating requirements of the initial legislation focused<br />
on the installation <strong>and</strong> maintenance of adequate fencing necessary to safeguard livestock<br />
from train operations. Early legislation also outlined the amount of right-of-way by limiting<br />
the allowable maximum width adjacent to the centerline of railroad alignment that the<br />
railway could obtain for the installation of rail infrastructure, stations, depot grounds, <strong>and</strong><br />
other rail facilities reasonably necessary to accomplish the corporation’s objectives.<br />
The next notable category of <strong>Oklahoma</strong> legislation related to railroad operations are laws<br />
initiated during the late 1930s focusing on tax collection from railroad corporations,<br />
including the tax liability associated with freight cars (Table 8-2). These laws require<br />
railroad corporations to pay 4 percent of the amount constituting the gross revenue for<br />
freight car operations in the state for each freight car so used, rented, or leased. These<br />
laws include the requirements for each railroad corporation to collect freight car taxes on<br />
privately owned rail cars operated over their infrastructure within <strong>Oklahoma</strong>. Those tax<br />
collection requirements include provisions for the payment, collection, <strong>and</strong> record keeping<br />
associated with privately owned rail car collections <strong>and</strong> the payment period in which<br />
the railroads are required to make the final payment to the state annually.<br />
May 2012 8-1
Chapter 8<br />
Table 8-1<br />
<strong>Oklahoma</strong> laws governing<br />
railroads—early legislation<br />
Law Date Revision Description Provisions<br />
os-66-1 1910 none Articles <strong>and</strong> certifications Requires railroad to provide articles of<br />
incorporation<br />
os-66-7 1910 1997 Powers of <strong>Oklahoma</strong> railroad Powers of incorporated railroad operators<br />
corporations<br />
os-66-51 1910 none Power to enter l<strong>and</strong>s for<br />
construction<br />
Provides access <strong>and</strong> eminent domain<br />
os-66-63 1910 none <strong>Rail</strong>road rights regarding use<br />
of municipal right of way<br />
Rules for the use of public roadways by railroad<br />
companies near railroad rights-of-way<br />
os-66-128 1910 none Roadway crossings Requires railroad to construct/maintain roadway<br />
crossings<br />
os-66-143 1910 none Rights of adjacent<br />
l<strong>and</strong>owners<br />
Empowers adjacent l<strong>and</strong>owners to improve<br />
railroad fencing as necessary<br />
os-66-144 1910 none Failure to fence Assigns liability for incidents resulting from<br />
railroads failure to fence<br />
os-66-145 1910 none Fencing requirements Requires railroad to construct fencing<br />
os-66-146 1910 none Notice to fence Requires railroad to construct fencing on frontage<br />
property within 60 days where given notice<br />
os-66-147 1910 none Fencing penalty Requires railroad to construct or reimburse cost<br />
for fencing<br />
os-66-161 1910 none Extension of route into<br />
<strong>Oklahoma</strong><br />
os-66-164 1910 none Domestication of foreign<br />
corporations<br />
Requires railroad to provide route to <strong>Oklahoma</strong><br />
Corporation Commission prior to extending route<br />
into <strong>Oklahoma</strong><br />
Recognizes railroad corporations operating in<br />
<strong>Oklahoma</strong> before statehood<br />
os-66-184 1910 none Leasing or selling Empowers railroad to lease or sell infrastructure<br />
or property<br />
8-2<br />
<strong>Oklahoma</strong> <strong>Statewide</strong> <strong>Freight</strong> <strong>and</strong> <strong>Passenger</strong> <strong>Rail</strong> <strong>Plan</strong>
Overview of <strong>Oklahoma</strong> <strong>Rail</strong> Legislation<br />
Table 8-2<br />
<strong>Oklahoma</strong> laws governing railroads—1937–1963 Legislation<br />
Law Date Revision Description Provisions Requirement Schedule Key Elements<br />
os-66-125a 1937 none <strong>Rail</strong>road highway crossing<br />
safety<br />
Requires public authority<br />
to coordinate construction<br />
<strong>and</strong> maintenance of safety<br />
devices<br />
Construction <strong>and</strong><br />
maintenance of highway-rail<br />
crossing signals<br />
os-68-2201 1939 1965 Definitions Definitions for tax collections Defines gross revenue,<br />
railroad company, <strong>and</strong><br />
freight car<br />
os-68-2204 1939 1994 Disposition of taxes collected Taxes collected via Section<br />
2201 to be credited to the<br />
RMRF<br />
os-68-2206 1939 1994 Tax liability Requires railroad to withhold<br />
4 percent of gross revenue<br />
for corporate <strong>and</strong> privately<br />
owned rail freight car<br />
operation in <strong>Oklahoma</strong><br />
os-68-2207 1939 1994 Determination of tax Requires railroad to prepare<br />
annual tax statements <strong>and</strong><br />
remit tax<br />
os-68-1404 1963 1999 Exemptions Establishes tax exemptions<br />
for railroad personal<br />
property<br />
RMRF = <strong>Rail</strong>road Maintenance Revolving Fund<br />
effective 5/25/1937 Initiation of railroad safety<br />
program in <strong>Oklahoma</strong><br />
Annually assessed Assessed for railroad private<br />
property in lieu of ad<br />
valorem tax<br />
Established RMRF Annually assessed Provision of matching<br />
funds for railroad safety<br />
improvement<br />
Annual tax collected by<br />
railroad for freight car<br />
operation assessed on 12/31<br />
Funds to RMRF after 30 days<br />
of no protest<br />
<strong>Rail</strong>road exemption from ad<br />
valorem Tax<br />
Tax collected to be reported<br />
by 4/1<br />
Assessed by 12/31 Reported<br />
by 4/1<br />
Funding source for RMRF<br />
Provides 30-day protest<br />
period<br />
Coal cars exempt 1/1/1991 Exemption for coal transport<br />
May 2012 8-3
Chapter 8<br />
<strong>Oklahoma</strong> Highway Commission (now ODOT) was authorized to construct or install, or<br />
to order the company owning a railroad crossing a highway to install warning devices. The<br />
requirements also call for on-going maintenance of the devices. The devices are installed<br />
where deemed appropriate.<br />
These requirements resulted in the development of Highway/<strong>Rail</strong> Grade Crossing Safety<br />
Programs coordinated today. The funding for Highway/<strong>Rail</strong> Grade Crossing Safety<br />
Improvement has predominantly been provided by the Federal Highway Administration<br />
(FHWA) through various safety funding provisions in a number of highway funding bills<br />
over the past three decades. Regardless of various highway funding bill amendments to<br />
the appropriation requirements for safety funds. ODOT has continued to require a minimum<br />
10-percent match for grade crossing signal improvements, with the match for active<br />
warning device installations placed on state highways normally paid from the RMRF.<br />
The next category of laws was enacted in the 1970s, predominantly for the construction<br />
of roadway/highway improvements on railroad right-of-way (Table 8-3). This<br />
also established ODOT as the department responsible for the coordination of railroad<br />
improvements throughout the state.<br />
Other notable provisions included in these laws were the initial legislation that would ultimately<br />
be revised to become the <strong>Rail</strong>road Revitalization Act. One law specifically defined<br />
the limits of ODOT’s jurisdiction as it relates to railroad operations in the state.<br />
The period between 1978 <strong>and</strong> 1988 included legislation that would ultimately empower<br />
ODOT to acquire, construct, reconstruct, repair, replace, operate <strong>and</strong> maintain railroad<br />
rights-of-way <strong>and</strong> provide a funding source for rail related improvements (Table 8-4). The<br />
<strong>Rail</strong>road Revitalization Act <strong>and</strong> legislation enacted to establish the RMRF are those leading<br />
to development of the state-owned property programs currently administered through<br />
the <strong>Rail</strong> Programs Division of ODOT.<br />
Some of the most influential legislation enacted in this period established the prioritization<br />
of entities to which existing rail infrastructure in danger of being ab<strong>and</strong>oned could<br />
be sold. That legislation provided a minimum of a 1-year waiting period before adjacent<br />
l<strong>and</strong> owners were eligible for the purchase of any adjoining rail property for reversion<br />
back to farm l<strong>and</strong>. The prioritization schedule provided railroads <strong>and</strong> government entities<br />
the right of first refusal for the purchase <strong>and</strong> utilization of existing railroad infrastructure.<br />
Additional refinements were also established for the collection of the freight car tax<br />
equivalent to 4 percent of gross revenues for freight car operation in lieu of ad valorem<br />
taxes on railroad personal property.<br />
The most recent <strong>Oklahoma</strong> laws enacted deal predominantly with funding or passenger rail<br />
service improvements (Table 8-5). The initial funding for the <strong>Oklahoma</strong> Tourism <strong>and</strong> <strong>Passenger</strong><br />
<strong>Rail</strong> Act came from provisions included in the Taxpayer Relief Act of 1997 that focused<br />
on implementing Amtrak service for states without passenger rail service. Most of the 1990s<br />
legislation was focused on the implementation <strong>and</strong> continued service of the Heartl<strong>and</strong> Flyer,<br />
with the exception of the 1999 revision of the <strong>Rail</strong>road Revitalization Act, which firmly<br />
established the procedures for the <strong>Rail</strong> Programs Division State-owned <strong>Rail</strong> Programs allowing<br />
ODOT to acquire, operate, <strong>and</strong> maintain railroad infrastructure located in <strong>Oklahoma</strong>.<br />
8-4<br />
<strong>Oklahoma</strong> <strong>Statewide</strong> <strong>Freight</strong> <strong>and</strong> <strong>Passenger</strong> <strong>Rail</strong> <strong>Plan</strong>
Overview of <strong>Oklahoma</strong> <strong>Rail</strong> Legislation<br />
Table 8-3<br />
<strong>Oklahoma</strong> laws governing railroads—1968–1976 Legislation<br />
Law Date Revision Description Provisions Requirements Schedule Key Elements<br />
os-69-1722 1968 1998 Rules for condemnation<br />
of railroad property by<br />
Highway Department<br />
os-66-304 1971 1978, 80, 81,<br />
97, 98, 99<br />
os-66-306 1971 1998 Essential government<br />
functions<br />
os-66-308 1971 1998 Contract rules requiring<br />
lowest bid<br />
Rules for condemnation of railroad<br />
property associated with overpass<br />
construction<br />
Powers <strong>and</strong> duties Empowerments <strong>and</strong> provisions for<br />
the <strong>Rail</strong>road Revitalization Act<br />
Declares powers of <strong>Rail</strong>road<br />
Revitalization Act essential<br />
Requires compliance with<br />
Competitive Bidding Act of 1974<br />
os-69-4008 1976 1993 Establishes duties of ODOT Abolition of Department of<br />
Highway, Highway Safety<br />
Coordination Committee, <strong>and</strong><br />
<strong>Rail</strong>road Maintenance Authority<br />
os-69-4013 1976 none Limitation of Jurisdiction Defines the limit of ODOT<br />
jurisdictional authority<br />
ODOT = <strong>Oklahoma</strong> Department of Transportation, RMRF = <strong>Rail</strong>road Maintenance Revolving Fund<br />
Must provide plans to<br />
railroad for review<br />
ODOT freight rail<br />
operation <strong>and</strong><br />
management<br />
requirements<br />
<strong>Rail</strong>road has 30<br />
days to review<br />
<strong>Rail</strong>road over/under-pass<br />
construction<br />
6/1/1981 Authorizes ODOT to acquire,<br />
operate, <strong>and</strong> maintain railroad<br />
right-of-way<br />
Laws 1998, c. 376, §3 eff. 11/1/1998 recites os-51-155<br />
<strong>Rail</strong>road projects utilize<br />
lowest competitive bid<br />
effective<br />
4/10/1978<br />
ODOT established 7/1/1993 Responsibility for rail issues<br />
assigned to ODOT<br />
Defines <strong>Oklahoma</strong><br />
Corporation<br />
Commission<br />
jurisdiction<br />
n/a Denotes regional, port, airport,<br />
<strong>and</strong> local entity authority<br />
May 2012 8-5
Chapter 8<br />
Table 8-4<br />
<strong>Oklahoma</strong> laws governing railroads—1978–1988 Legislation<br />
Law Date Revision Description Provisions Requirements Schedule Key Elements<br />
os-66-302.1 1978 1998 Citation Official name for <strong>Rail</strong>road<br />
Revitalization Act<br />
os-66-303 1978 1998 Definitions Definitions for <strong>Rail</strong>road<br />
Revitalization Act<br />
Laws 1978, c. 164, § 1,<br />
emerg.<br />
Designates ODOT for<br />
railroad coordination<br />
eff. 4/10/1978 In conjunction with<br />
68-2204<br />
Defines owner <strong>and</strong><br />
income<br />
Defines Intermodal<br />
transportation<br />
os-66-309 1978 1981 Establishes RMRF fund Provisions for RMRF os-68-2201 6/1/1981 Funds for RMRF<br />
os-69-4016 1980 none Prohibition of contributions<br />
os-66-304.1 1980 none State Supreme Court<br />
ruling<br />
os-68-2352 1971 1976, 78, 80,<br />
81, 83, 85, 86,<br />
87, 88, 89,<br />
90, 91, 96, 99,<br />
2002, 03, 05,<br />
07, 08<br />
1981 Amendment of<br />
General Revenue Fund<br />
os-66-65 1981 1991 Rules for purchasing<br />
ab<strong>and</strong>oned railroad<br />
right-of-way<br />
Prohibits contributions, gifts,<br />
etc., to certain railroads or<br />
other entities<br />
Determines the constitutionality<br />
of the <strong>Rail</strong>road<br />
Revitalization Act<br />
Adoption of S.B. 59, 1981<br />
amended General Revenue<br />
Fund to include appropriations<br />
for the purchase of railroad<br />
right-of-way<br />
Provides prioritization of<br />
purchase rights for railroad<br />
property<br />
os-68-2805 1988 1992 Provisions for tax Establishes tax to be collected<br />
in lieu of ad valorem tax<br />
os-68-2859 1988 1997 Duties, power, <strong>and</strong><br />
authority<br />
ODOT = <strong>Oklahoma</strong> Department of Transportation, RMRF = <strong>Rail</strong>road Maintenance Revolving Fund<br />
Duties, power, <strong>and</strong> authority of<br />
State Board of Equalization<br />
Prohibits subsidies for<br />
private entities<br />
Laws 1981, c. 214, § 2,<br />
emerg.<br />
Appropriated State<br />
Highway Construction<br />
<strong>and</strong> Maintenance Funds<br />
toward the purchase of<br />
CRIP right-of-way<br />
Priority—railroad,<br />
adjacent business, ODOT,<br />
federal, local<br />
n/a Prohibits subsidizing<br />
non-government entities<br />
effective 6/1/1981 <strong>Oklahoma</strong> Supreme<br />
Court ruling<br />
Signed 6/26/1981 ended<br />
7/1/1982<br />
Provides 1 year for priority<br />
purchase<br />
Unused appropriations to<br />
revert back to the State<br />
Highway Maintenance<br />
Fund on 7/1/1982<br />
Adjacent l<strong>and</strong> owner<br />
must wait 1 year<br />
os-68-2202 1/1/1992 <strong>Freight</strong> car tax<br />
Assess non ad valorem<br />
railroad tax<br />
1/1/1997 Empowerment to assess<br />
taxes exempt from ad<br />
valorem taxation<br />
8-6<br />
<strong>Oklahoma</strong> <strong>Statewide</strong> <strong>Freight</strong> <strong>and</strong> <strong>Passenger</strong> <strong>Rail</strong> <strong>Plan</strong>
Overview of <strong>Oklahoma</strong> <strong>Rail</strong> Legislation<br />
Table 8-5<br />
<strong>Oklahoma</strong> laws governing railroads—1991–1999 Legislation<br />
Law Date Revision Description Provisions Requirements Schedule Key Elements<br />
os-68-504 1991 1993, 94,<br />
96<br />
Apportionment Engrossed HB 1078 <strong>and</strong> Engrossed<br />
Senate Amendments appropriating<br />
4 percent of State Transportation<br />
Fund to contract railroad passenger<br />
service<br />
Funding for Heartl<strong>and</strong> Flyer<br />
Operations 1991–1996<br />
repealed by OTPRRF<br />
legislation<br />
os-66-321 1996 2005 Citation Official name for OTPR Act Added by laws 1996, c.<br />
255, §1<br />
os-66-322 1996 2005 Purpose Purpose of the OTPR Act Establish passenger rail,<br />
enhance tourism<br />
Repealed 1996 Provided $850,000 annually<br />
for Heartl<strong>and</strong> Flyer<br />
service<br />
7/1/1996 <strong>Passenger</strong> rail funding<br />
OTPR Act<br />
7/1/1996 Empowerment for support<br />
of passenger rail<br />
os-66-323 1996 2005 Definitions Definitions for OTPR Act Designates ODOT 1/1/1996 Defines passenger rail<br />
service<br />
os-66-324 1996 none Powers <strong>and</strong> duties Empowerment of the OTPR Act Powers <strong>and</strong> duties of<br />
ODOT<br />
os-66-325 1996 2001 Established OTPRRF Provisions for OTPRRF Funding for passenger rail<br />
service<br />
os-66-304 1971 1978, 80,<br />
81, 97,<br />
98, 99<br />
os-66-304.1 1980 none State Supreme Court<br />
ruling<br />
Powers <strong>and</strong> duties Empowerments <strong>and</strong> provisions for<br />
<strong>Rail</strong>road Revitalization Act<br />
Determines the constitutionality of<br />
the <strong>Rail</strong>road Revitalization Act<br />
os-66-326 1999 none Citation Official name for Interstate Midwest<br />
Regional <strong>Passenger</strong> <strong>Rail</strong> Compact<br />
ODOT freight rail operation<br />
<strong>and</strong> management<br />
requirements<br />
Laws 1981, c. 214, §2,<br />
emerg.<br />
Added by Laws 1999, c.<br />
70, §1, emerg.<br />
ODOT = <strong>Oklahoma</strong> Department of Transportation, OTPR Act = <strong>Oklahoma</strong> Tourism <strong>and</strong> <strong>Passenger</strong> <strong>Rail</strong> Act, OTPRRF = <strong>Oklahoma</strong> Tourism <strong>and</strong> <strong>Passenger</strong> <strong>Rail</strong> Revolving Fund, RMRF = <strong>Rail</strong>road Maintenance Revolving Fund<br />
1/1/1996 <strong>Passenger</strong> rail service<br />
improvements<br />
1/1/1996–1/1/2001 Ref—Intercity <strong>Passenger</strong><br />
<strong>Rail</strong> Trust Fund Act of 1995<br />
7/1/1999 Authorize ODOT to acquire,<br />
operate <strong>and</strong> maintain<br />
railroad right-of-way<br />
effective 6/1/1981 <strong>Oklahoma</strong> Supreme Court<br />
ruling<br />
effective 4/7/1999 Enters <strong>Oklahoma</strong> into<br />
Regional <strong>Passenger</strong> <strong>Rail</strong><br />
Compact<br />
May 2012 8-7
Chapter 8<br />
Table 8-6<br />
<strong>Oklahoma</strong> laws governing railroads—recent legislation (continued on next page)<br />
Law Date Revision Description Provisions Requirements Schedule Key Elements<br />
os-66-326 1999 none Citation Official name for Interstate Midwest<br />
Regional <strong>Passenger</strong> <strong>Rail</strong> Compact<br />
os-66-328 1999 none Powers <strong>and</strong> duties Duties of the Transportation Commission<br />
for passenger rail improvements<br />
os-66-<br />
309.1<br />
os-66-<br />
309.2<br />
os-66-<br />
309.3<br />
2002 none <strong>Rail</strong>road<br />
Rehabilitation Act<br />
Short title for the <strong>Rail</strong>road Rehabilitation<br />
Act<br />
Added by Laws 1999, c. 70,<br />
§1, emerg<br />
Make <strong>Passenger</strong> <strong>Rail</strong><br />
Improvements a reality for<br />
the region<br />
Added by Laws 2002, c. 297,<br />
§3, emerg<br />
2002 none Definitions Definitions for <strong>Rail</strong>road Rehabilitation Act Added by Laws 2002, c. 297,<br />
§3, emerg<br />
2002 none Powers <strong>and</strong> duties Provisions <strong>and</strong> terms for railroad<br />
rehabilitation loan program<br />
os-47-1104 1985 2007 Amendment of<br />
Vehicle License<br />
<strong>and</strong> Registration<br />
Act<br />
os-68-2352 1971 1976, 78,<br />
80, 81, 83,<br />
85, 86, 87,<br />
88, 89, 90,<br />
91, 96, 99,<br />
2002, 03,<br />
05, 07, 08<br />
Amendment<br />
of General<br />
Revenue Fund<br />
appropriations<br />
Adoption of HB 1176, 2005 amending<br />
General Revenue Fund to fund from<br />
vehicle title fees<br />
HB 1078, 2010 amends General Revenue<br />
Fund to include new designated<br />
appropriations for rail passenger service<br />
Annual amount to be<br />
Overview of <strong>Oklahoma</strong> <strong>Rail</strong> Legislation<br />
Table 8-6<br />
<strong>Oklahoma</strong> laws governing railroads—recent legislation (continued from previous page)<br />
Law Date Revision Description Provisions Requirements Schedule Key Elements<br />
os-68-<br />
2357.103<br />
os-68-<br />
2357.104<br />
2005 None <strong>Rail</strong>road<br />
Modernization Act<br />
2005 2010 <strong>Rail</strong>road<br />
Modernization Act<br />
os-69-1521 2005 2010 Establishes<br />
the Rebuilding<br />
<strong>Oklahoma</strong> Access<br />
<strong>and</strong> Driver Safety<br />
Fund<br />
OTPRRF = <strong>Oklahoma</strong> Tourism <strong>and</strong> <strong>Passenger</strong> <strong>Rail</strong> Revolving Fund<br />
Short title for the <strong>Rail</strong>road Modernization<br />
Act of 2005<br />
Limits for tax credits associated with the<br />
<strong>Rail</strong>road Modernization Act of 2005<br />
Provisions for the Rebuilding <strong>Oklahoma</strong><br />
Access <strong>and</strong> Driver Safety Fund (from<br />
HB 1078, 2010)<br />
Added by Laws 2005, c.<br />
413, §7, pertaining to taxes<br />
levied by os-68-2355<br />
No credit for improvements<br />
after 7/1/2010; ends<br />
7/1/2012<br />
Appropriates $2 million per<br />
year for Heartl<strong>and</strong> Flyer<br />
operation<br />
effective 11/1/2006<br />
ends 7/1/2012<br />
effective 11/1/2006<br />
ends 7/1/2012<br />
Fund budgeted<br />
6/30/2006<br />
Modified tax credit for<br />
railroad reconstruction or<br />
replacement (11/1/2006 to<br />
7/1/2010)<br />
Tax credits limited to<br />
Class II <strong>and</strong> Class III<br />
operators<br />
References general fund<br />
appropriation os-68-2352<br />
May 2012 8-9
Chapter 8<br />
Other notable provisions include passage of SB 383, in 1999. <strong>Oklahoma</strong>’s entrance into the<br />
Interstate Midwest Regional <strong>Passenger</strong> <strong>Rail</strong> Compact. This organization promotes regional<br />
passenger rail development in mid-western states <strong>and</strong> identifies the duties of the <strong>Oklahoma</strong><br />
Transportation Commission with regard to passenger rail improvements.<br />
The most recent <strong>Oklahoma</strong> rail laws enacted continue to focus on funding rail service.<br />
Long-term funding for the Heartl<strong>and</strong> Flyer passenger rail service was identified in the<br />
Rebuilding <strong>Oklahoma</strong> Access <strong>and</strong> Driver Safety Fund. <strong>Freight</strong> rail operators within the<br />
state were provided the opportunity to borrow funding through the <strong>Rail</strong>road Rehabilitation<br />
Loan Program which would allow repayable loans to be distributed from the RMRF<br />
<strong>and</strong> to obtain tax credits toward railroad rehabilitation or replacement costs through the<br />
<strong>Rail</strong>road Modernization Act.<br />
Public-Private Partnership Law<br />
One of the state’s primary hurdles to additional railroad investment is the prohibition<br />
of direct private investment in public projects. Prohibited by state law, the exclusion of<br />
private funding precludes the state from participating in an increasingly popular form of<br />
funding, public-private partnerships (P3). A P3 seeks to link a mix of public <strong>and</strong> private<br />
funding to the benefits that accrue to each sector. <strong>Rail</strong> investments benefit both the private<br />
rail carrier <strong>and</strong> the public through improved mobility, reduced energy consumption, <strong>and</strong><br />
reduced emissions or by stimulating economic development. Currently, <strong>Oklahoma</strong> is<br />
studying <strong>and</strong> investigating the best way to implement this form of project development.<br />
8-10<br />
<strong>Oklahoma</strong> <strong>Statewide</strong> <strong>Freight</strong> <strong>and</strong> <strong>Passenger</strong> <strong>Rail</strong> <strong>Plan</strong>
9. <strong>Oklahoma</strong> Department of<br />
Transportation <strong>Rail</strong> Programs<br />
OKLAHOMA<br />
STATEWIDE FREIGHT &<br />
PASSENGER RAIL PLAN<br />
<strong>Rail</strong> Programs Division<br />
The <strong>Rail</strong> Programs Division of ODOT was established in 1989 to oversee the state’s<br />
3,599 miles of rail, 428 miles of which are owned by the state (Figure 9-1). It is responsible<br />
for acquiring <strong>and</strong> administering federal <strong>and</strong> state funds used to support operation of the<br />
Heartl<strong>and</strong> Flyer passenger service, highway construction projects affecting railroad property,<br />
<strong>and</strong> railroad crossing safety improvements as well as maintenance of the state-owned<br />
rail lines. The division comprises five sections—State-owned <strong>Rail</strong> Line Management,<br />
Safety, <strong>Rail</strong> <strong>Passenger</strong>, Construction, <strong>and</strong> Federal Programs.<br />
State-owned <strong>Rail</strong> Line Management Section<br />
The State-owned <strong>Rail</strong> Line Management Section oversees the state-owned rail properties<br />
<strong>and</strong> their selected operators. The section has direct responsibility for the rights-of-way,<br />
operator contract compliance, property inspections, <strong>and</strong> all easement/license/lease<br />
reviews <strong>and</strong> for maintaining the lease agreements between the state <strong>and</strong> the operators. It<br />
also completes yearly inspections for proper maintenance <strong>and</strong> administers state funds for<br />
the upkeep of these properties.<br />
In 1978, the <strong>Oklahoma</strong> State Legislature passed the <strong>Rail</strong>road Revitalization Act. This<br />
act specified the powers <strong>and</strong> duties of ODOT to address state rail issues. ODOT was<br />
authorized <strong>and</strong> empowered to acquire, construct, repair, operate, <strong>and</strong> maintain railroad<br />
rights-of-way <strong>and</strong> trackage on feasible <strong>and</strong> economically sound railroad routes.<br />
Following the termination of operations in 1979 by CRIP, liquidation of the system<br />
began. CRIP had many unprofitable branch lines serving farmers throughout the Midwest<br />
<strong>and</strong> Great Plains. This liquidation threatened the agriculture business seriously.<br />
Under the <strong>Rail</strong>road Revitalization Act, the state was able to acquire several of the CRIP<br />
lines that were important to the agriculture business. In turn, almost all these lines were<br />
leased to other operators, mostly short lines, to ensure the flow of agriculture goods was<br />
maintained. Under railroad deregulation in 1980, more rail lines became available as the<br />
process to ab<strong>and</strong>on unprofitable lines was simplified. ODOT acquired over 800 miles of<br />
soon-to-be ab<strong>and</strong>oned lines.<br />
Unburdened by some of the cost structures of the large railroads, short line operators<br />
could operate these low-traffic-density routes at a profit. This arrangement made rail<br />
transportation a continuing option for many small businesses.<br />
Some of the lines were operated under lease-purchase arrangements. Notable, was the<br />
lease arrangement of the CRIP’s former north-south mainline through El Reno. The lease<br />
May 2012 9-1
Chapter 9<br />
Figure 9-1<br />
State-owned 2012 rail mileage<br />
OKLAHOMA<br />
STATE OWNED<br />
2012 RAIL MILEAGE<br />
OPERATOR MILES<br />
FMRC FARMRAIL CORPORATION 179<br />
SLWC STILLWATER CENTRAL RAILROAD 125<br />
AOK ARKANSAS-OKLAHOMA RAILROAD 70<br />
AT&L AUSTIN, TODD & LADD RAILROAD 29<br />
BNGR BLACKWELL NORTHERN GATEWAY 17<br />
STATE STATE OWNED (Non-Operating) 11<br />
TOTAL 431<br />
STATE<br />
9-2<br />
<strong>Oklahoma</strong> <strong>Statewide</strong> <strong>Freight</strong> <strong>and</strong> <strong>Passenger</strong> <strong>Rail</strong> <strong>Plan</strong>
<strong>Oklahoma</strong> Department of Transportation <strong>Rail</strong> Programs<br />
purchase on this line matured in 2011 <strong>and</strong>, after 30 years of payments, UP took title to<br />
the property. This rail line serves as an ideal example of the original intent of the <strong>Rail</strong>road<br />
Revitalization Act—to preserve critical rail infrastructure <strong>and</strong> ultimately restore rail<br />
service to areas of the state that can make use of it to ensure that reliable, efficient, <strong>and</strong> safe<br />
rail transportation will continue without requiring subsidization by the public sector.<br />
ODOT successfully leases 98 percent of the lines it owns to Class Ill operators. Today,<br />
431 miles of <strong>Oklahoma</strong>-owned rail line remain under lease. The proceeds from the leases<br />
are an important source of revenue to ODOT for maintenance of these properties. This<br />
revenue forms the backbone of the 8-Year <strong>Rail</strong> Construction <strong>and</strong> Maintenance Work <strong>Plan</strong><br />
funding, which is operated through the State-owned <strong>Rail</strong> Line Management Section.<br />
Safety Section<br />
The Safety Section works with all <strong>Oklahoma</strong> railroads to achieve compliance with the<br />
stop/yield sign requirements of the FRA <strong>and</strong> the FHWA Manual of Uniform Traffic Control<br />
Devices (MUTCD).<br />
<strong>Oklahoma</strong> has 3,852 railroad-highway grade crossings with one-third equipped with<br />
active warning devices with either pedestal-mounted flashers, gates, cantilevered signals,<br />
or any combination of the three. The remaining two-thirds of these crossings are controlled<br />
by passive devices, such as warning signs.<br />
States receive annual federal funding for the improvement of grade railroad crossings with<br />
active warning devices. The FRA has devised a system called the Priority Index Ranking<br />
to determine which crossings are the leading c<strong>and</strong>idates for funding. The <strong>Rail</strong> Programs<br />
Division Safety Section manages the crossing improvement priorities in <strong>Oklahoma</strong>. It also<br />
manages the FRA Crossing Corridor Program, which provides funding for upgrades to<br />
remaining crossings in corridors where selected grade crossings are closed.<br />
The most recent highway-rail crossing inventory data collected for the State of <strong>Oklahoma</strong><br />
in 2009 indicates that <strong>Oklahoma</strong> currently has 4,318 crossings that are open to the public,<br />
including 533 (12 percent) that are grade-separated locations, 1404 (33 percent) with<br />
some type of active warning devices, <strong>and</strong> 2,381 (55 percent) with passive warning devices.<br />
In FY 2012, there are currently 9 safety projects ongoing at a cost of $2.5 million, with<br />
another 10 projects pending, valued at $3.2 million. Approximately 50 diagnostic team<br />
inspections are being scheduled for FY 2013 with the possibility of upgrading 25 to 30<br />
crossings with signals <strong>and</strong> gates.<br />
<strong>Rail</strong> <strong>Passenger</strong> Section<br />
The <strong>Rail</strong> <strong>Passenger</strong> Section oversees the passenger rail operations in the state, namely the<br />
Heartl<strong>and</strong> Flyer. It works with Amtrak to ensure quality service. It also administers the<br />
funding provided to Amtrak for provision of the service.<br />
Construction Section<br />
The Construction Section coordinates state rail construction activity. It is responsible for<br />
reviewing the scope of a railroad’s involvement, developing required agreements with the<br />
May 2012 9-3
Chapter 9<br />
railroads to permit contractor access to railroad property, <strong>and</strong> ensuring that insurance<br />
requirements are met. It oversees projects through to completion <strong>and</strong> final inspection.<br />
Federal Programs Section<br />
The Federal Programs Section identifies <strong>and</strong> secures funding available for rail improvements.<br />
It ensures that ODOT is fully compliant <strong>and</strong> integrated with all federal rail funding<br />
initiatives. It prepares all funding applications <strong>and</strong> develops the business cases supporting<br />
the applications. The section also keeps ODOT staff informed of national rail policy <strong>and</strong><br />
priorities to position <strong>Oklahoma</strong> as a benefactor of the policies.<br />
ODOT Highway-<strong>Rail</strong> Crossing Inventory <strong>and</strong> Project<br />
Management Tools<br />
<strong>Oklahoma</strong> continues to experience reductions in crossing incidents with the crossing<br />
fatalities that averaged 18 per year in the 1980s being reduced to an average of 11 per year<br />
over the past decade. Injuries at railroad crossings have also dropped significantly from an<br />
average of 83 injuries per year in the 1980s to 32 injuries per year over the past decade.<br />
The reduction in collisions <strong>and</strong> fatalities at highway-rail crossings can most likely be<br />
attributed to a reduction in the overall number of crossings throughout the state as well<br />
as the installation of gates <strong>and</strong> flashing lights at a significant number of crossings. From a<br />
national prospective, the FRA’s Office of Safety Analysis indicates that the U.S. has approximately<br />
139,862 public grade crossings. Of those active public crossings, less than half<br />
(approximately 50,132) have gates, 23,215 have flashing lights, <strong>and</strong> 1,248 have highway<br />
traffic signals, wigwags, <strong>and</strong> bells.<br />
The FHWA requires each state to develop <strong>and</strong> implement a highway safety improvement<br />
program that consists of three components—planning, implementation, <strong>and</strong> evaluation.<br />
The process for improving safety <strong>and</strong> operations at highway-railroad grade crossings consists<br />
of the same three components <strong>and</strong> may be considered part of a state’s highway safety<br />
improvement program. Federal policy requires the planning component to consist of a<br />
process for<br />
• Collecting <strong>and</strong> maintaining a record of collision, traffic, <strong>and</strong> highway data that<br />
includes information for highway-rail grade crossings <strong>and</strong> the characteristics of<br />
both highway <strong>and</strong> train traffic.<br />
• Analyzing available data to identify highway locations, sections, <strong>and</strong> elements<br />
determined to be hazardous on the basis of collision history or collision potential.<br />
• Conducting engineering studies of hazardous locations, sections, <strong>and</strong> elements to<br />
develop highway safety improvement projects.<br />
• Establishing priorities for implementing highway safety improvement projects.<br />
The implementation component consists of a process for programming <strong>and</strong><br />
implementing safety improvements. The evaluation component consists of a<br />
process for determining the effect that safety improvements have in reducing the<br />
number <strong>and</strong> severity of collisions <strong>and</strong> potential collisions.<br />
A 1996 USDOT Grade Crossing Safety Task Force study identified a lack of quality data<br />
on grade crossings as an impediment to developing <strong>and</strong> managing necessary crossing<br />
9-4<br />
<strong>Oklahoma</strong> <strong>Statewide</strong> <strong>Freight</strong> <strong>and</strong> <strong>Passenger</strong> <strong>Rail</strong> <strong>Plan</strong>
<strong>Oklahoma</strong> Department of Transportation <strong>Rail</strong> Programs<br />
safety improvement programs. <strong>Rail</strong>road, state, <strong>and</strong> local officials recommended the development<br />
<strong>and</strong> maintenance of improved databases, including increased availability to state<br />
<strong>and</strong> local agencies as well as the private sector.<br />
Beginning with a statewide inventory of public crossings in 1993, the ODOT <strong>Rail</strong><br />
Programs Division has taken a national leadership role in collecting crossing data <strong>and</strong> utilizing<br />
the data to support safety project decisions. ODOT is maintaining a leadership role<br />
for developing data with its latest statewide railroad crossing inventory <strong>and</strong> corresponding<br />
project management system.<br />
OK.RAIL System<br />
The ODOT <strong>Rail</strong> Programs Division’s<br />
<strong>Rail</strong> Assessment, Inventory, <strong>and</strong> Location<br />
inventory management system<br />
(OK.RAIL) represents the culmination<br />
of a massive collaborative effort<br />
to update information <strong>and</strong> improve<br />
the project management tools used<br />
to address engineering <strong>and</strong> safety<br />
issues at railroad crossings. ODOT<br />
hired Jacobs Engineering, Inc., to<br />
develop a comprehensive inventory<br />
of all railroad crossings in the state,<br />
along with a groundbreaking suite of<br />
OK.RAIL promotes efficiency by allowing staff to perform many<br />
functions from their offices that previously required a site visit.<br />
GIS-enabled applications that greatly increase ODOT’s effectiveness in administering the<br />
appropriation of federal funds for railroad crossing safety improvements. The OK.RAIL<br />
web-enabled inventory management system includes a map-based field data collection<br />
application (OK.FieldRAIL) <strong>and</strong> a centralized SQL Server database.<br />
ODOT maintains records for over 6,000 public <strong>and</strong> private railroad crossings across the<br />
state. An update of existing public crossing information was conducted using field crews<br />
equipped with state-of-the-art data collection technology, including ruggedized touch<br />
screen laptops, wireless digital cameras, <strong>and</strong> Bluetooth global positioning system (GPS) 1<br />
units. Using the OK.FieldRAIL database installed on the field laptops, crews used GPS <strong>and</strong><br />
built-in maps to navigate to crossings, where they collected inventory data as well as GPS<br />
location data, digital photographs, <strong>and</strong> measurements of any sight distance obstructions<br />
identified at passive crossing locations. The crossing data, including digital photographs,<br />
automatically synchronized to the central database on a nightly basis when the field laptops<br />
were connected to the internet.<br />
Data collected through the field inventory is viewed <strong>and</strong> managed within OK.RAIL, a<br />
GIS-based data management system that provides the ODOT staff with rich, up-to-date<br />
data on all crossings in the state. It also includes mapping, searching, <strong>and</strong> reporting<br />
1<br />
GPS is a system that indicates position of the receiver on the earth’s surface by triangulating reference signals from satellites<br />
orbiting in space.<br />
May 2012 9-5
Chapter 9<br />
capabilities that have drastically increased the <strong>Rail</strong> Programs Division’s efficiency in coordinating<br />
safety project activities. OK.RAIL features include<br />
• Inventory data viewing, editing, <strong>and</strong> quality assurance/quality control functionality<br />
• Powerful searching <strong>and</strong> reporting<br />
• Printing <strong>and</strong> exporting (including export to FRA format)<br />
• Digital photo uploading <strong>and</strong> viewing<br />
• Fully integrated GIS map<br />
• External links to commercial mapping systems (such as Google maps <strong>and</strong> Virtual<br />
Earth)<br />
• Comprehensive project tracking <strong>and</strong> document control<br />
• Prioritization of safety expenditures at crossings considered the most critical<br />
based on crossing controls, traffic volumes, <strong>and</strong> safety data that includes historical<br />
crash data<br />
The OK.RAIL Safety Module draws from state <strong>and</strong> federal crash records to provide a<br />
history of collisions at each crossing <strong>and</strong> utilizes this information in conjunction with<br />
traffic <strong>and</strong> inventory data to calculate crossing priority rankings utilized for safety<br />
improvements. ODOT utilizes these rankings to select crossings to hold diagnostic team<br />
inspections that include participation from the railroads, FHWA, <strong>and</strong> local entities with<br />
jurisdictional authority for the roadway. After the project locations have been identified,<br />
the Projects Module helps track the progress of each individual project from inception to<br />
completion. The result of this process is that federal funding for grade crossing improvements<br />
is spent more effectively at crossings with characteristics deemed most critical,<br />
thereby increasing crossing safety throughout <strong>Oklahoma</strong>.<br />
OK.RAIL measure of effectiveness<br />
The effectiveness of the OK.RAIL system continues to be measured based on<br />
• Further reductions of crashes <strong>and</strong> fatalities in <strong>Oklahoma</strong><br />
• Provision of vastly improved resources for supporting the decisions of the ODOT<br />
<strong>Rail</strong> Programs Division staff as well as their local <strong>and</strong> federal counterparts<br />
• Further collaboration between stakeholders involved in railroad crossing safety<br />
projects<br />
OK.RAIL formalizes <strong>and</strong> automates the recommended federal algorithm for evaluating<br />
crossings <strong>and</strong> prioritizing improvements based on a prediction of anticipated accident<br />
frequency for each location. Additionally, the database enhances ODOT’s ability to track<br />
safety improvement projects as well as the appropriation of safety funds allocated to those<br />
improvements, thereby helping to ensure the continued efficient use of federal safety<br />
funds. The analytical methods used to rank the crossings in order of priority for improvement/upgrade<br />
are based on FRA’s Accident Prediction Model. The resulting rankings are<br />
used to identify crossing locations to be included in the safety program each year. These<br />
programs are coordinated on an annual basis in conjunction with FHWA, local entities,<br />
<strong>and</strong> the railroads to implement safety improvements at high-priority crossings. These<br />
improvements include the elimination of crossings, upgrade of existing active warning<br />
devices, upgrade of safety devices to meet minimum requirements (e.g., crossbucks,<br />
advanced warning signs, pavement markings), <strong>and</strong> installation of active warning devices<br />
at priority locations with only passive warning devices.<br />
9-6<br />
<strong>Oklahoma</strong> <strong>Statewide</strong> <strong>Freight</strong> <strong>and</strong> <strong>Passenger</strong> <strong>Rail</strong> <strong>Plan</strong>
<strong>Oklahoma</strong> Department of Transportation <strong>Rail</strong> Programs<br />
OK.RAIL has significantly increased the resources readily available to the <strong>Rail</strong> Programs<br />
Division for reviewing <strong>and</strong> updating crossing inventory information as well as track<br />
ongoing or completed safety improvements. In addition to providing a rich data set of<br />
information on each crossing that includes crossing controls, collision history, traffic volumes,<br />
<strong>and</strong> digital photographs, the database allows ODOT staff quick <strong>and</strong> easy access to<br />
all aspects of the data. The database includes interactive GIS maps of crossings that allow<br />
the crossings to be symbolized based on a variety of criteria. These powerful searching <strong>and</strong><br />
reporting capabilities allow <strong>Rail</strong> Programs Division staff to analyze <strong>and</strong> better underst<strong>and</strong><br />
the status of railroad crossings. Once a crossing is identified for potential improvements,<br />
ODOT works with stakeholders to diagnose needed upgrades, secure funding, <strong>and</strong> coordinate<br />
project logistics. OK.RAIL supports these efforts by identifying the prioritized list<br />
of crossings to be improved, providing a rich data set of existing conditions, <strong>and</strong> allowing<br />
safety projects to be closely tracked throughout the project life cycle.<br />
OK.RAIL innovative methods<br />
Data collection<br />
OK.RAIL utilizes innovative techniques for a number of activities <strong>and</strong> has significantly<br />
modernized the tools <strong>and</strong> procedures utilized for collecting, managing, analyzing, <strong>and</strong><br />
reporting rail crossing data. Prior to the implementation of field data collection, the database<br />
is preloaded with the crossing locations <strong>and</strong> controls inventory from FRA as well as<br />
previous field data collected by ODOT. The crossing locations <strong>and</strong> crossing status are utilized<br />
to develop field data collection activities <strong>and</strong> scheduling. These procedures include<br />
sectioning the state into regions <strong>and</strong> assigning crossings to specific field crews in order to<br />
minimize travel <strong>and</strong> increase data collection efficiency.<br />
During field data collection, the field data collection crew utilizes an interactive map<br />
that tracks the crew’s location via GPS to assist in navigation to the next crossing on the<br />
assigned list. Upon arrival at a crossing, the data collection tool automatically identifies<br />
the location of the crossing via the GPS unit. The data collection crew fills out electronic<br />
forms for the crossing inventory information <strong>and</strong> utilizes a digital camera to obtain<br />
photographs of the crossing from multiple perspectives, as well as a photo of the crossing<br />
identification number posted at the crossing. These digital photographs are transmitted<br />
wirelessly back to the data collection tool <strong>and</strong> tagged with the crossing number <strong>and</strong> crewselected<br />
captions prior to being uploaded into the database for each crossing. Automated<br />
quality control checks are used to validate the new data <strong>and</strong> alert the crews of potential<br />
data problems prior to its leaving the crossing. These innovative data collection techniques<br />
significantly increase data quality <strong>and</strong> data collection efficiency by identifying potential<br />
data problems while the crew is at the crossing during the inventory.<br />
Data synchronization<br />
Another innovation of the OK.RAIL system is the use of daily data synchronization<br />
between individual field crews <strong>and</strong> a central database. OK.FieldRAIL uses a portable copy<br />
of the central database, allowing field crews to collect information in the field without an<br />
internet connection. When the field laptops are connected to the internet, they synchronize<br />
with the central database, uploading field data collected since the last synchronization<br />
May 2012 9-7
Chapter 9<br />
was performed (including all digital photos) <strong>and</strong> downloading new data <strong>and</strong> photo<br />
thumbnails collected by all other data collection crews during the same time period.<br />
Through the synchronization process, the field data can be reviewed by project managers<br />
within hours of the data being collected in the field, <strong>and</strong> missing or incorrect data can be<br />
discovered <strong>and</strong> resolved before crews move on to another region of the state. Regular synchronization<br />
also helps ensure that no overlapping data collection efforts occur <strong>and</strong> allow<br />
ODOT to review as well as utilize the data soon after collection. The progress of each crew<br />
can also be tracked daily through the built-in GIS mapping system, helping managers to<br />
identify inefficient methods.<br />
Search <strong>and</strong> mapping<br />
Innovations in the OK.RAIL management system include powerful search <strong>and</strong> mapping<br />
capabilities that have transformed the <strong>Rail</strong> Programs Division safety program by providing<br />
the ability to much more efficiently investigate, underst<strong>and</strong>, <strong>and</strong> report pertinent<br />
information for railroad crossings throughout the state. Printable crossing reports allow<br />
<strong>Rail</strong> Programs Division staff to review crossing information prior to a field visit or stakeholder<br />
meeting. The Project Tracking Module compiles project status information <strong>and</strong> any<br />
associated documentation in one easy-to-access system. These capabilities provide Division<br />
staff with a summary of the overall status of the safety program as well as the ability<br />
to obtain individual project data or documentation related to each individual location.<br />
Finally, the Safety Module provides Division staff unprecedented access to safety information<br />
that includes (1) a searchable database of all recorded collisions at each individual<br />
crossing <strong>and</strong> (2) a prioritization ranking management tool that provides prioritization<br />
calculations, records decisions regarding crossing diagnostics, identifies locations eligible<br />
for safety funding, <strong>and</strong> assists in the development of new project activities to be included<br />
in the safety program.<br />
Efficient use of resources<br />
The OK.RAIL system has allowed the <strong>Rail</strong> Programs Division to coordinate safety-related<br />
improvements more efficiently by providing automated tools for the coordination of<br />
numerous time-consuming tasks. Expensive visits to crossings for review of existing<br />
information have been reduced through the availability of high-resolution photographs<br />
<strong>and</strong> comprehensive inventory data as well as reliable location data. GPS locations combined<br />
with maps <strong>and</strong> aerial photography provide a comprehensive view of the geometry of<br />
each crossing as well as any nearby roadway infrastructure that might impact operations<br />
at the crossing. OK.RAIL also provides an automated output of crossing data in the FRA<br />
st<strong>and</strong>ard format, providing for the more efficient <strong>and</strong> accurate upload of updated crossing<br />
information into the FRA database.<br />
School Bus Inventory Data<br />
Potentially hazardous situations or location characteristics that could impair a school bus<br />
operator’s ability to process an adequate amount of information for safe operation along<br />
the route has been provided below. These potential driving hazards were selected because<br />
the mere existence of these conditions could result in serious consequences. While other<br />
potentially hazardous situations or location characteristics could develop at any time (i.e.,<br />
9-8<br />
<strong>Oklahoma</strong> <strong>Statewide</strong> <strong>Freight</strong> <strong>and</strong> <strong>Passenger</strong> <strong>Rail</strong> <strong>Plan</strong>
<strong>Oklahoma</strong> Department of Transportation <strong>Rail</strong> Programs<br />
a tree falling across a roadway, water over a roadway, icy conditions, the malfunction of a<br />
traffic control signal or highway-rail active warning device), this list represents an attempt<br />
to define fixed conditions that have been deemed a driving hazard. The list is also limited<br />
to hazardous situations/locations that are anticipated to be encountered during the<br />
normal operation of a school bus <strong>and</strong> not during loading <strong>and</strong> unloading operations. For<br />
each hazard potentially encountered along a school bus route, a list of factors or situations<br />
contributing to the cause of a hazard has been provided. Note that this list is not all-inclusive.<br />
State <strong>and</strong> local school districts may encounter factors or situations that may not have<br />
previously been experienced or are not considered a common enough occurrence to be<br />
included in the list but should, nonetheless, be deemed potentially hazardous. Following is<br />
information collected as part of the school bus inventory:<br />
Highway-rail grade crossings<br />
• Number of tracks/number of lanes<br />
• Visual obstructions (vertical/horizontal) impairing the operator’s interpretation of<br />
the type of intersection <strong>and</strong> travel speed of trains/motor vehicles<br />
• ADT/trains per day<br />
• Presence/absence of highway-rail active warning devices<br />
• Unique characteristics of the crossing, including type of train operations (mainline,<br />
switching), type of warning devices (cantilevered, gated), adjacent roadway<br />
intersection(s)<br />
• Presence/absence of traffic signals/signs, highway-rail passive/active warning<br />
devices, advanced warning devices/signs, preemption or interconnection between<br />
traffic signals <strong>and</strong> railroad active warning devices<br />
• Length of the queuing area(s) before <strong>and</strong> after the tracks<br />
• Anticipated traffic conditions at various times during the day (peak hour queuing)<br />
• Roadway design/geometrics/operating conditions near the grade crossing (roadway<br />
operating speeds, skew, proximity of adjacent roadway intersections, surface<br />
conditions)<br />
Hazardous intersections <strong>and</strong> roadways<br />
• High-frequency crash locations as defined by state transportation <strong>and</strong> lawenforcement<br />
officials<br />
• Non-controlled intersections<br />
• Curves, intersections, or grades with limited sight distance(s)<br />
• Areas with no shoulders (impediment of stopping/collision avoidance)<br />
• Visibility of traffic control signals (vertical/horizontal sight distance)<br />
• Coordination of traffic control signals with other traffic control signals or preemption/interconnection<br />
with highway-rail active warning devices<br />
Bridges, tunnels/underpasses, <strong>and</strong> overpasses<br />
• Weight capacity<br />
• Height clearances<br />
• Lane widths<br />
May 2012 9-9
Chapter 9<br />
<strong>Oklahoma</strong> Highway-<strong>Rail</strong> Crossing Crash Data<br />
The automobile collisions from across <strong>Oklahoma</strong> are reported by the <strong>Oklahoma</strong> Highway<br />
Patrol, city police, county sheriffs, university police, or game wardens. They are forwarded<br />
to the <strong>Oklahoma</strong> Department of Public Safety (DPS), where they are either directly stored<br />
electronically or h<strong>and</strong>-coded, scanned, <strong>and</strong> stored electronically into a master database.<br />
These electronic collision data are transferred weekly to the master collision file at ODOT.<br />
The Collision Analysis <strong>and</strong> Safety Section conducts a review on each collision adding the<br />
correct location codes to match the ODOT highway, city street, or county road location<br />
files. Collisions involving highway-rail grade crossings are cross referenced to the data<br />
in the highway-rail crossing inventory for the respective AAR-DOT Crossing Number 2<br />
to help ensure that the appropriate codes match the crossing inventory data. In the event<br />
discrepancies are identified, any data in question are reviewed by <strong>Rail</strong> Programs Division<br />
personnel to populate any missing data fields or resolve any conflicting data elements.<br />
The transfer of data from DPS to ODOT <strong>and</strong> to the University of <strong>Oklahoma</strong> for final<br />
entry into the master collision file normally occurs on Friday of the same week or Monday<br />
of the following week when is it submitted by DPS. After all the collision data have<br />
been coded for each week, the location codes are transferred back into the ODOT master<br />
collision files. A copy of any collisions loaded or corrected each week is electronically<br />
transmitted to a computer server maintained on the <strong>Oklahoma</strong> University campus, where<br />
the revised data elements are merged into the master collision file database. These data are<br />
accessible through a web-based program (Safe-T) where the user is allowed to select from<br />
a variety of reporting criteria to generate reports containing desired information. Safe-T<br />
provides access to the collision data for the <strong>Oklahoma</strong> Highway Patrol, city police, city<br />
planners, <strong>and</strong> other entities having a need for collision information, including engineers<br />
<strong>and</strong> safety personnel at ODOT.<br />
ODOT Graphical Resource Intranet Portal Database<br />
The Graphical Resource Intranet Portal (GRIP) database is a web application that allows<br />
users to query, overlay, map, <strong>and</strong> report on many of ODOT’s business data layers. Highway-rail<br />
crossing data were one of the first GPS location databases to be collected <strong>and</strong><br />
inventoried statewide. Consequently, these data were identified as a business layer <strong>and</strong><br />
utilized in the initial population <strong>and</strong> further development of the ODOT GRIP Database<br />
providing recently updated baseline data that could assist in the development of data<br />
utilization <strong>and</strong> reporting methods for similar roadway <strong>and</strong> bridge data. <strong>Rail</strong>road crossing,<br />
county bridge, <strong>and</strong> hazard elimination projects eligible for federal funding currently have<br />
specific inventory requirements tied directly to the data requirements deemed necessary<br />
for the allocation of safety funding under current federal legislative guidelines. The data<br />
available from GRIP is accessed utilizing workflows developed to display location, theme,<br />
attribute, historical, mileage, inspection, <strong>and</strong> mapping data for specific business layers<br />
identified to be useful for ODOT program <strong>and</strong> project management activities. Following<br />
are basic workflows for building maps or reports:<br />
2<br />
A national grade crossing numbering system to assist in the collection <strong>and</strong> maintenance of information regarding crossings.<br />
The system is jointly organized by the FRA <strong>and</strong> the Association of American <strong>Rail</strong>roads.<br />
9-10<br />
<strong>Oklahoma</strong> <strong>Statewide</strong> <strong>Freight</strong> <strong>and</strong> <strong>Passenger</strong> <strong>Rail</strong> <strong>Plan</strong>
<strong>Oklahoma</strong> Department of Transportation <strong>Rail</strong> Programs<br />
• Opening a business layer includes specific categories of interest that have been<br />
identified as areas of primary interest for ODOT construction <strong>and</strong> management<br />
activities (i.e., pavement management, bridges, needs analysis, accidents, inventory,<br />
at-grade railroad crossing, speed zones, <strong>and</strong> HPMS).<br />
• Displaying a Division Level Theme allows for the identification of specific available<br />
data sorted by Division (i.e., at-grade control type, concrete crossing surfaces,<br />
advanced warning devices, pavement markings)<br />
• Displaying Map Features allow the attributes selected for a specific map theme to<br />
be highlighted on the map (i.e., grade separated highway-rail crossing locations,<br />
highway-rail at-grade crossings with flashing lights)<br />
• Displaying Attributes based on Query allows the available data to be queried by<br />
physical <strong>and</strong> location attributes (i.e., crossing surface types, division, county)<br />
• Displaying Attributes by Map Click allows the user to click on a map feature to<br />
display the attributes for the feature after the maps are built <strong>and</strong> themes applied.<br />
• Displaying Photographs allows photographs of specific locations to be viewed by<br />
clicking links in the attributes tab (i.e., approach a, approach b, track left, track<br />
right, crossing fields)<br />
• Displaying Imagery allows background imagery to be projected on to the maps<br />
being built, however the type of background imagery is limited by availability in<br />
the specific area being mapped.<br />
• Displaying Imagery from Legend allows images included in the legend for certain<br />
types of maps to be displayed on the mapping.<br />
• Displaying Mileage Report allows corresponding mileage reports to be generated<br />
for the maps built during the analysis or query.<br />
• Displaying Highway Mileage Report allows corresponding highway mileage<br />
reports to be generated for the maps built during the analysis or query.<br />
• Displaying Bridge Inspection Report allows bridge inspection reports to be generated<br />
for the maps built during the analysis or query.<br />
• Displaying Interstate Structural History allows attributes from historical data<br />
associated with Interstate construction <strong>and</strong> maintenance to be displayed on the<br />
maps built during the analysis or query.<br />
The primary users of the GRIP database are ODOT field division personnel responsible<br />
for new construction projects, the maintenance of minimum requirement safety or signing<br />
installation, or the maintenance of existing highway infrastructure throughout the<br />
state’s rural <strong>and</strong> urban areas. Other users include Central Office Division, city, county,<br />
MPO personnel, <strong>and</strong> personnel from any government entity interested in utilizing GRIP<br />
data for project management, needs analysis, safety, or enforcement. Users from agencies<br />
or other government entities must request <strong>and</strong> be granted access from ODOT. Data<br />
for the GRIP database is updated automatically through automated routines that regularly<br />
update the associated data repository from multiple legacy data sources throughout<br />
ODOT. GRIP provides tools that consistently monitor <strong>and</strong> analyze roadways, bridges <strong>and</strong><br />
crashes as well as overall highway performance improving the overall safety of <strong>Oklahoma</strong>’s<br />
transportation network.<br />
May 2012 9-11
Chapter 9<br />
State-owned <strong>Rail</strong> Infrastructure Inventory<br />
The <strong>Rail</strong> Programs Division recently contracted with Jacobs Engineering Inc. to collect<br />
infrastructure data on state-owned rail property. The data collection includes a continuous<br />
video of each segment coupled with GPS mapping to produce segment maps that<br />
list specific data elements collected to enable State-owned Property Section personnel<br />
to assess the condition of existing state-owned rail infrastructure. This data is utilized to<br />
plan <strong>and</strong> schedule necessary maintenance <strong>and</strong> capital improvements. Video data collected<br />
facing both forward <strong>and</strong> backward from a Hi-<strong>Rail</strong> 3 vehicle is reviewed to assess the condition<br />
of rail, ballast, <strong>and</strong> ties throughout each segment, <strong>and</strong> segment limits are identified<br />
where a succession of poor infrastructure components currently exist. The segment limits<br />
are tied to the milepost markers for each segment providing location information as well<br />
as the data necessary to quantify the materials <strong>and</strong> associated costs for any proposed<br />
improvements.<br />
The data has been transferred into both mapping <strong>and</strong> GIS-data-based applications that<br />
assist identifying <strong>and</strong> categorizing location data for any bridges, culverts, wayside signals,<br />
left turnout sidings, right turnout sidings, <strong>and</strong> wayside signing (i.e., whistle boards)<br />
along each route. The production maps are scaled using a ratio of 1 inch to 1,600 feet <strong>and</strong><br />
provide a spatial distribution of the data elements along each segment, complete with<br />
illustrative icons assigned to each specific data element or type of data, positioned on the<br />
maps using GPS location data <strong>and</strong> cross-referenced existing milepost data. An interactive<br />
application has been developed that allows <strong>Rail</strong> Programs Division personnel to view both<br />
videos while the location of the inventory data is referenced on the computer screen as<br />
well.<br />
The video data can be utilized as a tool to assess the condition of the rail, ballast, <strong>and</strong><br />
ties; however, the primary source for this type of distress information can more readily<br />
be obtained from segment maps that can be generated for individual segments identified<br />
by milepost limits. Each distress data element was captured as a single point GPS<br />
feature that indicates the type of distress with an associated illustrative icon referenced in<br />
the legend for the map. The corresponding video data will also serve as a tool to identify<br />
vegetative obstructions, clean-up areas, drainage issues, <strong>and</strong> encroachment by adjacent<br />
l<strong>and</strong>owners. The video tool will also allow ODOT to conduct point-<strong>and</strong>-click assessments<br />
of the general area, including critical operating issues in the event an emergency arises<br />
or a concerned l<strong>and</strong>owner has an inquiry that can be referenced to route <strong>and</strong> milepost<br />
data. This location data helps facilitate planning <strong>and</strong> budgeting functions coordinated by<br />
State-owned Property Section personnel without extensive field data collection. The development<br />
of this tool minimizes the labor effort necessary to produce the cost estimates <strong>and</strong><br />
schedules necessary to administer funding for proposed rail infrastructure improvements.<br />
Another feature of the mapping is the identification of the limits of the railroad rightof-way<br />
throughout each segment, including tangent sections, curved sections, rail yards,<br />
<strong>and</strong> any other components of the adjacent infrastructure. This data was digitized from<br />
many dozens of historic maps dating back to the early 1900s to facilitate the identification<br />
of any additional property acquisition that may be necessary to complete any proposed<br />
3<br />
A highway vehicle fitted with retractable rail wheels permitting operation on both the highway <strong>and</strong> the rails.<br />
9-12<br />
<strong>Oklahoma</strong> <strong>Statewide</strong> <strong>Freight</strong> <strong>and</strong> <strong>Passenger</strong> <strong>Rail</strong> <strong>Plan</strong>
<strong>Oklahoma</strong> Department of Transportation <strong>Rail</strong> Programs<br />
improvements <strong>and</strong> provide a detailed record of the limits <strong>and</strong> location of rail property<br />
owned by the state. The right-of-way limits have been transposed into mapping functions<br />
that allow right-of-way maps for each segment to be illustrated on current project plans,<br />
maps, or other graphic documentation. This mapping has been scaled relative to the scale<br />
of the historic right-of-way maps, <strong>and</strong> each sheet produced captures the original data from<br />
each scanned drawing. Title sheets produced using these tools reference each sheet back<br />
to the original scanned sheet that will be stored on ODOT’s server.<br />
ODOT <strong>Rail</strong> Programs Division Reports<br />
ODOT <strong>Rail</strong> Programs Division also produces <strong>and</strong> manages generation of reports addressing<br />
key rail issues in the state. Following is a list of recent documents:<br />
• Atlas of <strong>Oklahoma</strong> <strong>Rail</strong>roads <strong>and</strong> Their History, 1970<br />
• KDOT-ODOT Regional Service Development <strong>Plan</strong>, October 2011<br />
• Summary of Previous <strong>Oklahoma</strong> <strong>Passenger</strong> <strong>Rail</strong> Studies, December 2006<br />
• Measuring the Benefits of Intercity <strong>Passenger</strong> <strong>Rail</strong>: A Study of the Heartl<strong>and</strong> Flyer<br />
Corridor, April 2010<br />
• The Heartl<strong>and</strong> Flyer Amtrak <strong>Passenger</strong> Train Service: The TXOK Connection,<br />
March 2006<br />
• <strong>Rail</strong> Programs Division Management Guide <strong>and</strong> Procedural Manual, 2011<br />
• Annual State <strong>Rail</strong> System Map (updated every other year, includes all known rail<br />
lines for the entire state <strong>and</strong> indicates operator)<br />
• 1992 <strong>Oklahoma</strong> State <strong>Rail</strong> <strong>Plan</strong><br />
• Annual <strong>Oklahoma</strong> State of <strong>Rail</strong> Report for the Governor: 2002–2005<br />
• Kansas <strong>Rail</strong> Feasibility Study, March 2000<br />
• Cost Estimate Report for Midwest City to Downtown <strong>Oklahoma</strong> City Commuter<br />
<strong>Rail</strong> Project, June 2009<br />
• Heartl<strong>and</strong> Flyer Economic Benefit Report, April 2005<br />
• <strong>Oklahoma</strong> High-Speed <strong>Rail</strong> Initiative, <strong>Oklahoma</strong> City To Tulsa HSR Corridor Cost<br />
Study, February 2002<br />
• High-Speed <strong>Passenger</strong> <strong>Rail</strong> Feasibility Study, March 2001<br />
• TEMS Trackman 2.3 for Newton to <strong>Oklahoma</strong> City (Red Rock Subdivision),<br />
December 1998<br />
• TEMS Trackman 2.3 for Kansas City to Tulsa, December 1998<br />
• <strong>Oklahoma</strong> Amtrak Study, December 1998<br />
• Amtrak <strong>Oklahoma</strong> <strong>Rail</strong> <strong>Passenger</strong> Study, April 1996<br />
• Amtrak Proposal to Connect Missouri to <strong>Oklahoma</strong>, November 1994<br />
• 8-Year State-owned <strong>Rail</strong> Construction <strong>and</strong> Maintenance Work <strong>Plan</strong>, FY 2006 to<br />
2013<br />
• 8-Year State-owned <strong>Rail</strong> Construction <strong>and</strong> Maintenance Work <strong>Plan</strong>, FY 2008 to<br />
2015<br />
• <strong>Oklahoma</strong> <strong>Rail</strong>road Rehab Cost Study: <strong>Oklahoma</strong> East-West <strong>Freight</strong> <strong>Rail</strong> Connection,<br />
McAlester to Shawnee<br />
• State-owned Short line <strong>Rail</strong>roads 5-Year Funding Needs, 2004<br />
• <strong>Oklahoma</strong> <strong>Rail</strong>road Rehabilitation Cost Study: Bridgeport to Weatherford, April<br />
2002<br />
May 2012 9-13
Chapter 9<br />
• <strong>Oklahoma</strong> <strong>Rail</strong>road Rehabilitation Cost Study: Spaceport Project Dill City To Burns<br />
Flat, September 2003<br />
• ODOT State-owned <strong>Rail</strong> Lease Agreements (Multiple)<br />
• ODOT <strong>Rail</strong>road Purchase Agreements (Multiple)<br />
9-14<br />
<strong>Oklahoma</strong> <strong>Statewide</strong> <strong>Freight</strong> <strong>and</strong> <strong>Passenger</strong> <strong>Rail</strong> <strong>Plan</strong>
10. Multimodal <strong>Freight</strong> Transportation<br />
in <strong>Oklahoma</strong><br />
OKLAHOMA<br />
STATEWIDE FREIGHT &<br />
PASSENGER RAIL PLAN<br />
Multimodal transport involves two or more modes of transportation for the movement of<br />
freight from origin to destination. This section focuses on the connectivity between transportation<br />
modes by identifying <strong>and</strong> describing <strong>Oklahoma</strong>’s multimodal connections <strong>and</strong>,<br />
specifically, connections with rail infrastructure <strong>and</strong> access. For the purpose of this plan,<br />
<strong>Oklahoma</strong>’s multimodal connections are categorized into four types of facilities:<br />
• Intermodal container/trailer transfer terminals<br />
• Transload facilities<br />
• Industrial parks/logistics centers<br />
• Port facilities<br />
<strong>Oklahoma</strong> is served by three Class I railroads providing rail access to locations throughout<br />
the state <strong>and</strong> the U.S. The rail network also connects with other forms of freight<br />
transportation allowing for integrated freight services that make best use of each mode.<br />
MKARNS, along with the Tulsa Port of Catoosa <strong>and</strong> Port of Muskogee, give shippers the<br />
alternative of using barges as a cost-effective mode of transportation. <strong>Oklahoma</strong>’s highway<br />
infrastructure <strong>and</strong> local road networks provide truck access throughout the state. While<br />
water <strong>and</strong> motor carriers compete with rail transportation, they are increasingly working<br />
with the railroads to provide shippers with more efficient movement of goods.<br />
<strong>Rail</strong> Intermodal Transportation<br />
Intermodal transportation is commonly defined as the movement of goods by rail in<br />
trailers or containers on specialized flatcars. This method of freight transportation interconnects<br />
the movement of cargo by any combination of rail, truck, <strong>and</strong> waterborne<br />
carriers over that cargo’s journey.<br />
The transportation of truck trailers (trailers-on-flat-car) was the first application of intermodal<br />
technology. Trailers, however, were limited to use in domestic markets. In addition,<br />
the economics of trailers-on-flat-car transportation were not favorable enough to allow<br />
railroads to compete with motor carriers in all but a few markets.<br />
The introduction of containers-on-flat-car technology eliminated the need to transport<br />
the wheels of a truck trailer, reducing cost by reducing weight. The use of containers also<br />
opened international markets to intermodal transportation as boxes could be readily<br />
exchanged between the railroads <strong>and</strong> ships.<br />
The most important development, however, has been the invention of the double-stack<br />
freight car because it revolutionized the economics of container transportation. Trains<br />
increased their capacity without increasing costs. In the last three decades, the railroads<br />
invested heavily in their infrastructure to accommodate trains with stacked containers.<br />
May 2012 10-1
Chapter 10<br />
Intermodal container/trailer terminal feasibility in <strong>Oklahoma</strong><br />
In 2005, BNSF closed its intermodal terminal in Flynn (adjacent to <strong>Oklahoma</strong> City) due<br />
to a lack of dem<strong>and</strong>. When BNSF closed this terminal, <strong>Oklahoma</strong> lost its only container<br />
transfer facility. At the time of its closing, the terminal processed 1,200 trailers each<br />
month but no containers. A viable terminal today h<strong>and</strong>les at least 10,000 containers each<br />
month. Since then, <strong>Oklahoma</strong> rail intermodal shippers have had to move containers by<br />
truck to terminals in other states. Dallas-Fort Worth, Kansas City, <strong>and</strong> Denver each have<br />
major intermodal terminals operated by BNSF <strong>and</strong> UP. Given the relatively short distances<br />
to these three metropolitan areas, it is unlikely that one of the major railroads would<br />
establish a new intermodal terminal in <strong>Oklahoma</strong>.<br />
Trailer <strong>and</strong> container transfer terminal locations<br />
Several factors determine the success of intermodal terminals. They are important considerations<br />
when railroads select locations for new terminals.<br />
Terminals must be located on the railroad intermodal network<br />
In recent years, railroads have invested heavily in developing efficient intermodal<br />
networks. <strong>Rail</strong>roads upgraded key routes throughout the country to accommodate<br />
double-stack container trains by eliminating obstacles that prohibit operating these trains.<br />
The lines were also upgraded to permit higher speed operations by straightening track<br />
curves, reducing grades, <strong>and</strong> increasing the number of tracks. The upgrades also exp<strong>and</strong>ed<br />
the capacity of the lines.<br />
For the most part, short line railroads do not participate in intermodal service. The cost<br />
of intermodal terminals <strong>and</strong> the need for speed have prevented short line railroads from<br />
any meaningful participation. A truck can deliver a container to an intermodal terminal<br />
in a far shorter amount of time than would be required to (1) drive to a short line railroad<br />
intermodal terminal, (2) move the container onto a flat car, <strong>and</strong> (3) then transfer the flat<br />
car to the connecting Class I railroad.<br />
Both <strong>Oklahoma</strong> City <strong>and</strong> Tulsa are located on the BNSF <strong>and</strong> UP intermodal networks.<br />
Terminal volumes must be sufficient to support frequent, long trains<br />
Because of the high fixed costs of train operations, the economics of rail transportation<br />
favor long trains. Train crews are paid the same regardless of the number of cars. In addition,<br />
a long train consumes the same track capacity as a short train. Double-stack trains<br />
transporting 240-foot-long containers have become the norm with the railroads continually<br />
experimenting with longer trains carrying twice that number of containers. Large<br />
volumes are required to fill the longer trains at schedule frequencies required by shippers.<br />
Large volumes are also required for cost-effective terminal operations. <strong>Rail</strong>road terminals<br />
are capital-cost intensive. Large container volumes are required to offset the fixed costs of<br />
the terminals. Although each terminal is a specific situation, typically an annual volume of<br />
100,000 to 150,000 containers is required for a terminal to be viable.<br />
10-2<br />
<strong>Oklahoma</strong> <strong>Statewide</strong> <strong>Freight</strong> <strong>and</strong> <strong>Passenger</strong> <strong>Rail</strong> <strong>Plan</strong>
Multimodal <strong>Freight</strong> Transportation in <strong>Oklahoma</strong><br />
The ability to attract the volume required to support a terminal in <strong>Oklahoma</strong> is questionable.<br />
Although the <strong>Oklahoma</strong> economy has grown substantially since the last terminal was<br />
closed, the volume level required is significantly higher than the former <strong>Oklahoma</strong> City<br />
terminal.<br />
Terminals must be optimally spaced<br />
A third factor in the feasibility of an intermodal container terminal is its proximity to the<br />
other similar terminals <strong>and</strong> the marketplace. There are several considerations concerning<br />
spacing. First, from a market perspective, terminals should avoid having overlapping geographic<br />
market areas except in locations with a large population or significant economic<br />
activity. A new terminal in <strong>Oklahoma</strong> would encroach on the market space of terminals<br />
currently being developed in neighboring states, along with existing terminals. A second<br />
consideration is the geographic configuration of the market. With intermodal service<br />
competitive only in corridors of 800 miles or more, the truck movements to be converted<br />
to intermodal need to exceed that threshold. Similarly, terminal spacing should reflect<br />
that.<br />
The immediate development of new intermodal container terminals is questionable for<br />
the reasons just outlined. Even were conditions to change, it is not necessarily the role of<br />
the state to invest in intermodal facilities. That is the role of a railroad or a private investor<br />
working closely with the railroad.<br />
Transloading<br />
Transloading is another form of freight transfer between transportation modes. Like intermodal<br />
freight, transloading freight occurs because of delivery constraints (i.e., a freight<br />
shipper or receiver can only access one mode) or there are financial benefits to switching<br />
modes during shipping. However, unlike intermodal transportation where freight is<br />
moved <strong>and</strong> transferred using containers, the freight itself is transferred between modes.<br />
Transload operations involve products shipped either in bulk or as semi-bulk, dimensional<br />
cargo. Bulk shipments fall into two categories—dry <strong>and</strong> liquid. Dry bulk<br />
commodities are shipped in unpackaged quantities <strong>and</strong> can be stored in an open stockpile<br />
(aggregates, minerals, ore, etc.) or in covered storage, such as silos (grain). Liquids (petroleum,<br />
chemicals) are moved in rail cars, trucks, or barges with tanks or in pipelines <strong>and</strong><br />
stored in larger tanks.<br />
Grain elevators are a type of transload facility. Grain is delivered to the elevator by truck<br />
where it is stored <strong>and</strong> eventually transferred to covered hopper rail cars. The elevator<br />
serves the purpose of consolidating smaller shipments into freight car or train size lots<br />
<strong>and</strong> storing grain until dem<strong>and</strong> appears. <strong>Oklahoma</strong> has approximately 100 rail-served<br />
elevators. Figure 10-1 shows a grain elevator, one form of a transload facility.<br />
May 2012 10-3
Chapter 10<br />
Figure 10-1<br />
Bulk transload—grain elevator<br />
Source: www.bnsf.com/customers/grain-facilities/elevators/bin9/ele2379.html<br />
Figure 10-2<br />
Dimensional transload—rail to<br />
storage yard to truck<br />
Source: www.upds.com/customers/attachments/transload/transload_works.pdf<br />
Some dimensional commodities are shipped packaged or bailed but are typically too large<br />
to be shipped in a container. They are stored in the open (lumber, steel) or in a warehouse<br />
(paper rolls, boxed freight, etc.). Figure 10-2 shows a crane loading steel from the storage<br />
yard to the flatbed truck.<br />
Table 10-1 lists the transload, dry bulk, liquid bulk, <strong>and</strong> auto facilities in <strong>Oklahoma</strong> that<br />
have rail access. <strong>Rail</strong>-served grain elevators are shown in Figure 10-2.<br />
10-4<br />
<strong>Oklahoma</strong> <strong>Statewide</strong> <strong>Freight</strong> <strong>and</strong> <strong>Passenger</strong> <strong>Rail</strong> <strong>Plan</strong>
Multimodal <strong>Freight</strong> Transportation in <strong>Oklahoma</strong><br />
Facility Facility Type City <strong>Rail</strong>road<br />
Watco Transload Transload <strong>Oklahoma</strong> City BNSF, UP,<br />
SLWC<br />
D&M<br />
Distribution<br />
<strong>Oklahoma</strong> City<br />
Reload<br />
<strong>Rail</strong><br />
Car<br />
Spots Storage Area Commodities<br />
70 Open: 2.4 million<br />
square feet<br />
Dry bulk, liquid<br />
bulk, dimensional<br />
Stroud SLWC n/a n/a Petroleum—<br />
railcar to pipeline<br />
Transload <strong>Oklahoma</strong> City BNSF 13 Warehouse: Dimensional<br />
185,000 square<br />
feet<br />
Transload <strong>Oklahoma</strong> City BNSF, SLWC 10 Open: 404,000 Dimensional<br />
square feet<br />
Blendstar Liquid bulk Del City SLWC 10 Tanks: 150,000 Ethanol, biodiesel<br />
gallons<br />
Tulsa n/a 5 n/a Ethanol<br />
National Tank<br />
Services<br />
Liquid bulk <strong>Oklahoma</strong> City n/a 23 n/a Chemicals,<br />
plastics,<br />
petroleum<br />
Plastic Express Liquid bulk Tulsa UP 18 n/a Plastics<br />
Stroud SLWC n/a n/a Plastics<br />
<strong>Oklahoma</strong><br />
Vehicle Facility<br />
Auto <strong>Oklahoma</strong> City BNSF 41 3,202 vehicle<br />
bays<br />
Autos<br />
Table 10-1<br />
<strong>Oklahoma</strong> rail transload<br />
facilities<br />
Source: BNSF <strong>and</strong> UP;<br />
BNSF = BNSF <strong>Rail</strong>way Company, UP = Union Pacific <strong>Rail</strong>rood, SLWC = Stillwater Central <strong>Rail</strong>road<br />
<strong>Rail</strong><br />
Facility City <strong>Rail</strong>road<br />
Car<br />
Spots<br />
Capacity<br />
(bushels) Commodities<br />
ADM Company<br />
Enid<br />
(Elevator A)<br />
BNSF, UP 70 7,700,000 Milo, soybeans, wheat<br />
36 11,100,000 Wheat, soybeans<br />
Enid<br />
(Elevator B)<br />
BNSF, UP,<br />
FMRC<br />
ADM Company/Farml<strong>and</strong> Enid UP 50 163,000 Milo, soybeans, wheat<br />
(Elevators Y&Z)<br />
Apache Farmers Co-op Apache UP 13 1,400,000 Grains<br />
Attebury Grain Temple WTJR 25 450,000 Milo, wheat<br />
Enid BNSF 30 3,078,000 Wheat, sorghum<br />
Bartlett Grain Southwest Boise City BNSF 10 745,000 Wheat, corn, sorghum<br />
Beachner Grain Inc. Afton BNSF 5 732,000 Wheat, sorghum, soybeans<br />
Big V Feeds McAlester AOK n/a n/a Grains<br />
Table 10-2<br />
<strong>Oklahoma</strong> rail-served grain<br />
elevators (continued on next<br />
page)<br />
May 2012 10-5
Chapter 10<br />
Table 10-2<br />
<strong>Oklahoma</strong> rail-served grain<br />
elevators (continued from<br />
previous page)<br />
Facility City <strong>Rail</strong>road<br />
Blackwell Co-operative<br />
Elevator Association<br />
<strong>Rail</strong><br />
Car<br />
Spots<br />
Capacity<br />
(bushels)<br />
Commodities<br />
Braman BNGR 11 1,000,000 Wheat, sorghum, corn,<br />
soybean<br />
Kildare BNSF 10 815,000 Wheat, soybeans, corn,<br />
sorghum<br />
Blackwell<br />
(Elevator 2)<br />
BNSF 5 185,000 Wheat, sorghum, corn,<br />
soybean<br />
Boise City Farmers Co-op Boise City BNSF 4 709,000 Wheat, sorghum<br />
BTR Terminal Muskogee UP 30 200,000 Grains<br />
Calumet Industries—Sold Calumet AT&L 10 555,000 Grains<br />
Geary AT&L 8 2,230,000 Grains<br />
Geary AT&L 15 240,000 Grains<br />
Cargill Hooker UP 10 2,000,000 Corn, milo, soybeans, wheat<br />
<strong>Oklahoma</strong> City n/a n/a n/a Grains<br />
Cassidy Grain Co. Frederick BNSF, UP, 30 1,175,000 Wheat, sorghum, corn<br />
GNBC,<br />
WTJR<br />
Manitou GNBC 10 464,000 Wheat<br />
Hollister n/a 26 500,000 Wheat<br />
CHS Inc dba Plains Partners Kingfisher UP<br />
15 1,100,000 Grains<br />
(shuttle)<br />
Collingwood Grain Altus WTJR 75 2,185,000 Grains<br />
ADM Company Guymon n/a 28 2,550,000 Corn, milo, soybeans, wheat<br />
Optima n/a 100 n/a Grains<br />
Tyrone UP 25 1,270,000 Corn, milo, wheat<br />
Consolidated Grain Barge Muskogee n/a 100 200,000 Grains<br />
Wheeler Brothers Enid BNSF 36 2,000,000 Grains<br />
Co-op Services Gr<strong>and</strong>field WT&J 25 756,000 Wheat<br />
Lawton BNSF 10 420,000 Wheat, sorghum, corn<br />
Custer City Farmers Co-op<br />
Exchange<br />
Custer City<br />
FMRC,<br />
GNBC<br />
26 1,300,000 Wheat<br />
Dacoma Farmers Co-op Dacoma BNSF 26 1,100,000 Wheat<br />
Duke Farmers Union Co-op Duke UP 10 417,000 Milo, soybeans, wheat<br />
Elevator<br />
El Reno Terminal Grain El Reno UP 8 850,000 Grains<br />
Elkhart Co-op Equity<br />
Exchange<br />
Keyes CVR 18 991,000 Wheat, sorghum, corn<br />
10-6<br />
<strong>Oklahoma</strong> <strong>Statewide</strong> <strong>Freight</strong> <strong>and</strong> <strong>Passenger</strong> <strong>Rail</strong> <strong>Plan</strong>
Multimodal <strong>Freight</strong> Transportation in <strong>Oklahoma</strong><br />
Facility City <strong>Rail</strong>road<br />
Farmers Cooperative<br />
Association<br />
Farmers Cooperative<br />
Association of Alva<br />
Farmers Cooperative<br />
Exchange<br />
Farmers Cooperative<br />
Association<br />
Farmers Cooperative Mill &<br />
Elevator, Assoc.<br />
<strong>Rail</strong><br />
Car<br />
Spots<br />
Capacity<br />
(bushels)<br />
Commodities<br />
Anadarko UP 10 26,000 Grains<br />
Clinton GNBC 26 1,250,000 Wheat, sorghum<br />
Avard BNSF 12 200,000 Wheat<br />
Eldorado BNSF 123 2,139,000 Wheat, sorghum<br />
Perry BNSF 6 500,000 Wheat, soybeans, corn,<br />
sorghum, barley<br />
Capron BNSF 8 489,000 Wheat<br />
Alva (Elevator BNSF 4 1,000,000 Wheat<br />
B)<br />
Alva (Elevator BNSF 54 1,900,000 Wheat<br />
A)<br />
Weatherford FMRC 26 2,300,000 Wheat, Sorghum, Soybeans,<br />
Corn, Oats<br />
Bessie GNBC 26 714,000 Wheat<br />
Snyder<br />
BNSF, 27 1,179,000 Wheat, sorghum<br />
GNBC,<br />
FMRC<br />
Hobart BNSF 18 75,000 Wheat<br />
Farmers Elevator Company Goodwell UP 8 1,374,000 corn, milo, other, soybeans,<br />
wheat<br />
Ames GNBC 13 613,000 wheat, rye<br />
Drummond GNBC 9 597,000 wheat, soybean<br />
Farmers Exchange Helena BNSF 15 690,000 Wheat<br />
McWillie BNSF 10 500,000 Wheat<br />
Grain Co. (Elevators Y&Z) Enid BNSF, UP, 110 28,280,000 Wheat, sorghum, corn<br />
Farmrail<br />
(shuttle)<br />
Hansen Mueller Broken Arrow UP 3 153,000 Corn, other, wheat<br />
Humphreys Coop Elevator Altus BNSF,<br />
28 443,500 Wheat, sorghum<br />
WT&J<br />
Blair FMRC 17 45,000 Wheat<br />
Olustee BNSF 26 34,000 Wheat<br />
Inola Feed & Supply Inola UP 10 105,000 Grains<br />
Johnston Seed Enid UP 1 250,000 Rye, malt, wheat, corn,<br />
sunflower<br />
Morrison Grain <strong>and</strong> Ag Morrison BNSF 7 205,000 Wheat, soybeans<br />
Services<br />
North Caddo Co-op Hinton AT&L 20 135,000 Wheat<br />
Gavilon<br />
Tulsa Port<br />
Authority<br />
BNSF,<br />
SK&O<br />
27 4,000,000 Wheat, sorghum, soybeans,<br />
oats<br />
Table 10-2<br />
<strong>Oklahoma</strong> rail-served grain<br />
elevators (continued from<br />
previous page)<br />
May 2012 10-7
Chapter 10<br />
Table 10-2<br />
<strong>Oklahoma</strong> rail-served grain<br />
elevators (continued from<br />
previous page)<br />
<strong>Rail</strong><br />
Facility City <strong>Rail</strong>road<br />
Car<br />
Spots<br />
Capacity<br />
(bushels) Commodities<br />
<strong>Plan</strong>ters Co-operative<br />
Association<br />
Elmer FMRC 26<br />
26<br />
n/a<br />
571,000<br />
FMRC<br />
Wheat, sorghum<br />
Altus<br />
(St<strong>and</strong>ard)<br />
FMRC,<br />
WT&J<br />
Cambridge FMRC 13 351,000 Wheat<br />
Hobart GNBC 11 13,200,000 Wheat, soybean<br />
Lone Wolf FMRC 80 1,300,000 Wheat<br />
Lugert FMRC 17 112,000 Wheat<br />
Roosevelt (C/ GNBC 18 243,000 Wheat<br />
Elevator)<br />
Roosevelt (W/ GNBC 12 440,000 Wheat<br />
Elevator)<br />
Purina Mills <strong>Oklahoma</strong> City n/a 11 n/a Grains<br />
R. A. Ford & Son Gage BNSF 1 8,000 Corn, sorghum, oats, barley<br />
Rocky Farmers Cooperative Dill City FMRC 26 131,000 Wheat, sorghum<br />
Rocky GNBC 14 1,062,000 Wheat, sorghum<br />
Sayre Grain & Farm Supply Sayre FMRC 9 192,000 Wheat, sorghum, corm, oats<br />
Schroeder Grain Elm Street El Reno UP 7 500,000 Grains<br />
Sentinel Farmers Co-op Sentinel FMRC 26 919,000 Wheat, sorghum<br />
Sooner Co-op, Inc. Okeene GNBC 13 286,800 Wheat, sorghum<br />
Temple Co-op Branch Temple WT&J 7 200,000 Grains<br />
Temple Milling Waurika UP 10 50,000 Grains<br />
Texhoma Wheat Grow Texhoma UP 25 3,500,000 Corn, milo, wheat<br />
The Hooker Equity<br />
Hooker UP 14 2,700,000 Corn, milo, wheat<br />
Exchange<br />
Tillman Producers Co-op Frederick UP, WT&J, 26 900,000 Wheat, sorghum, corn<br />
GNBC<br />
Hollister WT&J 25 340,000 Corn, milo, wheat<br />
Tipton Farmers Co-op Tipton WT&J 10 410,000 Grains<br />
Todd Fees Grain El Reno UP 14 1,200,000 Grains<br />
Tuttle Grain & Supply Tuttle BNSF 7 230,000 Wheat, soybean, sorghum,<br />
corn, barley<br />
W. B. Johnston Grain<br />
Company<br />
Walters Co-op Elevator<br />
Association<br />
Enid<br />
Shattuck<br />
BNSF<br />
(shuttle)<br />
BNSF<br />
(shuttle)<br />
110 13,300,000 Sunflower, corn, sorghum<br />
110 2,000,000 Wheat, corn, sorghum,<br />
soybeans<br />
Walters WT&J 18 625,000 Grains<br />
10-8<br />
<strong>Oklahoma</strong> <strong>Statewide</strong> <strong>Freight</strong> <strong>and</strong> <strong>Passenger</strong> <strong>Rail</strong> <strong>Plan</strong>
Multimodal <strong>Freight</strong> Transportation in <strong>Oklahoma</strong><br />
Facility City <strong>Rail</strong>road<br />
Wheeler Brothers Grain<br />
Company<br />
WP Milling<br />
<strong>Rail</strong><br />
Car<br />
Spots<br />
Capacity<br />
(bushels)<br />
Commodities<br />
Enid BNSF 36 2,100,000 Wheat, sorghum<br />
Cordell GNBC 26 427,000 Wheat<br />
Thomas GNBC 26 1,229,000 Wheat<br />
Westhom GNBC 60 1,197,000 Wheat<br />
(West)<br />
Alva (East) BNSF 26 872,000 Wheat<br />
Alva (West) BNSF 26 1,324,000 Wheat<br />
Greenfield n/a 50 825,000 Wheat<br />
Watonga AT&L 100 1,955,000 Wheat<br />
Muskogee<br />
8 250,000 Grains<br />
(Feed Mill)<br />
Source: www.bnsf.com/customers/grain-facilities/elevators/menu/; http://dx01.my.uprr.com/pubdir%5Cgraindir.nsf/webstate?OpenView&Count=1000<br />
Table 10-2<br />
<strong>Oklahoma</strong> rail-served grain<br />
elevators (continued from<br />
previous page)<br />
Major Industrial Parks/Logistics Centers<br />
At one time, industrial parks were small facilities serving local needs, typically populated<br />
by a few industrial companies. While these are still prevalent, there has been increasing<br />
interest in larger multimodal facilities providing a range of logistics services (Figure 10-3).<br />
Ardmore Industrial Airpark<br />
Originally built as a military airfield, the Ardmore Industrial Airpark (AIA) is one of<br />
four logistics centers owned by the Ardmore Development Authority (ADA) <strong>and</strong> sits on<br />
490 acres of the ADA’s 3,400 acres (Figure 10-4). AIA is situated 16 miles northeast of<br />
Ardmore in Gene Autry <strong>and</strong> is centrally located between <strong>Oklahoma</strong> City (95 miles) <strong>and</strong><br />
Dallas (125 miles). I-35 is 7 miles away via the adjacent State Route 53. The industrial<br />
park has rail service provided by BNSF <strong>and</strong> accommodates general aviation service for<br />
both freight <strong>and</strong> persons at the attached regional airport. Current tenants include King<br />
Figure 10-3<br />
<strong>Rail</strong>-served multimodal freight<br />
facilities<br />
May 2012 10-9
Chapter 10<br />
Figure 10-4<br />
Ardmore Industrial Airpark<br />
Source: Google Earth <strong>and</strong> PB Analysis<br />
Aerospace, Higgins Interiors, Inc., Beetle Plastics, Dollar General Distribution Center,<br />
East Jordan Iron Works, Carbonyx, Inc., <strong>and</strong> Online Packaging.<br />
Currently, Sovereign Development Fund I, LLC, is working on a large-scale development<br />
adjacent to this facility. The $33 million proposal includes plans for transloading <strong>and</strong> the<br />
movement of unit trains for the energy <strong>and</strong> commercial business sectors.<br />
Distance of AIA from the highway network<br />
Interstate<br />
• Interstate 35—7 miles<br />
U.S. highways<br />
• U.S. Route 177—4.5 miles<br />
• U.S. Route 77—6 miles<br />
State highways<br />
• State Route 53—adjacent<br />
• State Route 199—12 miles<br />
10-10<br />
<strong>Oklahoma</strong> <strong>Statewide</strong> <strong>Freight</strong> <strong>and</strong> <strong>Passenger</strong> <strong>Rail</strong> <strong>Plan</strong>
Multimodal <strong>Freight</strong> Transportation in <strong>Oklahoma</strong><br />
<strong>Rail</strong><br />
Onsite spurs are served by BNSF; the nearest switching yard is in Ardmore (10 miles<br />
by rail) with direct access to the mainline, which runs to Kansas City, Fort Worth, <strong>and</strong><br />
Houston<br />
Water<br />
• Port of Muskogee—192 miles<br />
• Johnston’s Port 33—197 miles<br />
• Tulsa Port of Catoosa—215 miles<br />
• Port of Houston—350 miles<br />
Air<br />
On-site, general aviation airport<br />
Mid-America Industrial Park<br />
The Mid-America Industrial Park (MAIP), founded in 1960, is located 38 miles east of<br />
Tulsa, has a 9,000-acre footprint, <strong>and</strong> is home to more than 75 industrial <strong>and</strong> commercial<br />
tenants (Figure 10-5). MAIP is situated less than 25 miles from Interstate 44 <strong>and</strong> minutes<br />
from major U.S. <strong>and</strong> <strong>Oklahoma</strong> State Routes. MAIP is less than one hour from three river<br />
ports with year-round service—Tulsa Port of Catoosa, Johnston’s Port 33, <strong>and</strong> the Port of<br />
Muskogee. Additionally, the park owns <strong>and</strong> operates an on-site general aviation airport.<br />
UP serves MAIP, which has approximately 20 miles of track <strong>and</strong> rail sidings throughout<br />
the park <strong>and</strong> a switching yard just off-site.<br />
Tenants include Airgas, Bennett Steel, GRDA Coal-Fired Complex, Georgia Pacific Gypsum,<br />
NORIT Americas, <strong>and</strong> DB Schenker Logistics.<br />
Distance of MAIP from the highway network<br />
Interstate<br />
• Interstate 44—22 miles<br />
• Interstate 40—60 miles<br />
• Interstate 35—130 miles<br />
US highways<br />
• U.S. Route 69—2.5 miles<br />
• U.S. Route 412—8 miles<br />
State highways<br />
• State Route 69A—0 miles<br />
• State Route 412 B—0.5 miles<br />
• State Route 20—5 miles<br />
<strong>Rail</strong><br />
On-site with switching yard just off-site, served by UP<br />
May 2012 10-11
Chapter 10<br />
Figure 10-5<br />
Mid-America Industrial Park<br />
Source: Google Earth <strong>and</strong> PB Analysis<br />
Water<br />
Less than hour from<br />
• Johnston’s Port 33—18 miles<br />
• Tulsa Port of Catoosa—35 miles<br />
• Port of Muskogee—40 miles<br />
Air<br />
On-site, general aviation airport<br />
Clinton-Sherman Industrial Airpark (<strong>Oklahoma</strong> Spaceport)<br />
The Clinton-Sherman Industrial Airpark, also known as the <strong>Oklahoma</strong> Spaceport is<br />
an authorized spaceport near Burns Flat, <strong>Oklahoma</strong> (Figure 10-6). It was expected to<br />
serve as a flight center for space tourism with takeoff <strong>and</strong> l<strong>and</strong>ing of suborbital, reusable<br />
10-12<br />
<strong>Oklahoma</strong> <strong>Statewide</strong> <strong>Freight</strong> <strong>and</strong> <strong>Passenger</strong> <strong>Rail</strong> <strong>Plan</strong>
Multimodal <strong>Freight</strong> Transportation in <strong>Oklahoma</strong><br />
Figure 10-6<br />
Clinton-Sherman Industrial<br />
Airpark<br />
Source: Google Earth <strong>and</strong> PB Analysis<br />
spacecraft. Its market advantage, at the time, was its ability to use airspace without federal<br />
restrictions.<br />
Burns Flat is 100 miles West of <strong>Oklahoma</strong> City <strong>and</strong> is 7 miles from Interstate 40. It is also<br />
160 miles from Amarillo, Texas, <strong>and</strong> 270 miles from Dallas-Fort Worth. The facility covers<br />
2,700 acres <strong>and</strong> currently has four industrial/commercial buildings. Farmrail operates the<br />
on-site rail spur <strong>and</strong> connects with BNSF <strong>and</strong> UP to provide service to <strong>Oklahoma</strong> City,<br />
Tulsa, <strong>and</strong> Dallas. The State of <strong>Oklahoma</strong> has several incentives in place to attract industrial<br />
business to the spaceport facility. It must be noted that, at this time, track renovation<br />
will be necessary to put the spur connection back into usable operation. A proposal to<br />
renovate was presented to Farmrail by Halliburton Corporation (Halliburton adjoins the<br />
industrial park) though no formal talks are currently underway.<br />
Past users of the facility included Armadillo Aerospace <strong>and</strong> Rocketplane Kistler, both<br />
developers <strong>and</strong> manufacturers of reusable spacecraft. However, Rocketplane Kistler ceased<br />
operation in 2010.<br />
The facility features a runway that can accommodate aircraft as large as a fully laden B-52<br />
but now serves as a general aviation airport. State officials seek to lure UPS or FedEx<br />
service to the airport. Though there are currently no industrial tenants on-site, a large<br />
adjoining company is interested in exploring reactivation of the spur serving the park.<br />
May 2012 10-13
Chapter 10<br />
Distance of <strong>Oklahoma</strong> Spaceport from the highway network<br />
Interstate<br />
Interstate 40—7 miles<br />
State highways<br />
State Route 44—0 miles<br />
<strong>Rail</strong><br />
On-site spur, served by Farmrail<br />
Water<br />
• Tulsa Port of Catoosa—229 miles<br />
• Johnston’s Port 33—232 miles<br />
• Port of Muskogee—250 miles<br />
Air<br />
On-site, general aviation airport former Strategic Air Comm<strong>and</strong> base; runway 17R-35R is<br />
13,503 feet; stressed for heavy aircraft (B-52 at 488,000 pound maximum takeoff weight)<br />
Citizen Potawatomie Nation Industrial Park<br />
The Citizen Potawatomie Nation, the Arkansas <strong>Oklahoma</strong> <strong>Rail</strong>road (AOK), <strong>and</strong> UP have<br />
been working together to repair a major railroad bridge east of Shawnee that would allow<br />
AOK to provide rail service to the tribe’s new industrial park. The cost of the overall project<br />
is estimated to be in the $2 million range. As part of the project, AOK has indicated it<br />
would put in 5,000 new cross ties on the mainline between <strong>Oklahoma</strong> City <strong>and</strong> Shawnee.<br />
In 2009, an unsuccessful TIGER grant application was submitted to upgrade the mainline<br />
between <strong>Oklahoma</strong> City <strong>and</strong> Shawnee, which is subject to flood damage during extreme<br />
weather events.<br />
The tribe’s 400-acre industrial park near Shawnee has been in contact with three different<br />
rail-served businesses about locating to this facility if rail service can be provided. Funding<br />
for the project has yet to be identified, <strong>and</strong> the specific amounts to be provided by each<br />
of the three parties has yet to be determined.<br />
Port Facilities<br />
<strong>Oklahoma</strong> navigable river system<br />
MKARNS is <strong>Oklahoma</strong>’s primary navigable waterway originating at the Tulsa Port of<br />
Catoosa <strong>and</strong> flowing southeast connecting to the Mississippi River. MKARNS is 445 miles<br />
long <strong>and</strong> has 18 locks <strong>and</strong> 10 dams that enable year-round navigation. The locks <strong>and</strong> dams<br />
are maintained by the U.S. Army Corp of Engineers <strong>and</strong> are operated 24 hours a day,<br />
365 days a year. The U.S. Coast Guard is responsible for maintaining the channel markers<br />
<strong>and</strong> navigation aids. MKARNS is comprised of two rivers in <strong>Oklahoma</strong>—the Arkansas<br />
<strong>and</strong> Verdigris Rivers. The Verdigris River’s segment begins at Tulsa Port of Catoosa<br />
(navigational head of the MKARNS) <strong>and</strong> runs south approximately 50 miles to the Port<br />
10-14<br />
<strong>Oklahoma</strong> <strong>Statewide</strong> <strong>Freight</strong> <strong>and</strong> <strong>Passenger</strong> <strong>Rail</strong> <strong>Plan</strong>
Multimodal <strong>Freight</strong> Transportation in <strong>Oklahoma</strong><br />
Figure 10-7<br />
McClellan-Kerr Arkansas River<br />
Navigation System<br />
Source: Arkansas River Navigational Study Final Feasibility Report<br />
of Muskogee. The Arkansas River begins at the Port of Muskogee <strong>and</strong> flows into the State<br />
of Arkansas on its way to the Mississippi River. Figure 10-7 displays the entire MKARNS<br />
system <strong>and</strong> identifies each lock <strong>and</strong> dam.<br />
MKARNS has the following navigational characteristics:<br />
• Channel depth—9 feet<br />
• Channel width—ranges from 250 to 300 feet<br />
• Number of locks—18 total, with 5 in <strong>Oklahoma</strong><br />
--<br />
W.D. Mayo Lock 14—Spiro<br />
--<br />
Robert S. Kerr Lock 15—Sallisaw<br />
--<br />
Webbers Falls Lock 16—Gore<br />
--<br />
Chouteau Lock 17—Porter<br />
--<br />
Newt Graham Lock 18—Inola<br />
• Lock chamber dimensions (same for all)—110 feet wide by 600 feet long<br />
The MKARNS can accommodate a tow<br />
comprised of eight jumbo barges (one jumbo<br />
barge measures 35 feet wide by 195 feet<br />
long) plus the towboat. Oversized tows (tows<br />
exceeding 8 jumbo barges) have to be cut or<br />
split into units that are able to pass through<br />
the locks. There is an initiative underway<br />
to deepen the MKARNS channel from 9 feet to 12 feet from the Mississippi River to the<br />
Tulsa Port of Catoosa. The 3-foot difference would allow a barge to increase its loading<br />
May 2012 10-15
Chapter 10<br />
capacity by 33 percent (1,500 tons to 2,000 tons). 1 . The MKARNS channel is currently<br />
12 feet deep along the majority of the span, except for 75 miles that would require dredging.<br />
The estimated cost of this endeavor is $180 million <strong>and</strong> funding has not yet been<br />
secured.<br />
Public port facilities<br />
Tulsa Port of Catoosa<br />
Figure 10-8<br />
Tulsa Port of Catoosa<br />
Source: Tulsa Port of Catoosa website (www.tulsaport.com/aerial_large.html)<br />
The Tulsa Port of Catoosa (Figure 10-8) is an inl<strong>and</strong> river port located at the head of<br />
MKARNS in northeast <strong>Oklahoma</strong>. The port is situated on approximately 2,500 acres,<br />
with 2,000 developed acres accommodating an industrial park with 63 facilities, primarily<br />
in the heavy-haul industry, that include manufacturing, distribution, <strong>and</strong> processing of<br />
goods companies. Currently, 150 acres of the 2,000 is unused, including 40 acres set aside<br />
for potential future container operation. In addition, there is the new Riverview Business<br />
Park, a 150-acre development located on State Route 166, 1.5 miles east of the Port Industrial<br />
Park.<br />
In 2010, Tulsa Port of Catoosa h<strong>and</strong>led 2.26 million tons of cargo with 57 percent of that<br />
being either delivered to the port or shipped from the port by rail. Sixty percent of the<br />
companies located in the Port Industrial Park have a rail spur. In 2006, approximately<br />
13,000 railcars were switched within the Port.<br />
The Tulsa Port of Catoosa has five public terminal facilities; each is fully equipped <strong>and</strong><br />
staffed to efficiently transfer inbound <strong>and</strong> outbound cargos between barges, trucks, <strong>and</strong><br />
rail cars. The assets of these terminals, with the exception of the liquid bulk facilities, are<br />
owned by the Tulsa Port of Catoosa but are maintained <strong>and</strong> operated by independent contractors<br />
that have lease agreements with the Port Authority. The liquid bulk companies are<br />
1<br />
1,500 tons equals 60 truckloads or 15 railcars; 2,000 tons equals 80 truckloads or 20 railcars; an eight-barge tow would<br />
transport the equivalent of 640 truckloads instead of 480 truckloads.<br />
10-16<br />
<strong>Oklahoma</strong> <strong>Statewide</strong> <strong>Freight</strong> <strong>and</strong> <strong>Passenger</strong> <strong>Rail</strong> <strong>Plan</strong>
Multimodal <strong>Freight</strong> Transportation in <strong>Oklahoma</strong><br />
private <strong>and</strong> own their own facilities. 2 The five public terminal areas are listed below with a<br />
general description.<br />
• General dry cargo dock—A 40-year old public dock operated by Tuloma Stevedoring,<br />
Inc. The dock is 720 feet long with a 230-foot-wide apron <strong>and</strong> has a<br />
variety of cranes <strong>and</strong> forklifts, including a new 200-ton overhead traveling bridge<br />
crane, to h<strong>and</strong>le a variety of commodities, such as iron <strong>and</strong> steel, project cargo,<br />
<strong>and</strong> break bulk cargo (lumber, wood pulp, coils, etc.). Figure 10-9 <strong>and</strong> Figure<br />
10-10 are renderings of the channel <strong>and</strong> dock views of the general cargo dry<br />
dock.<br />
• Roll-on roll-off (Ro-Ro) low water wharf—A public wharf operated by Tulsa<br />
Port of Catoosa Port Authority that specializes in the transfer of over-weight,<br />
over-dimensional, or wheeled cargo. The wharf is 180 feet long with a 50-foot<br />
wide apron <strong>and</strong> has a 3.2-percent slope with a rail spur extending to the water’s<br />
edge for efficient transfer of cargo. Figure 10-11 is an aerial rendering of the<br />
Ro-Ro wharf.<br />
• Dry bulk terminal—A public terminal operated by Gavilon Fertilizer LLC.<br />
The terminal has two storage areas—an 80,000-ton covered storage area <strong>and</strong> a<br />
50,000-ton open storage area. The former has two pedestal cranes <strong>and</strong> an import<br />
conveyance system for the outbound distribution of a variety of bulk commodities.<br />
Inbound <strong>and</strong> outbound load systems rate up to 400 tons per hour.<br />
• Grain terminals—There are two grain terminals within the Tulsa Port of Catoosa,<br />
both operated by Gavilon Grains LLC. Facilities include outbound conveyance<br />
systems with a 25,000-bushel-per-hour capacity, inbound unloading systems with<br />
a 30,000-bushel-per-hour capacity, grain samplers, dust control systems, <strong>and</strong> an<br />
approximate 5.0-million-bushel storage capacity. Grain grading is available onsite.<br />
The major product h<strong>and</strong>led by these terminals is outbound hard red winter<br />
wheat, but inbound or outbound soybeans, oats, corn, milo, <strong>and</strong> millet can also be<br />
h<strong>and</strong>led. Grain barges can be loaded in as little as 2.5 hours. These facilities will<br />
remain open 24 hours per day in peak season, if necessary.<br />
• Liquid bulk terminals—There are seven liquid bulk terminals at Tulsa Port of<br />
Catoosa, which are all privately owned. They h<strong>and</strong>le various types of liquid bulk<br />
commodities, including chemicals, asphalt, refined petroleum products, <strong>and</strong><br />
molasses. The following terminals are located at the Tulsa Port of Catoosa:<br />
--<br />
Brenntag<br />
--<br />
BKEP Energy Partners, LLC<br />
--<br />
Nustar Energy LP<br />
--<br />
Safety-Kleen<br />
--<br />
Petro Source Terminals<br />
--<br />
Terra Nitrogen<br />
--<br />
Westway<br />
More than 2,500 people are directly employed by the 50 tenant companies at the Tulsa<br />
Port of Catoosa. These firms manufacture, distribute, <strong>and</strong> process a variety of products<br />
that range from agricultural commodities to manufactured consumer goods. The Tulsa<br />
Port of Catoosa averages more than 450 daily truck calls from nationwide trucking<br />
2<br />
www.tulsaport.com/docks_<strong>and</strong>_terminals.html<br />
May 2012 10-17
Chapter 10<br />
Figure 10-9<br />
General dry cargo dock—<br />
channel view<br />
Source: Tulsa Port of Catoosa website (www.tulsaport.com/aerial_large.html)<br />
Figure 10-10<br />
General dry cargo dock—dock<br />
view<br />
Source: Tulsa Port of Catoosa<br />
10-18<br />
<strong>Oklahoma</strong> <strong>Statewide</strong> <strong>Freight</strong> <strong>and</strong> <strong>Passenger</strong> <strong>Rail</strong> <strong>Plan</strong>
Multimodal <strong>Freight</strong> Transportation in <strong>Oklahoma</strong><br />
Figure 10-11<br />
Ro-Ro low water wharf<br />
Source: Tulsa Port of Catoosa<br />
carriers, <strong>and</strong> the Port’s geographic location near the center of the U.S. puts truck shipments<br />
only two days from either the East Coast or the West Coast. Additionally, Tulsa<br />
International Airport is approximately 7 miles west of the Port.<br />
The Tulsa Port of Catoosa provides a number of tax- <strong>and</strong> duty-free incentives through its<br />
grant of the Foreign Trade Zone (FTZ) designation. FTZ 53 covers 61 acres of the port<br />
<strong>and</strong> has direct access to State Highway 266 (an official National Highway System Intermodal<br />
Connector) providing a connection to Interstate 44 <strong>and</strong> U.S. Route 412 five miles away.<br />
The Tulsa Port of Catoosa has direct rail service provided by BNSF <strong>and</strong> the South Kansas<br />
& <strong>Oklahoma</strong> (SKOL) railroads. SKOL also provides a connection with UP so the Port, in<br />
effect, is served by two major railroads that are direct competitors. The port also provides<br />
switching services to facilities located on Port property.<br />
Port of Muskogee<br />
The Port of Muskogee is an inl<strong>and</strong> river port located on the Arkansas River at River Mile<br />
393 of the MKARNS. The Port is situated on approximately 450 acres. The Muskogee City-<br />
County Port Authority also owns industrial l<strong>and</strong>s at the Port of Muskogee/John T. Griffin<br />
Industrial Park, the Port of Muskogee Riverside Industrial Park, <strong>and</strong> Southside Industrial<br />
Park, altogether comprising approximately 850 acres. The industrial parks, all served by<br />
rail, are in close proximity to the Port of Muskogee <strong>and</strong> reserved for transportation-sensitive<br />
industries whose bulk <strong>and</strong> break bulk commodities can be transported by barge.<br />
May 2012 10-19
Chapter 10<br />
The Port’s existing maritime infrastructure consists of<br />
• 20 mooring dolphins along the river channel frontage<br />
• Fleeting area for 75 barges<br />
• Harbor tow boat service<br />
• Barge terminal <strong>and</strong> dock facilities<br />
• Overhead <strong>and</strong> mobile cranes for transloading between barge, rail, <strong>and</strong> truck<br />
• 94,000-square-foot dockside warehouse<br />
• 39 acres of hardst<strong>and</strong> for outside storage<br />
The port’s waterfront terminals include<br />
• Johnstons ports <strong>and</strong> terminals<br />
• Quality Liquid Feeds<br />
• BKEP Energy Partners<br />
The Port of Muskogee <strong>Rail</strong>road operates two locomotives over 9 miles of railroad track,<br />
including a marshaling yard for interchange with UP. The Port <strong>Rail</strong>road provides its<br />
industries daily switching <strong>and</strong> car storage. In addition to the trackage over which the Port<br />
<strong>Rail</strong>road conducts its operations, the Muskogee City-County Port Authority acquired<br />
39 miles of railroad right-of-way from the UP-predecessor Missouri Pacific <strong>Rail</strong>road. The<br />
right of way, from Muskogee to Stigler has been rail-banked for future expansion.<br />
Industrial <strong>and</strong> economic development schemes could be exp<strong>and</strong>ed or introduced to entice<br />
new business growth within the Port district. Recently, the Muskogee City Council gave<br />
the Port of Muskogee economic <strong>and</strong> industrial development responsibility to develop <strong>and</strong><br />
implement economic incentive programs. The Port also acquired the assets of the Greater<br />
Muskogee Development Corporation, thereby transferring to it all maintenance <strong>and</strong> management<br />
responsibilities of 83 acres at the Southside Industrial Park West. The Port now<br />
has a greater role in attracting new business growth.<br />
In 2011, the total rail tonnage transported through the Port of Muskogee was 315,204 tons<br />
(pipe, steel coils <strong>and</strong> plate, asphalt, petroleum coke, fertilizer, glass cullet, <strong>and</strong> a variety of<br />
other products). Most of the rail cargo was transloaded to <strong>and</strong> from barges. Barge tonnage<br />
transported through the Port of Muskogee in 2011 was 835,836 tons.<br />
Private river terminals on MKARNS<br />
The <strong>Oklahoma</strong> shore of the MKARNS is an active <strong>and</strong> thriving maritime industry of more<br />
than 30 businesses that use the river system to move bulk commodities. While many of<br />
the firms are private, their l<strong>and</strong> or facilities may be owned either out right or leased from<br />
a port authority. Table 10-3 lists the companies <strong>and</strong> port authorities that operate from the<br />
<strong>Oklahoma</strong> banks of the MKARNS.<br />
Marine Trends<br />
Two initiatives are occurring that may have an impact on inl<strong>and</strong> water commerce—the<br />
expansion of the Panama Canal <strong>and</strong> the Marine Highway program.<br />
10-20<br />
<strong>Oklahoma</strong> <strong>Statewide</strong> <strong>Freight</strong> <strong>and</strong> <strong>Passenger</strong> <strong>Rail</strong> <strong>Plan</strong>
Multimodal <strong>Freight</strong> Transportation in <strong>Oklahoma</strong><br />
River Milepost Company Name City Location<br />
337.3 L Jeffrey S<strong>and</strong> Company Dock Sallisaw<br />
342.0 R Port Carl Albert Keota<br />
342.0 R Port of Keota Keota<br />
344.1 L Cherokee Nation Port Sallisaw<br />
362.4 L Jeffrey S<strong>and</strong> Company Dock Webber Falls<br />
363.2 R Consolidated Grain <strong>and</strong> Barge Webber Falls<br />
390.2 R Fort James Corporation Muskogee<br />
391.0 R Frontier Terminal Muskogee<br />
393.0 R Koch Materials Company Port of Muskogee<br />
393.8 R Consolidated Grain <strong>and</strong> Barge Port of Muskogee<br />
393.8 R Johnston Terminal-Muskogee Port of Muskogee<br />
393.8 R Muskogee City-County Port Authority Port of Muskogee<br />
393.8 R Uni-Steel, Inc. Port of Muskogee<br />
412.5 L Consolidated Grain <strong>and</strong> Barge Wagoner<br />
426.5 L Inola Station Slip-Public Service Co. Inola<br />
431.8 R Johnston’s Port 33, Inc. Inola<br />
431.8 R Total Petroleum Inola<br />
431.8 R Port Barge Cleaning Inola<br />
443.8 R Mid-America Port Catoosa<br />
445.2 Advance Chemical Distribution, Inc. Tulsa Port of Catoosa<br />
445.2 Catoosa Fertilizer Terminal Tulsa Port of Catoosa<br />
445.2 Safety Kleen Systems, Inc. Tulsa Port of Catoosa<br />
445.2 Peavy Company Tulsa Port of Catoosa<br />
445.2 Port Barge Cleaning Tulsa Port of Catoosa<br />
445.2 Frontier Terminal <strong>and</strong> Trading Co. Tulsa Port of Catoosa<br />
445.2 Southern Missouri Oil Co. Tulsa Port of Catoosa<br />
445.2 Tuloma Stevedoring, Inc. Tulsa Port of Catoosa<br />
445.2 City of Tulsa-Rogers County Port Authority Tulsa Port of Catoosa<br />
445.2 Terra Nitrogen Tulsa Port of Catoosa<br />
445.2 Westway Terminal Co., Inc. Tulsa Port of Catoosa<br />
445.2 Royal Training Co. Tulsa Port of Catoosa<br />
Source: U.S. Army Corps of Engineers, www.swl.usace.army.mil/navigation/portlistings.html<br />
Table 10-3<br />
Private terminals on the<br />
MKARNS in <strong>Oklahoma</strong><br />
Panama Canal expansion<br />
For many years, the world’s largest ships transporting containers have not been able to<br />
transit the Panama Canal because of the limiting size of its locks. Larger ships from Asia<br />
have had to unload containers destined for markets in the central or eastern U.S. at a<br />
Pacific Coast port where they are transferred to an intermodal train or hauled by truck.<br />
New wider locks, <strong>and</strong> the widening <strong>and</strong> deepening of the access channels, will both permit<br />
the larger vessels to pass through the Canal <strong>and</strong> provide a faster crossing.<br />
For container ships, the current maximum size that can transit through the Canal<br />
will increase from those designed to carry about 5,100 20-foot equivalent unit (TEU)<br />
May 2012 10-21
Chapter 10<br />
containers (current Panamax size) to 12,600 TEUs or more. The resulting scale of economies<br />
is expected to reduce the average waterborne <strong>and</strong> operating costs for transporting<br />
containers from Northeast Asia to the U.S. Gulf Coast. For dry bulk shippers, the ability<br />
to send Capesize ships (up to 180,000 dead weight tons) through the Canal may provide<br />
cost-effective options for U.S. exports of bulk commodities, such as grain <strong>and</strong> coal. The<br />
Canal improvements are expected to be completed in 2014.<br />
Marine highway program<br />
The U.S. Maritime Administration’s Marine Highway Program was designed to identify<br />
waterway corridors where water transportation presents an opportunity to offer<br />
relief to l<strong>and</strong>side corridors that suffer from congestion, excessive air emissions or other<br />
environmental concerns, <strong>and</strong> other challenges. The MKARNS is designated as M-40, a<br />
Marine Highway Connector that connects to M-55 (Mississippi River), a major arterial<br />
barge-shipping corridor. This designation aims to increase the public <strong>and</strong> private sector’s<br />
awareness of the use of this mode of transportation <strong>and</strong> makes the MKARNS or M-40<br />
eligible for grant funding.<br />
The Tulsa Port of Catoosa, located on the MKARNS, is one of the westernmost inl<strong>and</strong><br />
ports with access to the Mississippi River. MKARNS could provide significant opportunities<br />
for importers <strong>and</strong> exporters who use or who could potentially divert their cargos to<br />
a water route with rail connections. However, using MKARNS will require further study<br />
<strong>and</strong> evaluation to determine whether such an arrangement would be competitive with<br />
existing routes.<br />
<strong>Rail</strong> Expansion Opportunities for the Ports<br />
The ports identified a number of opportunities for better integration with the railroads<br />
that would benefit freight shippers.<br />
Tulsa Port of Catoosa<br />
The Tulsa Port of Catoosa is interested in leveraging both the expansion of the Panama<br />
Canal <strong>and</strong> the Marine Highway initiative along with its rail connections. It supports the<br />
development of a major transload terminal in Tulsa with potential for a container terminal<br />
in the future. As the most western port on the waterway, it would be a terminus for the<br />
Marine Highway <strong>and</strong> provide intermodal connections to various markets in the region.<br />
Port of Muskogee<br />
The Port of Muskogee has identified several initiatives to enhance <strong>and</strong> improve its rail<br />
service <strong>and</strong> rail storage capabilities as well as diminish operational impacts to the City of<br />
Muskogee.<br />
• <strong>Rail</strong> access to the Port of Muskogee is limited to northbound access from UP’s<br />
yard in Muskogee. Replacing the existing access with a new wye off UP’s main line<br />
would provide more efficient access for manifest <strong>and</strong> unit train traffic, northbound<br />
<strong>and</strong> southbound.<br />
10-22<br />
<strong>Oklahoma</strong> <strong>Statewide</strong> <strong>Freight</strong> <strong>and</strong> <strong>Passenger</strong> <strong>Rail</strong> <strong>Plan</strong>
Multimodal <strong>Freight</strong> Transportation in <strong>Oklahoma</strong><br />
• Adding an additional track under the <strong>Oklahoma</strong> Turnpike Authority’s bridge<br />
would provide the capability of multiple train movements (manifest <strong>and</strong> unit<br />
train) simultaneously. The design for modifications to the bridge is currently<br />
underway.<br />
• The Port of Muskogee is currently served by UP only. By extending the Port’s<br />
track approximately 3/4 mile south to BNSF’s track, UP <strong>and</strong> BNSF could serve<br />
their customers in Muskogee via the new wye, eliminating the need for 29<br />
at-grade crossings, which now constrain vehicular traffic through the City of<br />
Muskogee.<br />
Foreign Trade Zones<br />
An FTZ is an area within or approximate to a U.S. port of entry <strong>and</strong> serves as a location<br />
where foreign goods are considered to be outside U.S. Customs <strong>and</strong> Border Protection<br />
jurisdiction. They are duty-free areas, offering warehousing, storage, <strong>and</strong> distribution<br />
facilities for trade, trans-shipment, <strong>and</strong> re-export operations. Goods held in the FTZ<br />
are not assessed a customs duty until they are brought out of the FTZ <strong>and</strong> enter the U.S.<br />
market.<br />
However, certain U.S. firms receive an additional advantage when located within an FTZ.<br />
U.S. firms that use imported components for their exported goods do not pay duties on<br />
those imported items if their production process occurs within an FTZ. The tariff <strong>and</strong> tax<br />
relief benefits U.S.-based operations engaged in international trade by exempting their<br />
goods from duties.<br />
There are two types of zones:<br />
• General-purpose—Commonly found in or near a port of entry <strong>and</strong> may be a section<br />
within a port or an entire industrial park<br />
• Sub-zone—Typically, a single firm’s site that has a more extensive operation than<br />
what could be contained within a general-purpose facility<br />
<strong>Oklahoma</strong> has been granted several FTZs by the U.S. Department of Commerce.<br />
Port of Muskogee Zone (FTZ 164)<br />
FTZ 164 consists of two sites in the Port of Muskogee with waterfront <strong>and</strong> rail access, one<br />
site in the Port of Muskogee/John T. Griffin Industrial Park with rail access, <strong>and</strong> two sites<br />
in McAlester <strong>Oklahoma</strong> operated by Komar Distribution Services. Under the new administrative<br />
procedures adopted by the FTZ Board, FTZ status can be provided to other sites<br />
within the Port of Muskogee or its industrial parks.<br />
Tulsa Port of Catoosa Zone (FTZ 53)<br />
The Tulsa Port of Catoosa enjoys FTZ status <strong>and</strong> is home to four industrial parks—Stillwater<br />
Industrial Park, Bartlesville Industrial Park, Mid-America Industrial Park at Pryor<br />
Creek, <strong>and</strong> Tulsa International Airport. The Port covers more than 2,000 acres <strong>and</strong> is a<br />
well-equipped, multimodal facility that provides its tenants with direct transportation<br />
May 2012 10-23
Chapter 10<br />
access via river, road, <strong>and</strong> rail. FTZ 53 currently has over 60 tenants utilizing its 500 acres<br />
of waterfront property <strong>and</strong> 1,500 acres of l<strong>and</strong>locked, general-industrial property.<br />
International Business Park in Durant (FTZ 227)<br />
FTZ 227 is situated on 320 acres in Durant <strong>and</strong> encompasses several industrial parks.<br />
Adjacent to or near major highways <strong>and</strong> Interstate 35, it is centrally located among several<br />
key transportation locations—one hour from Dallas-Fort Worth, five hours from Houston<br />
<strong>and</strong> San Antonio, <strong>and</strong> eight hours from Laredo, Texas, one of the busiest border crossings<br />
with Mexico. FTZ 227 was recently exp<strong>and</strong>ed to include the Ardmore Industrial Park <strong>and</strong><br />
the Westport Industrial Park, both located in Ardmore. Throughout the industrial parks,<br />
truck dock facilities are available. Additionally, both UP <strong>and</strong> Kiamichi <strong>Rail</strong>road maintain<br />
daily rail service to a rail yard about 1/2 mile from FTZ 227, <strong>and</strong> a nearby general aviation<br />
airport offers small airfreight access to the zone.<br />
10-24<br />
<strong>Oklahoma</strong> <strong>Statewide</strong> <strong>Freight</strong> <strong>and</strong> <strong>Passenger</strong> <strong>Rail</strong> <strong>Plan</strong>
11. <strong>Oklahoma</strong> <strong>Passenger</strong> <strong>Rail</strong><br />
OKLAHOMA<br />
STATEWIDE FREIGHT &<br />
PASSENGER RAIL PLAN<br />
In the course of developing the <strong>Oklahoma</strong> <strong>Statewide</strong> <strong>Freight</strong> <strong>and</strong> <strong>Passenger</strong> <strong>Rail</strong> <strong>Plan</strong>, many<br />
citizens shared a strong desire for <strong>Oklahoma</strong> to exp<strong>and</strong> its passenger rail system. During<br />
2012, the state will be commencing its effort to obtain the necessary environmental<br />
clearance <strong>and</strong> FRA authority to develop a passenger line from Tulsa to <strong>Oklahoma</strong> City.<br />
Simultaneously, the State of Texas will be leading an effort to obtain similar clearances <strong>and</strong><br />
authorities for passenger operations to <strong>Oklahoma</strong> City from the south.<br />
History<br />
The efficient movement of people <strong>and</strong><br />
goods is fundamental to the functioning<br />
of a modern economy. While all modern<br />
modes—highway, air, water, <strong>and</strong> rail—have<br />
adapted well for the commercial movement<br />
of goods, transportation policy in the U.S.<br />
since the mid-20th Century has favored the<br />
development of commercial air <strong>and</strong> noncommercial<br />
highway as the principle carriers<br />
of persons. As a result, the previously established<br />
system of rail passenger transport<br />
declined.<br />
Historically, railroads were late to develop in <strong>Oklahoma</strong>. However, in the earlier days of<br />
<strong>Oklahoma</strong> railroads, passenger service was extensive. Table 11-1 <strong>and</strong> Figure 11‐1 show<br />
<strong>Oklahoma</strong> passenger service taken from the 1966 edition of the Official Guide of the<br />
<strong>Rail</strong>ways. 1<br />
By 1970, commercially operated passenger trains had long since lost their profitability.<br />
Under regulation of the Interstate Commerce Commission (ICC), the railroad companies,<br />
which at the time provided both passenger <strong>and</strong> freight services, were largely prevented<br />
from terminating passenger service. Faced with potential financial disaster in the rail<br />
industry, caused in part by losses in passenger service, Congress acted <strong>and</strong> formed the<br />
National <strong>Rail</strong>road <strong>Passenger</strong> Corporation (Amtrak) under the <strong>Rail</strong> <strong>Passenger</strong> Service Act of<br />
1970 (RPSA). The act was signed into law by President Richard Nixon <strong>and</strong> Amtrak came<br />
into existence on May 1, 1971.<br />
Under this act, the commercial railroads were relieved of passenger business obligations.<br />
Participating railroads received common stock in Amtrak <strong>and</strong>, in some cases, tax credits.<br />
1<br />
The Official Guide of the <strong>Rail</strong>ways, National <strong>Rail</strong>way Publication Co., New York, NY, July 1966.<br />
May 2012 11-1
Chapter 11<br />
Table 11-1<br />
<strong>Oklahoma</strong> passenger trains<br />
(1966)<br />
Train Name/Number Origin-Destination Route <strong>Rail</strong>road<br />
The <strong>Oklahoma</strong>n St. Louis–<strong>Oklahoma</strong> City via Tulsa St. Louis-San Francisco<br />
<strong>Rail</strong>way Co. (Frisco)<br />
Golden State Rocket Chicago–Los Angeles via Guymon Chicago, Rock Isl<strong>and</strong> <strong>and</strong><br />
Pacific <strong>Rail</strong>road Co. (CRIP)<br />
#39 (westbound) <strong>and</strong> #40<br />
(eastbound) Locals<br />
Kansas City–Los Angeles via Guymon CRIP<br />
#21 (westbound) <strong>and</strong> #22<br />
(eastbound) Locals<br />
Memphis–Los Angeles<br />
via McAlester–<br />
Shawnee–Ok City1–El<br />
Reno–Clinton–Sayre<br />
Twin Star Rocket Minneapolis–Fort Worth via Enid-El Reno CRIP<br />
#19-211 <strong>and</strong> #1-47<br />
(westbound) <strong>and</strong> #212-12 <strong>and</strong><br />
#48-20 (eastbound)<br />
CRIP<br />
Chicago–Tulsa via Bartlesville Atchison, Topeka <strong>and</strong><br />
Santa Fe <strong>Rail</strong>way Co.<br />
(Santa Fe)<br />
Texas Chief Chicago–Galveston via Guthrie-Ok City-<br />
Purcell<br />
The Kansas Cityan & The<br />
Chicagoan<br />
Chicago–Fort Worth<br />
via Guthrie-Ok City-<br />
Purcell<br />
Santa Fe<br />
Santa Fe<br />
The Tulsan; #1 <strong>and</strong> #20 Locals Kansas City–Tulsa via Bartlesville Santa Fe<br />
#37 <strong>and</strong> #38 Mixed Locals Las Animas CO–Amarillo via Boise City<br />
Santa Fe<br />
TX<br />
#173 <strong>and</strong> # 174 Mixed Locals Dodge City KS–Boise<br />
City OK<br />
connection at Dodge City<br />
with Super Chief<br />
Santa Fe<br />
#61 (eastbound) <strong>and</strong> #62<br />
(westbound)<br />
Pampa TX–Clinton OK<br />
connection at Pampa<br />
with San Francisco Chief<br />
Santa Fe<br />
Figure 11-1<br />
<strong>Passenger</strong> rail routes (1966)<br />
11-2<br />
<strong>Oklahoma</strong> <strong>Statewide</strong> <strong>Freight</strong> <strong>and</strong> <strong>Passenger</strong> <strong>Rail</strong> <strong>Plan</strong>
<strong>Oklahoma</strong> <strong>Passenger</strong> <strong>Rail</strong><br />
The railroads gave up their passenger equipment (in some cases cash) <strong>and</strong> the right of<br />
track access. For passenger train operations, Amtrak paid the railroads the incremental<br />
cost for the use of their tracks.<br />
When Amtrak was formed, participation by the commercial railroads was optional. If a<br />
railroad chose not to join, it was obligated to operate its established passenger routes until<br />
1975, after which the normal service withdrawal procedures could be initiated with the<br />
ICC.<br />
Only three railroads chose not to participate in Amtrak. One of these was the CRIP that<br />
operated in <strong>Oklahoma</strong>. Its non-participation did not affect its passenger operations in<br />
<strong>Oklahoma</strong> because it had already been terminated. CRIP was in receivership <strong>and</strong> totally<br />
ceased operations in 1979.<br />
The Santa Fe did participate in the initiation of Amtrak. The Texas Chief, a prominent<br />
Santa Fe Chicago-to-Texas train, was initially operated but was soon renamed the Lone<br />
Star. 2 After some re-routing in Texas, the Lone Star did not perform up to expectations<br />
<strong>and</strong>, along with several other cancellations in 1979, the train was removed from service.<br />
The result was that <strong>Oklahoma</strong> lost all passenger rail service.<br />
Overview of Current <strong>Rail</strong> <strong>Passenger</strong> Operations<br />
Today, one passenger operation is active in <strong>Oklahoma</strong>. The Heartl<strong>and</strong> Flyer is a statesponsored<br />
Amtrak-operated train operating between <strong>Oklahoma</strong> City <strong>and</strong> Fort Worth,<br />
Texas. Texas <strong>and</strong> <strong>Oklahoma</strong> share support of this service. The train departs <strong>Oklahoma</strong><br />
City at 8:25 a.m., arriving at Fort Worth mid-day. The train returns to <strong>Oklahoma</strong> City in<br />
the evening. The Heartl<strong>and</strong> Flyer operates daily.<br />
Under Section 403(b) 3 of the RPSA, states <strong>and</strong> other governmental agencies are permitted<br />
to partner with Amtrak to operate passenger trains of local interest. Under these provisions,<br />
Amtrak operates the service but is reimbursed a reasonable share of the service’s<br />
loss by the sponsor. Reasonable share was defined as two-thirds of the operating deficit<br />
in the original act. In Amtrak reform legislation of 1997, the two-thirds provision was<br />
revised to a negotiated amount. Current Amtrak policy is to charge 100 percent of deficits<br />
to the sponsor. PRIIA further refined the local sponsorship provisions by requiring<br />
Amtrak to establish a “st<strong>and</strong>ardized methodology for establishing <strong>and</strong> allocating the operating<br />
<strong>and</strong> capital costs” for the locally sponsored services.<br />
<strong>Oklahoma</strong> established the Heartl<strong>and</strong> Flyer, operating between <strong>Oklahoma</strong> City <strong>and</strong> Fort<br />
Worth, under the provisions of the RPSA <strong>and</strong> its subsequent revisions. Operation commenced<br />
on June 14, 1999. The State of Texas became a co-sponsor of the train in 2006.<br />
The Heartl<strong>and</strong> Flyer does provide for a reasonable connection to both eastbound <strong>and</strong><br />
westbound sections of the current Texas Eagle at Fort Worth. The Chicago to San Antonio<br />
Texas Eagle operates along a route different from the discontinued Lone Star. From<br />
2<br />
The Santa Fe owned the ‘Chief ’ br<strong>and</strong> <strong>and</strong> withdrew its permission for Amtrak to use the br<strong>and</strong> in 1975.<br />
3<br />
Section 403(b) states: “Any State, regional or local agency may request of the Corporation (i.e., Amtrak) rail passenger service<br />
beyond that included in the basic system. The Corporation shall institute such service if the State, regional or local agency agrees<br />
to reimburse the Corporation for a reasonable portion of any losses associated with such services.”<br />
May 2012 11-3
Chapter 11<br />
Chicago, the trains are routed through St. Louis <strong>and</strong> Little Rock, to Dallas <strong>and</strong> Fort Worth,<br />
terminating in San Antonio four days per week. The other three days per week, the Texas<br />
Eagle continues to Los Angeles following a several hour layover in San Antonio.<br />
The Heartl<strong>and</strong> Flyer<br />
The Heartl<strong>and</strong> Flyer is a favorite among passengers. The route between Santa Fe Depot<br />
in <strong>Oklahoma</strong> City <strong>and</strong> the Fort Worth Intermodal Transit Center is 206 miles in length.<br />
Intermediate stops on the route are Norman, Purcell, Pauls Valley, <strong>and</strong> Ardmore in <strong>Oklahoma</strong>,<br />
<strong>and</strong> Gainesville in Texas. The southbound Heartl<strong>and</strong> Flyer is designated as Amtrak<br />
train #821 with the northbound being #822.<br />
Table 11-2 shows the public timetable, which has had only minor changes since inception<br />
of the service.<br />
Table 11-2<br />
Heartl<strong>and</strong> Flyer timetable<br />
(effective November 7, 2011)<br />
821 Train Number 822<br />
Daily Days of Operation Daily<br />
Read Down Miles Stations Read Up<br />
8:25 AM 0 Dp <strong>Oklahoma</strong> City, OK Ar 9:39 PM<br />
8:49 AM 20 Dp Norman, OK Dp 9:04 PM<br />
9:06 AM 35 Dp Purcell, OK Dp 8:47 PM<br />
9:31 AM 57 Dp Pauls Valley, OK Dp 8:21 PM<br />
10:23 AM 102 Dp Ardmore, OK Dp 7:28 PM<br />
11:05 AM 141 Dp Gainesville, Texas Dp 6:47 PM<br />
12:39 PM 206 Ar Fort Worth, Texas Dp 5:25 PM<br />
Dp = depart, Ar = arrive<br />
Amtrak timetables are usually constructed to include actual running time <strong>and</strong> time at the<br />
stations (dwell time), with added time as a contingency for unexpected delays that may<br />
occur en route. Different from normal Amtrak timetable practice where this recovery time<br />
is added in the last segment of a run, the Heartl<strong>and</strong> Flyer schedule distributes the recovery<br />
time between each station pair. When running on-time, the Heartl<strong>and</strong> Flyer will tend to<br />
arrive at each station a little early but will adhere to the published departure time.<br />
The Heartl<strong>and</strong> Flyer schedule favors day trips taking <strong>Oklahoma</strong>ns to Texas. Except for<br />
a short trip confined to afternoon business or personal pursuits in Fort Worth, a trip<br />
to Texas would require one night stay at a minimum but would afford a full day in the<br />
Dallas-Fort Worth area. A trip to <strong>Oklahoma</strong> on the train would require two nights stay to<br />
allow any time in the state for daytime business or personal activities.<br />
Because of the BNSF network configuration, the Heartl<strong>and</strong> Flyer route includes Fort<br />
Worth instead of Dallas, although Dallas is much larger than Fort Worth. Tarrant County<br />
(which contains Fort Worth) has a 2010 population of 1.8 million, less than one-third<br />
the total Dallas-Fort Worth-Arlington metro area population of 6.5 million. Although<br />
historically the Santa Fe main line always passed through Fort Worth, during the 1950s<br />
11-4<br />
<strong>Oklahoma</strong> <strong>Statewide</strong> <strong>Freight</strong> <strong>and</strong> <strong>Passenger</strong> <strong>Rail</strong> <strong>Plan</strong>
<strong>Oklahoma</strong> <strong>Passenger</strong> <strong>Rail</strong><br />
<strong>and</strong> 1960s the Santa Fe would split the Texas Chief at Gainesville, Texas, with some cars<br />
proceeding direct to Dallas. This branch line to Dallas has since been removed.<br />
Existing stations <strong>and</strong> station services<br />
<strong>Oklahoma</strong> City, <strong>Oklahoma</strong><br />
The Santa Fe Depot is located on the eastern edge of downtown <strong>Oklahoma</strong> City, within<br />
easy walking distance of the Bricktown entertainment district <strong>and</strong> the basketball/hockey<br />
arena. The station is open from 7:30 to 8:45 a.m. <strong>and</strong> again from 9:00 to 11:00 p.m. There<br />
is no ticket counter, but in 2011 an automated ticketing machine was installed <strong>and</strong> is<br />
available when the station is open. Tickets may be purchased in advance over the internet<br />
or over the telephone at 1-800-USA-RAIL, at the automated ticket kiosk, or on the train.<br />
The Heartl<strong>and</strong> Flyer is a reservation-only train <strong>and</strong> space must be reserved in advance.<br />
Onboard tickets will usually cost more than those purchased in advance. No checked baggage<br />
is h<strong>and</strong>led at <strong>Oklahoma</strong> City.<br />
The Santa Fe Depot is privately-owned by a third party. Access to the station is through<br />
a lease agreement between the owner <strong>and</strong> the State of <strong>Oklahoma</strong>. There is retail space<br />
available adjoining the station. A new retail establishment commenced operations at the<br />
station in 2011.<br />
Location<br />
Parking<br />
Santa Fe Depot is located at 100 S. E.K. Gaylord Boulevard.<br />
There are 47 parking spaces at the station available at a fee of $6 per day. Nearby overflow<br />
parking is available for $3 per day.<br />
Major highways North South I-35, U.S. 77<br />
East West I-40, U.S. 62<br />
Northeast-Southwest I-44<br />
Intercity rail The Heartl<strong>and</strong> Flyer operates one round trip daily between <strong>Oklahoma</strong> City <strong>and</strong> Fort Worth. The<br />
train departs in the morning, returning in the evening.<br />
Intercity bus Greyhound <strong>and</strong> Jefferson Lines offer intercity buses along north-south routes along I-35 <strong>and</strong><br />
east-west along I-40. A diagonal route from Wichita Falls Texas to Tulsa <strong>and</strong> beyond operates<br />
along I-44. The intercity bus station is located approximately 2000 feet west of the depot.<br />
Aviation<br />
Will Rogers World Airport is served by five major airlines with direct service to 20 destinations,<br />
many of which are hub airports with connection throughout the world. The airport is located<br />
approximately 6 miles southwest of the Central Business District<br />
Central <strong>Oklahoma</strong> Transit <strong>and</strong> Parking Authority operates bus <strong>and</strong> paratransit services in<br />
<strong>Oklahoma</strong> City. Direct connections at the <strong>Oklahoma</strong> Santa Fe Depot are scarce. METRO local bus<br />
routes #1 <strong>and</strong> #24 pass near the station <strong>and</strong> both serve the <strong>Oklahoma</strong> City Transit Center, which<br />
Public transit<br />
will afford transfers to most parts of the city. Routes operate Monday through Friday with some<br />
routes offering Saturday service. Most routes commence abound 6 a.m. <strong>and</strong> terminal service by<br />
7:30 p.m.<br />
Rental car Yes, with station pickup available during normal business hours.<br />
Taxi Yes, numerous taxi providers 24/7.<br />
May 2012 11-5
Chapter 11<br />
Norman, <strong>Oklahoma</strong><br />
The Norman station has an enclosed waiting area but no other amenities or services. No<br />
checked baggage is h<strong>and</strong>led. The station is owned by the City of Norman <strong>and</strong> has shared<br />
space with the Community Art Center.<br />
Location<br />
Parking<br />
200 S. Jones Street<br />
Free parking is available across the tracks from the station. There are also provisions for bicycle<br />
parking.<br />
Major highways North-South I-35, U.S. 77<br />
East-West O-9<br />
Intercity rail Yes, the Heartl<strong>and</strong> Flyer operates one round trip daily between <strong>Oklahoma</strong> City <strong>and</strong> Fort Worth.<br />
The train departs southbound in the morning, returning in the evening.<br />
Intercity bus Greyhound operates at Norman with a station at 506 N. Porter. The bus route operates along<br />
the I-35 corridor with transfers available to other destinations at <strong>Oklahoma</strong> City.<br />
Aviation<br />
University of <strong>Oklahoma</strong> Max Westheimer Airport is a general aviation facility without<br />
scheduled service. Norman is in the service area of <strong>Oklahoma</strong> City’s Will Rogers World Airport<br />
for scheduled services.<br />
Public transit CART (Clevel<strong>and</strong> Area Rapid Transit) passes 1 block to the east of the Norman station. The<br />
N21 bus on St. Peters Avenue proceeds to the South Loop transfer station on the <strong>Oklahoma</strong><br />
University campus for connections to all quadrants of the city. The buses run 7 a.m. to 8 p.m.<br />
Monday through Friday with reduced Saturday service.<br />
Rental car Yes, with station pickup available during normal business hours.<br />
Taxi Yes, numerous taxi providers 24/7.<br />
Purcell, <strong>Oklahoma</strong><br />
The Purcell station has an enclosed waiting area but no other amenities or services. No<br />
checked baggage is h<strong>and</strong>led. The station is owned by the City of Purcell.<br />
Location<br />
E. Main Street <strong>and</strong> N. Santa Fe Avenue<br />
Parking<br />
Twenty-seven spaces of free parking are available at the station property.<br />
Major highways North-South I-35, U.S. 77<br />
East-West O-39<br />
Intercity rail Yes, the Heartl<strong>and</strong> Flyer operates one round trip daily between <strong>Oklahoma</strong> City <strong>and</strong> Fort Worth.<br />
The train departs southbound in the morning, returning in the evening.<br />
Intercity bus None<br />
Aviation<br />
Ch<strong>and</strong>ler Field is a general aviation facility without scheduled service.<br />
Public transit Delta Public Transit operates a dem<strong>and</strong>/response rural transit system serving Purcell.<br />
Rental car Yes, with the agencies located in Norman. Station pickup available during normal business<br />
hours.<br />
Taxi<br />
Yes, several Norman taxi providers will serve Purcell for surcharge.<br />
11-6<br />
<strong>Oklahoma</strong> <strong>Statewide</strong> <strong>Freight</strong> <strong>and</strong> <strong>Passenger</strong> <strong>Rail</strong> <strong>Plan</strong>
<strong>Oklahoma</strong> <strong>Passenger</strong> <strong>Rail</strong><br />
Pauls Valley, <strong>Oklahoma</strong><br />
The Pauls Valley station has an enclosed waiting area but no other amenities or services.<br />
No checked baggage is h<strong>and</strong>led. The station is owned by the City of Pauls Valley. It is a<br />
new facility built in 2002 <strong>and</strong> is adjacent to the former Santa Fe station.<br />
Location<br />
S. Santa Fe Street at E. Paul Street<br />
Parking<br />
Fifty-seven spaces of free parking are available at the station.<br />
Major highways North-South I-35, U.S. 77<br />
East-West O-19<br />
Intercity rail Yes, the Heartl<strong>and</strong> Flyer operates one round trip daily between <strong>Oklahoma</strong> City <strong>and</strong> Fort Worth.<br />
The train departs southbound in the morning, returning in the evening.<br />
Intercity bus Greyhound operates intercity buses along the I-35 north-south route. The station is located at<br />
215 W. Paul Street, co-located with Delta Public Transit.<br />
Aviation<br />
Pauls Valley Municipal Airport is a general aviation facility with scheduled service.<br />
Public transit Delta Public Transit operates a dem<strong>and</strong>/response rural transit system serving Pauls Valley.<br />
Rental car<br />
Yes, with station pickup available during normal business hours.<br />
Taxi<br />
Yes, taxis from Norman or Ardmore will serve Pauls Valley for surcharge.<br />
Ardmore, <strong>Oklahoma</strong><br />
The Ardmore station has an enclosed waiting area but no other amenities or services.<br />
No checked baggage is h<strong>and</strong>led. The station is located in the former Santa Fe station <strong>and</strong><br />
shares space with the Community Police <strong>and</strong> the Main Street Coalition.<br />
Location<br />
251 E. Main Street<br />
Parking<br />
There are 48 spaces of free parking at the station.<br />
Major highways North-South I-35, U.S. 77<br />
East-West U.S. 70<br />
Intercity rail Yes, the Heartl<strong>and</strong> Flyer operates one round trip daily between <strong>Oklahoma</strong> City <strong>and</strong> Fort Worth.<br />
The train departs southbound in the morning, returning in the evening.<br />
Intercity bus Greyhound operates buses on the north-south route along I-35. The bus station is located at<br />
2501 W. Broadway, near the interstate. This is approximately 2 miles west of the train station.<br />
Aviation<br />
Ardmore Downtown Executive Airport is a general aviation facility without scheduled service.<br />
Public transit Southern <strong>Oklahoma</strong> Rural Transportation System operates a dem<strong>and</strong>/response transit<br />
operation that serves Ardmore <strong>and</strong> Carter County.<br />
Rental car<br />
Yes, with station pickup during normal business hours.<br />
Taxi Yes, Aa Cab Company 24/7.<br />
May 2012 11-7
Chapter 11<br />
Gainesville, Texas<br />
The Gainesville station has an enclosed waiting area but no other amenities or services.<br />
No checked baggage is h<strong>and</strong>led. The station is the former Santa Fe station <strong>and</strong> houses the<br />
Santa Fe Museum.<br />
Location<br />
605 E. California Street<br />
Parking<br />
There are 15 spaces of free parking at the station.<br />
Major highways North-South I-35 (co-located with U.S. 77)<br />
East-West U.S. 82<br />
Intercity rail Yes, the Heartl<strong>and</strong> Flyer operates one round trip daily between <strong>Oklahoma</strong> City <strong>and</strong> Fort Worth.<br />
The train departs southbound in the morning, returning in the evening.<br />
Intercity bus Greyhound operates buses on the north-south route along I-35. The bus station is located at<br />
1934 N. I-35. This is approximately 2 miles northwest of the train station.<br />
Aviation<br />
Gainesville Municipal Airport is a general aviation facility without scheduled service.<br />
Public transit The Texoma Area Paratransit Service operates both dem<strong>and</strong>/response transit services in the<br />
Gainesville region. Fixed route bus service is in planning stages.<br />
Rental car<br />
Yes, with station pickup during normal business hours.<br />
Taxi Yes, Safeway Transportation 24/7.<br />
Fort Worth, Texas<br />
The Fort Worth Amtrak station is the city-owned Fort Worth Intermodal Transit Center<br />
(ITC). The ITC joins several public transportation options together in the Fort Worth<br />
Central Business District. Connections are available to the Amtrak Texas Eagle, Heartl<strong>and</strong><br />
Location<br />
Parking<br />
1001 Jones Street<br />
There is no parking directly associated with the station but on-street metered parking is<br />
available as well as commercial parking adjacent to the station site.<br />
Major highways North-South I-35W, U.S. 81 <strong>and</strong> U.S. 77 co-located with I-35W, U.S. 287<br />
East-West I-20, U.S. 80<br />
Intercity rail The Heartl<strong>and</strong> Flyer schedule is timed to make a convenient transfer to the Texas Eagle. The<br />
Texas Eagle is a daily operation between Chicago <strong>and</strong> San Antonio. The eastbound (toward<br />
Chicago) <strong>and</strong> the westbound (toward San Antonio) trains meet at Fort Worth, affording<br />
transfers in either direction. On Monday, Wednesdays <strong>and</strong> Fridays, the westbound Texas Eagle<br />
continues to Los Angeles after a 7-hour layover in San Antonio. The eastbound Texas Eagle<br />
returning from Los Angles arrives at Fort Worth on Tuesday, Friday, <strong>and</strong> Sunday.<br />
Intercity bus Greyhound Lines, Kerrville Bus Company, <strong>and</strong> Americanos USA motor coach operators serve<br />
the ITC. Buses to points east or north almost universally require a transfer at Dallas. Direct<br />
buses are available to several points west, mostly via the I-20 or U.S. 287 corridors. Train <strong>and</strong><br />
bus schedules are not coordinated.<br />
Aviation<br />
Dallas-Fort Worth (DFW) Airport is a major hub facility serving 191 domestic <strong>and</strong> international<br />
destinations by 19 air carriers.<br />
11-8<br />
<strong>Oklahoma</strong> <strong>Statewide</strong> <strong>Freight</strong> <strong>and</strong> <strong>Passenger</strong> <strong>Rail</strong> <strong>Plan</strong>
<strong>Oklahoma</strong> <strong>Passenger</strong> <strong>Rail</strong><br />
Public transit The Trinity <strong>Rail</strong>way Express (TRE) is a commuter train that operates between Dallas <strong>and</strong><br />
Fort Worth. A shuttle connection to the Dallas/Fort Worth Airport is also afforded from<br />
the CentrePort station. The TRE operates its full schedule on weekdays <strong>and</strong> an abbreviated<br />
schedule on Saturdays. No Sunday service is offered. TRE offers convenient connection to the<br />
DART light rail system at Dallas Union Station. There are 17 departures <strong>and</strong> 22 arrivals at the<br />
ITC weekdays. The first train departs at 5:02 a.m. <strong>and</strong> the last arrives at 10:14 p.m. There is<br />
reduced Saturday service but no service on Sunday.<br />
The “T” operates 18 local <strong>and</strong> 5 express bus routes directly from the ITC. The routes extend<br />
to all quadrants of the “T” service area. Most buses operate from around 5:30 a.m. until<br />
10:00 p.m. Monday through Friday. There is reduced Saturday service but no Sunday service.<br />
Two blocks to the west of the ITC on Commerce Street, Molly the Trolley operates a loop route<br />
throughout the Fort Worth downtown from 10 a.m. to 10 p.m. daily. On Saturday, a shuttle<br />
directly from the ITC to the Fort Worth stockyard district operates from 9 a.m. to 10:30 p.m.<br />
Rental car<br />
Yes, with station pickup during normal business hours.<br />
Taxi Yes, numerous taxi providers 24/7.<br />
Flyer, the Trinity <strong>Rail</strong>way Express commuter train, commercial intercity buses, local transit<br />
bus routes, <strong>and</strong> rental cars.<br />
The station is located immediately adjacent to the east edge of downtown Fort Worth. The<br />
station is open from 8:00 a.m. until 6:00 p.m. with the ticket window <strong>and</strong> checked baggage<br />
counter operating from 10:00 a.m. until 5:30 p.m. The ticket kiosk is available from<br />
8:30 a.m. until 10:00 p.m. The station features an enclosed waiting area with payphones<br />
<strong>and</strong> an ATM. Fort Worth h<strong>and</strong>les checked baggage for the Texas Eagle. The Heartl<strong>and</strong><br />
Flyer does not have checked baggage. <strong>Passenger</strong>s transferring from the Eagle to the Heartl<strong>and</strong><br />
Flyer with checked bags must claim those bags before boarding.<br />
<strong>Plan</strong>ned new stations<br />
Two new stations are under consideration for the Heartl<strong>and</strong> Flyer. One is in <strong>Oklahoma</strong><br />
<strong>and</strong> the other in Texas. No definitive schedule has been made for these additions.<br />
Davis, <strong>Oklahoma</strong><br />
Location<br />
The historic station is located at the tracks on W. Main Street. The City Museum operates in the<br />
building.<br />
Parking<br />
There is limited free parking at the historic station.<br />
Major highways North-South I-35, U.S. 77<br />
East-West O-7<br />
Intercity rail None<br />
Intercity bus None<br />
Aviation<br />
Crazy Horse Municipal airport is a general aviation facility without scheduled service.<br />
Public transit Davis is in the dem<strong>and</strong>-response service area of Southern <strong>Oklahoma</strong> Rural Transit.<br />
Rental car Yes, with pickup available during normal business hours.<br />
Taxi<br />
Yes, taxis from Norman or Ardmore will serve Davis for surcharge.<br />
May 2012 11-9
Chapter 11<br />
Krum/Denton, Texas<br />
Krum is located 9 miles west of Denton, Texas.<br />
Location<br />
Parking<br />
No historic station site is apparent in Krum. Vacant l<strong>and</strong> is plentiful near the tracks.<br />
N/A<br />
Major highways North-South FM 156, I-35 is 3 miles east of town.<br />
East-West FM 1173, U.S. 380 is 1.5 miles south of town.<br />
Intercity rail None<br />
Intercity bus Greyhound serves Denton on its north-south I-35 route with its station located along I-35 near<br />
the intersection with FM 1173, approximately 3 miles from Krum.<br />
Aviation<br />
Denton Municipal Airport is a general aviation facility without scheduled service.<br />
Public transit Denton County Transit Authority operates fixed route public transportation in Denton County<br />
but does not serve Krum. The Denton A-train is a new interurban rail system that connects<br />
Denton to the DART system at Carrollton, for continuing service to Dallas.<br />
Rental car Yes, with station pickup during normal business hours.<br />
Taxi Yes, Denton County Taxi serve Krum 24/7.<br />
<strong>Rail</strong> connections<br />
Amtrak Fort Worth connections<br />
The Heartl<strong>and</strong> Flyer schedule is timed to make a convenient transfer to the Texas Eagle<br />
(Table 11‐3). The Eagle is a daily operation between Chicago <strong>and</strong> San Antonio. The eastbound<br />
(toward Chicago) <strong>and</strong> the westbound (toward San Antonio) trains meet at Fort<br />
Worth, affording transfers in either direction. On Monday, Wednesday, <strong>and</strong> Friday, the<br />
westbound Texas Eagle continues to Los Angeles after a 7-hour layover in San Antonio.<br />
The eastbound Texas Eagle returning from Los Angles arrives at Fort Worth on Tuesday,<br />
Friday, <strong>and</strong> Sunday.<br />
The continuation to Los Angeles is facilitated by connecting cars from the Texas Eagle to<br />
the New Orleans–Los Angeles Sunset Limited. The Sunset Limited only operates three<br />
days per week whereas the Texas Eagle is a daily train. On the return, cars are removed<br />
from the Limited <strong>and</strong> attached to the Eagle for the trip to Chicago via Fort Worth.<br />
Table 11-3<br />
Amtrak connections at Fort<br />
Worth<br />
From To Arrive Depart Layover<br />
Heartl<strong>and</strong> Flyer Eastbound Texas Eagle 12:39 PM 2:20 PM 1 hr 41 m<br />
Heartl<strong>and</strong> Flyer Westbound Texas Eagle 12:39 PM 2:10 PM 1 hr 31 m<br />
Eastbound Texas Eagle Heartl<strong>and</strong> Flyer 1:58 PM 5:25 PM 3 hr 27 m<br />
Westbound Texas Eagle Heartl<strong>and</strong> Flyer 1:25 PM 5:25 PM 4 hr 0 m<br />
11-10<br />
<strong>Oklahoma</strong> <strong>Statewide</strong> <strong>Freight</strong> <strong>and</strong> <strong>Passenger</strong> <strong>Rail</strong> <strong>Plan</strong>
<strong>Oklahoma</strong> <strong>Passenger</strong> <strong>Rail</strong><br />
From To Arrive Depart Layover<br />
Heartl<strong>and</strong> Flyer TRE (Monday—Saturday) 12:39 PM 1:51 PM 1 hr 12 m<br />
The 1:51 p.m. TRE arrives at CentrePoint at 2:15 p.m. Allow 40 minutes for the shuttle<br />
to arrive at DFW terminals. The shuttle runs every 15 minutes but is synchronized to TRE<br />
arrivals or departures. This TRE arrives Dallas Union Station at 2:47 p.m.<br />
TRE<br />
Heartl<strong>and</strong> Flyer 5:14 PM 5:25 PM 0 hr 11 m<br />
(Monday—Friday) This TRE departs Dallas Union Station at 4:20 p.m. The next earlier train departs Dallas at<br />
3:50 p.m. From DFW airport, passengers should be available for shuttle pickup no later<br />
than 4:10 p.m. This connection is very tight <strong>and</strong> carries risk of a missed connection if TRE<br />
experiences even minor delay. A 3:50 p.m. Dallas departure, arriving Fort Worth at 4:44 p.m.<br />
reduces delay risk.<br />
TRE (Saturday) Heartl<strong>and</strong> Flyer 4:44 PM 5:25 PM 0 hr 41 m<br />
This TRE departs Dallas Union Station at 3:49 p.m. From DFW airport, passengers should be<br />
available for shuttle pickup no later than 3:40 p.m.<br />
Table 11-4<br />
Trinity <strong>Rail</strong>way Express<br />
connections at Fort Worth<br />
Connections can also be made from the Texas Eagle to the Sunset Limited operating east<br />
of San Antonio to Houston <strong>and</strong> New Orleans. This connection accommodates transfers to<br />
<strong>and</strong> from the Heartl<strong>and</strong> Flyer.<br />
The southbound Texas Eagle arrives at San Antonio at 9:55 p.m. with the eastbound Sunset<br />
Limited departing at 11:55 p.m. on Mondays, Thursday <strong>and</strong> Saturday evenings.<br />
The westbound Sunset Limited arrives at San Antonio at 3:00 a.m. Tuesday, Thursday <strong>and</strong><br />
Saturday, with the northbound Texas Eagle departing at 7:00 a.m.<br />
Connections from the Heartl<strong>and</strong> Flyer to the Texas Eagle are quite convenient when considering<br />
the length of the trip usually involved on Amtrak long-distance trains. Returning<br />
to <strong>Oklahoma</strong> does require a longer wait but not totally out of reason (i.e., Los Angeles, El<br />
Paso). For a shorter trip to Austin or San Antonio, these wait times might be considered<br />
too long. For trips on the Eagle to or from points west of San Antonio, there is a lengthy<br />
layover in San Antonio also.<br />
Trinity <strong>Rail</strong>way Express Fort Worth connections<br />
The Trinity <strong>Rail</strong>way Express (TRE) is a commuter train that operates between Dallas <strong>and</strong><br />
Fort Worth (Table 11‐4). A shuttle connection to the Dallas-Fort Worth Airport (DFW) is<br />
also available at the CentrePoint station. The TRE operates its full schedule on weekdays<br />
<strong>and</strong> an abbreviated schedule on Saturdays. No Sunday service is offered. TRE offers convenient<br />
connection to the DART light rail system at Dallas Union Station.<br />
Ridership<br />
Overall, Heartl<strong>and</strong> Flyer ridership has shown steady growth since the start of the service.<br />
A downturn in 2009 is consistent with a downturn in all forms of travel due to the<br />
May 2012 11-11
Chapter 11<br />
Table 11-5<br />
Heartl<strong>and</strong> Flyer ridership <strong>and</strong><br />
revenues<br />
Table 11-6<br />
Ridership by station<br />
Year<br />
Revenue<br />
(Federal FY) Ridership Tickets Food Service<br />
1999 (3 ½ mo) 26,832 $532,985 $37,098<br />
2000 65,529 $1,213,228 $171,409<br />
2001 57,799 $1,069,520 $118,150<br />
2002 52,584 $903,402 $111,020<br />
2003 46,592 $756,268 $124,540<br />
2004 54,403 $900,980 $111,033<br />
2005 66,968 $1,187,567 $135,098<br />
2006 64,078 $1,174,234 $128,905<br />
2007 68,245 $1,260,566 $155,518<br />
2008 80,892 $1,682,089 $198,744<br />
2009 72,564 $1,592,434 $152,312<br />
2010 81,749 $1,806,780 $165,837<br />
2011 84,039 $1,911,994 $189,756<br />
Average Annual<br />
Boarding/Alighting<br />
Station<br />
(2007–2009)<br />
<strong>Oklahoma</strong> City 48,914<br />
Norman 12,333<br />
Purcell 2,320<br />
Pauls Valley 5,897<br />
Ardmore 9,114<br />
Gainesville 8,982<br />
Fort Worth 60,653<br />
recessionary economy.<br />
Ridership data is based<br />
upon the federal fiscal year,<br />
which starts on October 1<br />
(Table 11-5).<br />
June, July, <strong>and</strong> August<br />
are the highest ridership<br />
months with a spike in ridership<br />
also in March due to<br />
spring breaks (130 percent<br />
to 140 percent of average).<br />
The lowest ridership months<br />
are January <strong>and</strong> February<br />
(50 percent to 60 percent<br />
of average). Over the week,<br />
highest ridership occurs<br />
on Friday, Saturday, <strong>and</strong><br />
Sunday (140 percent to<br />
160 percent of average). Tuesday <strong>and</strong> Wednesday<br />
are the lowest days (80 percent of average).<br />
The southbound train has heavier ridership<br />
on Friday <strong>and</strong> Saturday <strong>and</strong> the northbound<br />
on Sunday, indicating that weekend breaks<br />
are being taken south of <strong>Oklahoma</strong> City. See<br />
Table 11-6 for average ridership by station <strong>and</strong><br />
Table 11‐7 for ridership between station pairs.<br />
Data showed a general downward trend in<br />
ridership for Purcell, Pauls Valley, <strong>and</strong> Gainesville,<br />
while other stations tended to follow the<br />
general growth trend in total ridership.<br />
Table 11-7<br />
<strong>Passenger</strong> distribution by<br />
station pairs<br />
Station Pair<br />
Percent of Ridership<br />
<strong>Oklahoma</strong> City–Fort Worth 55.6 %<br />
Norman–Fort Worth 12.7 %<br />
Ardmore–Fort Worth 5.3 %<br />
<strong>Oklahoma</strong> City–Gainesville 4.5 %<br />
Pauls Valley–Fort Worth 3.5 %<br />
All other pairs (16 pairs) 18.4 %<br />
Customer satisfaction <strong>and</strong><br />
innovations<br />
Because of the stewardship by<br />
ODOT to the operations of the<br />
Heartl<strong>and</strong> Flyer, the service has<br />
11-12<br />
<strong>Oklahoma</strong> <strong>Statewide</strong> <strong>Freight</strong> <strong>and</strong> <strong>Passenger</strong> <strong>Rail</strong> <strong>Plan</strong>
<strong>Oklahoma</strong> <strong>Passenger</strong> <strong>Rail</strong><br />
received numerous awards <strong>and</strong> consistently scores high on customer satisfaction surveys<br />
conducted by Amtrak.<br />
In 2010, the Heartl<strong>and</strong> Flyer was awarded Amtrak’s highest honor—the President’s Award<br />
for Safety <strong>and</strong> Service. This follows the Heartl<strong>and</strong> Flyer’s 2008 naming as the “Champion<br />
of the <strong>Rail</strong>s.”<br />
Also in 2010, Time magazine named the test of biodiesel fuel in the Heartl<strong>and</strong> Flyer as one<br />
of the top 50 inventions of 2010. The test was inaugurated in April 2010 <strong>and</strong> continued<br />
until April 2011. The fuel being tested, known as B-20, consisted of 20 percent biodiesel<br />
derived from cattle industry byproducts, mixed with petroleum-based diesel fuel. Results<br />
were favorable.<br />
Since 2006, the Heartl<strong>and</strong> Flyer has been co-sponsored by <strong>Oklahoma</strong> <strong>and</strong> Texas. This is<br />
the only state-sponsored service with more than one state taking the responsibility.<br />
The Heartl<strong>and</strong> Flyer consistently ranks high in customer satisfaction. The Amtrak CSI<br />
(Customer Satisfaction Index) is developed yearly for all routes in the Amtrak system.<br />
Data is collected via a mailed customer survey asking for passenger ratings on 38 separate<br />
aspects of service.<br />
On-time performance<br />
The ability to meet the published schedule is perhaps the most important customer<br />
requirement. Amtrak’s measure of schedule reliability is based on the length of the train’s<br />
trip from origin to endpoint. In the case of the Heartl<strong>and</strong> Flyer, the train is considered late<br />
if it arrives at its terminal more than 10 minutes behind schedule.<br />
Since 2009, the Heartl<strong>and</strong> Flyer’s schedule performance has been very good with more<br />
than 80 percent of trains arriving within the 10-minute on-time window. However,<br />
between mid-2005 <strong>and</strong> early 2009, on-time performance suffered <strong>and</strong> a slump in CSI<br />
scores can be seen (Table 11‐8). The score is based on a 0-to-100 scale with scores of 80 or<br />
greater being in the very satisfied category.<br />
In Amtrak’s tracking of schedule performance, delays are attributed to Amtrak, to the<br />
Host <strong>Rail</strong>road (BNSF), or to Other. Examination of delays in 2009 shows about 80 percent<br />
of delays are attributable to the Host <strong>Rail</strong>road, with the Amtrak or other categories<br />
responsible for approximately<br />
10 percent each. On-time performance<br />
improved significantly<br />
in 2009, likely due to the host<br />
railroad, BNSF, making passenger<br />
train on-time performance a<br />
priority.<br />
Delays encountered in 2010<br />
are shown in Table 11-9. Some<br />
delays are necessary for safety<br />
reasons. Amtrak, in general, has<br />
Year<br />
Heartl<strong>and</strong> Flyer<br />
All state-sponsored<br />
or short-distance<br />
Amtrak trains<br />
2004 91 83<br />
2005 90 83<br />
2006 88 83<br />
2007 86 84<br />
2008 92 86<br />
2009 94 88<br />
2010 95 not available<br />
Table 11-8<br />
Customer satisfaction index<br />
scores<br />
May 2012 11-13
Chapter 11<br />
Table 11-9<br />
Heartl<strong>and</strong> Flyer total delays by<br />
cause (2010)<br />
Delay Type<br />
Minutes<br />
Percent of<br />
Total<br />
Slow orders due to defects 11,815 53.3 %<br />
<strong>Freight</strong> train interference 3,346 15.1 %<br />
had problems with adhering to<br />
timetable schedules. The predominate<br />
source of the delays<br />
are the Host <strong>Rail</strong>roads.<br />
Routing delays 1,458 6.6 % The majority of Host <strong>Rail</strong>road<br />
Communication <strong>and</strong> signal work 1,260 5.7 % delays were for slow orders.<br />
Slow orders are temporary speed<br />
Weather 877 4.0 %<br />
restrictions placed on a track for<br />
<strong>Passenger</strong> related 737 3.3 %<br />
maintenance or other conditions.<br />
<strong>Freight</strong> train interference<br />
Wait on time 598 2.7 %<br />
Maintenance of way<br />
Trespassing/grade crossing<br />
Crew related<br />
482<br />
439<br />
406<br />
2.2 %<br />
2.0 %<br />
1.8 %<br />
can be due to dispatching<br />
misjudgment or traffic blocked<br />
due to congestion at Tower 55 in<br />
Various other 751 3.4 %<br />
Fort Worth. Tower 55 is the atgrade<br />
crossing of the BNSF <strong>and</strong><br />
Total 22,169 100 %<br />
UP railroads immediately south<br />
of the Fort Worth ITC. This<br />
location is infamous for delays due to the high traffic volume <strong>and</strong> the time needed to clear<br />
the signals <strong>and</strong> permit the next train to proceed across the crossing diamond. The State of<br />
Texas has recently received a grant from FRA to initiate improvements to expedite traffic<br />
through the Tower 55 crossing.<br />
In 2009, Amtrak’s Inspector General published results of a study on the revenue implications<br />
of on-time performance. 4 A positive correlation was found. Sensitivity of the<br />
Heartl<strong>and</strong> Flyer was low, showing an expected negative impact on revenue of $7.11 for<br />
every minute of delay. In the short-distance or state-sponsored category, the average cost<br />
of delay was $31.00 per minute.<br />
Funding<br />
After 18 years, since the cancellation of the Lone Star, the Taxpayer Relief Act of 1997<br />
afforded payments by Amtrak to states that did not have passenger rail service. The<br />
payment of $23 million to <strong>Oklahoma</strong> provided the basis to establish the new service connecting<br />
<strong>Oklahoma</strong> City <strong>and</strong> Fort Worth starting on June 14, 1999.<br />
Through 2006, <strong>Oklahoma</strong> was the sole sponsor of the Heartl<strong>and</strong> Flyer, although it served<br />
both Gainesville <strong>and</strong> Fort Worth, Texas. Starting in 2007, the State of Texas, through<br />
action of the Texas Transportation Commission, allocated $1.8 million to support the service.<br />
Since then, Texas has taken a 50-percent stake in the sponsorship expense. For 2010,<br />
the State of <strong>Oklahoma</strong> provided $1,950,000 for the operation.<br />
Train equipment<br />
Amtrak, under its operating agreement with the State of <strong>Oklahoma</strong>, provides <strong>and</strong> maintains<br />
the rolling stock used by the Heartl<strong>and</strong> Flyer. The train typically consists of one<br />
General Electric P42DC Genesis Series 1 locomotive, two double-deck coach cars, <strong>and</strong> a<br />
4<br />
Amtrak Office of Inspector General, Financial Impact of Equipment Delays, Evaluation Report E-09-02, March 25, 2009.<br />
11-14<br />
<strong>Oklahoma</strong> <strong>Statewide</strong> <strong>Freight</strong> <strong>and</strong> <strong>Passenger</strong> <strong>Rail</strong> <strong>Plan</strong>
<strong>Oklahoma</strong> <strong>Passenger</strong> <strong>Rail</strong><br />
double-deck combination café/coach car. This configuration has a total seating capacity of<br />
210. The cars are generally of the Amtrak car series known as the Superliners.<br />
A non-powered control unit (NPCU) locomotive is also attached. This locomotive is an<br />
older model that has had its diesel engine <strong>and</strong> other propulsion equipment removed but<br />
its control equipment remains active. The space formerly occupied by the propulsion<br />
equipment is modified <strong>and</strong> could be utilized to carry baggage. The baggage space is not<br />
typically utilized by the Heartl<strong>and</strong> Flyer. These NPCU units are also referred to as a cabbage<br />
car (cab plus baggage). The P42DC locomotive is placed at the north end of the train<br />
<strong>and</strong> the NPCU car is attached at the south end. The train is capable of operating in either<br />
direction without turning the train around to reverse its direction.<br />
In summer months, a second P42DC may be substituted for the NPCU to provide backup<br />
power in case of a locomotive failure. A complete locomotive failure would disable the<br />
train’s air conditioning <strong>and</strong> food storage refrigeration. Also during the peak summer<br />
months <strong>and</strong> during spring break, an additional car is added for increased capacity. The<br />
extra car is usually a café/coach car but without the food service facilities being in operation.<br />
Recently, Amtrak has substituted the second P42DC for the NPCU for greater<br />
periods of time.<br />
The P42DC is capable of a top speed of 110 mph with its 4,250 horsepower engine, but<br />
the trackage <strong>and</strong> signaling between <strong>Oklahoma</strong> City <strong>and</strong> Fort Worth limits operations to<br />
79 mph maximum.<br />
The Superliner cars were first ordered by Amtrak in the late 1970s. The first order was<br />
constructed by Pullman St<strong>and</strong>ard. A second order of Superliner cars was made in the<br />
early 1990s <strong>and</strong> constructed by Bombardier. These double-deck cars were modeled after<br />
the Santa Fe Hi-Liner cars used by the Atchison, Topeka <strong>and</strong> Santa Fe <strong>Rail</strong>way on their<br />
El Capitan Chicago–Los Angeles service. Before 2008, former Santa Fe Hi-Level coaches<br />
were common in the Heartl<strong>and</strong> Flyer consist, but have now been retired. Each coach car<br />
has a seating capacity of 74 persons—62 on the upper deck <strong>and</strong> 12 on the lower deck. The<br />
lower deck is compliant with the Americans with Disabilities Act.<br />
Light running repairs on the train equipment can be performed by the Amtrak shop in<br />
Fort Worth. Cleaning is performed at both Fort Worth <strong>and</strong> <strong>Oklahoma</strong> City. Under special<br />
circumstances, maintenance can be performed overnight while the train is parked in<br />
<strong>Oklahoma</strong> City. Every 90 days, the passenger cars are taken to Amtrak’s Beech Grove Shop<br />
near Chicago for periodic maintenance <strong>and</strong> inspection. During the maintenance absence,<br />
the car is replaced by the protect 5 café/coach that is used in the summer months <strong>and</strong> as a<br />
spare for these circumstances.<br />
Ticketing<br />
Except for Fort Worth <strong>and</strong> <strong>Oklahoma</strong> City, none of the stations on the Heartl<strong>and</strong> Flyer route<br />
has agents or Quik-Trak automated ticketing kiosks. Tickets are sold on-board by the train<br />
staff. It is reported that much of the staff ’s time en route is consumed by ticketing duties.<br />
5<br />
Protect is the railroad term denoting spare equipment available to complete a train consist.<br />
May 2012 11-15
Chapter 11<br />
Ticketing is also available over the Amtrak internet website or by telephone at 1-800-USA-<br />
RAIL. If the ticket is purchased a sufficient time before the journey, Amtrak will mail the<br />
tickets to the passenger. If time is not sufficient to mail tickets, the purchaser can print a<br />
voucher that can be exchanged onboard or at the Fort Worth ticket counter for the ticket.<br />
Alternatively, the purchaser can receive a code number by telephone as proof of reservation<br />
<strong>and</strong> can be presented on-board along with payment for the ticket.<br />
Amtrak is initiating other improvements in e-ticketing that will connect conductors to<br />
the national reservation system <strong>and</strong> permit passengers to display virtual tickets on their<br />
smart phones. Availability of these improvements on the Heartl<strong>and</strong> Flyer has not yet been<br />
announced.<br />
Advance purchase tickets can also be printed at an Amtrak Quik-Trak automated ticket<br />
kiosk. These kiosks are available both at <strong>Oklahoma</strong> City <strong>and</strong> Fort Worth.<br />
Amtrak practices revenue management, or as known in the air travel industry, yield management.<br />
Ticket prices are adjusted in accordance with the dem<strong>and</strong> for a certain train on a<br />
certain day. Tickets purchased onboard without an advance reservation are charged at the<br />
highest price.<br />
Host railroad—BNSF<br />
The Heartl<strong>and</strong> Flyer operates on tracks owned <strong>and</strong> controlled by BNSF, headquartered in<br />
Fort Worth, Texas. BNSF is the successor to the Atchison, Topeka <strong>and</strong> Santa Fe railroad,<br />
the long-time operator of this line. Santa Fe’s subsidiary, the Gulf, Colorado <strong>and</strong> Santa Fe<br />
<strong>Rail</strong>road, created the line connecting the Santa Fe’s east-west mainline at Newton, Kansas,<br />
to the seaport at Galveston, Texas. The connection was completed in 1887.<br />
As one of the original subscribers to Amtrak under the RPSA, Amtrak was given the right<br />
to operate over Atchison, Topeka <strong>and</strong> Santa Fe (now BNSF) tracks in exchange for payment<br />
of the incremental costs imposed by the passenger operation. Because calculation<br />
of incremental costs is not a science, considerable negotiation is required to settle on the<br />
level of payment. The agreement for the Heartl<strong>and</strong> Flyer contains a provision for incentive<br />
payments for consistent on-time performance <strong>and</strong> penalties for BNSF-related delays.<br />
Since 2009, the Heartl<strong>and</strong> Flyer’s on-time performance has improved dramatically, corresponding<br />
to the BNSF initiative to improve passenger train performance on its system.<br />
Amtrak monthly performance reports consistently show BNSF on-time performance as<br />
the best among the six host railroads for Amtrak service.<br />
The BNSF line between Fort Worth <strong>and</strong> <strong>Oklahoma</strong> City is part of a high-density freight<br />
lane known as the Mid-Continent corridor(Mid-Con). BNSF has designated this route<br />
for concentrated capital improvements <strong>and</strong> it is the preferred route for much of its northsouth<br />
traffic. Mid-Con traffic is dominated by merch<strong>and</strong>ise, manufactured goods, <strong>and</strong><br />
grain moving between the Midwest <strong>and</strong> Pacific Northwest to Texas <strong>and</strong> Gulf of Mexico<br />
ports. The line also connects to BNSF’s crossing to Mexico at Eagle Pass, Texas. Additionally,<br />
coal moving from the Powder River Basin in Wyoming to Texas uses this route. In all,<br />
11-16<br />
<strong>Oklahoma</strong> <strong>Statewide</strong> <strong>Freight</strong> <strong>and</strong> <strong>Passenger</strong> <strong>Rail</strong> <strong>Plan</strong>
<strong>Oklahoma</strong> <strong>Passenger</strong> <strong>Rail</strong><br />
approximately 23 to 24 6 trains per day utilize the line. The Mid-Con is used in a quasidouble<br />
track arrangement with another parallel BNSF line located in eastern <strong>Oklahoma</strong>.<br />
Maximum passenger train speed in <strong>Oklahoma</strong> is 79 mph. In Texas, the speed limit is<br />
55 mph. Texas recently received a federal ARRA grant of $4 million to make improvements<br />
to grade-crossing signal timing in order to permit higher speeds over the line.<br />
These savings could result in a 17-minute reduction in run time.<br />
Speeds above 79 mph require the very costly addition of in-cab signal indicators under<br />
current regulations. Cab signals consist of both trackside <strong>and</strong> onboard equipment, <strong>and</strong><br />
every control locomotive operating over the route would need to be equipped, regardless<br />
of the speed operated. All lines that carry passenger trains or specified hazardous materials<br />
are required to be equipped with positive train control (PTC) by 2015. PTC provides<br />
for automatic control of a train to avoid a crash. The current centralized train control used<br />
on the line provides the instruction necessary for a train crew to avoid crashes but is reliant<br />
on crew attention to see <strong>and</strong> to obey signal indications.<br />
The line is also subject to heat slow orders. Between 95°F <strong>and</strong> 109°F, trains are restricted to<br />
60 MPH; at 110°F or higher, the speed limit is 40 MPH. These restrictions are due to the<br />
heightened possibility of heat kinks or sun kinks forming in the track. These kinks form<br />
from high compressive stress in the rails due to heat expansion. They present a serious<br />
derailment risk.<br />
Amtrak <strong>and</strong> operating agreement<br />
For each federal fiscal year, the operation of the Heartl<strong>and</strong> Flyer is governed by an operating<br />
agreement between Amtrak <strong>and</strong> the States of <strong>Oklahoma</strong> <strong>and</strong> Texas. The agreements<br />
outline the services to be provided, the responsibility for the provision of certain facilities<br />
<strong>and</strong> equipment, <strong>and</strong> the payments to be made by the parties. The state-sponsored,<br />
Amtrak-operated service description includes the stations serviced <strong>and</strong> the schedule.<br />
Amtrak is obligated to provide daily round-trip service over a route serving the designated<br />
stations. Amtrak is not required to provide addition frequencies or service on other<br />
routes; however, nothing in the agreement restricts Amtrak from providing additional<br />
frequencies or service on additional routes at its own discretion <strong>and</strong> expense.<br />
Amtrak is required to make its best effort to provide a service of high-quality. The states<br />
<strong>and</strong> Amtrak are obligated to cooperate in efforts to improve the service. Decisions regarding<br />
the on-board menu <strong>and</strong> pricing, on-board amenities, fares, on-board operating<br />
policies, <strong>and</strong> reservation requirements must be made jointly by the parties. General tariff<br />
provisions of Amtrak apply to the Heartl<strong>and</strong> Flyer.<br />
The states are obligated to provide station facilities, all of which must be compliant with<br />
the Americans with Disabilities Act. All costs for station acquisition <strong>and</strong> upkeep are<br />
the responsibility of the states. If a station is unavailable, the respective state is liable to<br />
Amtrak for any losses incurred due to the unavailability, including the provision of alternative<br />
transportation.<br />
6<br />
BNSF 2010 Traffic Data<br />
May 2012 11-17
Chapter 11<br />
The States of <strong>Oklahoma</strong> <strong>and</strong> Texas pay Amtrak a fixed amount for the service plus 50 percent<br />
of the fuel cost <strong>and</strong> BNSF track usage fees. The fuel charges are calculated based<br />
on parameters agreed to by the parties <strong>and</strong> are a best effort to simulate the actual fuel<br />
usage <strong>and</strong> costs. The states are billed monthly for one-twelfth of the fixed amount <strong>and</strong><br />
the fuel <strong>and</strong> BNSF charges for the month. For the federal FY 2012, the <strong>Oklahoma</strong> fixed<br />
amount is $1,089,667. A cap on the fixed amount, fuel, <strong>and</strong> BNSF charges is established<br />
at $2,325,000. The flow of funds is analyzed after two-thirds of the contract period has<br />
passed <strong>and</strong>, if the cap is projected to be inadequate, the State agrees to provide additional<br />
funding or cooperate with Amtrak in finding cost reductions. The State of Texas has a<br />
similar reimbursement agreement accounting for 50 percent of the fuel <strong>and</strong> BNSF charges<br />
but with a different fixed amount.<br />
The agreement has provisions for the states to provide the passenger equipment (except<br />
locomotives) in the stead of Amtrak <strong>and</strong> provides for the approval <strong>and</strong> acceptance of the<br />
equipment <strong>and</strong> adjustments in the financial obligations.<br />
The parties agreed to each defend, indemnify, <strong>and</strong> hold the other harmless for losses or<br />
injuries to properties or parties associated or attached to them. Amtrak has full responsibility<br />
for its equipment <strong>and</strong> employees <strong>and</strong> incidents resulting from the operation of the<br />
service, except when employees or contractors of a state are involved.<br />
2009 Texas Transportation Institute on-board survey<br />
In April <strong>and</strong> July of 2009, the Texas Transportation Institute of Texas A&M University<br />
conducted on-board surveys to determine several characteristics of Heartl<strong>and</strong> Flyer passengers.<br />
7 Data was collected on ten one-way trips in April (five each direction) <strong>and</strong> seven<br />
one-trips in July (four northbound, three southbound). Table 11‐10 shows the distribution<br />
of passenger activity by station for the two survey months. During the April data collection<br />
period, 435 surveys were completed. In July, 588 surveys were received. Because of<br />
parental consent issues, passengers under 18 years old were not surveyed; also, passengers<br />
traveling in organized groups were not surveyed. Of the eligible passengers that chose to<br />
participate in the survey, 98 percent returned their survey instrument complete.<br />
Table 11-10<br />
Origin <strong>and</strong> destination station<br />
distribution of passengers<br />
Station April July<br />
<strong>Oklahoma</strong> City 31% 32%<br />
Norman 9% 11%<br />
Purcell 1% 1%<br />
Pauls Valley 2% 3%<br />
Ardmore 8% 4%<br />
Gainesville 6% 4%<br />
Station access<br />
Several modes of arriving or<br />
departing the station are available<br />
(Table 11-11). The survey<br />
revealed that the private automobile<br />
is the dominate mode of<br />
accessing the rail station.<br />
Fort Worth 43% 45%<br />
Making the connection to<br />
the national Amtrak system<br />
accounts for just fewer than<br />
10 percent of passengers but has been a primary driver in setting the Heartl<strong>and</strong> Flyer<br />
schedule to make the connection with the Texas Eagle. However, an examination of the<br />
7<br />
Benjamin Sperry & Curtis Morgan, Measuring the Benefits of Intercity <strong>Passenger</strong> <strong>Rail</strong>: A Study of the Heartl<strong>and</strong> Flyer Corridor,<br />
Texas Transportation Institute, April 2010.<br />
11-18<br />
<strong>Oklahoma</strong> <strong>Statewide</strong> <strong>Freight</strong> <strong>and</strong> <strong>Passenger</strong> <strong>Rail</strong> <strong>Plan</strong>
<strong>Oklahoma</strong> <strong>Passenger</strong> <strong>Rail</strong><br />
Percent of <strong>Passenger</strong>s<br />
Mode<br />
at Origin<br />
at Destination<br />
Drove or rode with other passenger 41% 32%<br />
Drop-off/pick-up by private car 36% 37%<br />
Local transit 4% 6%<br />
Commuter train (TRE) 2% 2%<br />
Amtrak connection (Texas Eagle) 1 9% 6%<br />
Intercity bus 2 0% 0%<br />
Pedestrian or bicycle 4% 7%<br />
Taxi or shuttle 5% 10%<br />
1<br />
Numbers of passengers accessing the Texas Eagle connection was substantially higher in July than April. This may indicate the use of the connection is for<br />
longer vacation-like trips.<br />
2<br />
Greyhound Lines services the Fort Worth station directly but does not coordinate any schedules to the Heartl<strong>and</strong> Flyer schedule. Amtrak does not operate any<br />
Thruway bus services in connection with the Heartl<strong>and</strong> Flyer.<br />
Table 11-11<br />
Means of station access<br />
station access data indicates that only 2 percent of Heartl<strong>and</strong> Flyer passengers connect<br />
to the TRE commuter train to Dallas. While this would be a cross platform transfer, the<br />
timing of the trains does not make this connection convenient. Some alteration of train<br />
schedules could improve this opportunity to build ridership by providing convenient<br />
access to Dallas.<br />
Market area<br />
The time needed to travel to<br />
the train station is an indicator<br />
of the distance from which<br />
passengers are drawn to the<br />
train service (Table 11-12 <strong>and</strong><br />
Table 11-13).<br />
In July, the radius of the destination<br />
hinterl<strong>and</strong> is larger, likely<br />
indicating using the train for<br />
longer trips (Table 11-14).<br />
Trip purpose<br />
Access Time April July<br />
10 minutes or less 23% 18%<br />
10 to 30 minutes 43% 42%<br />
30 minutes to 1 hour 13% 16%<br />
1 to 2 hours 11% 13%<br />
over 2 hours 11% 12%<br />
Access Distance April July<br />
10 miles or less 35% 32%<br />
10 to 20 miles 26% 18%<br />
20 to 50 miles 15% 23%<br />
50 to 100 miles 7% 15%<br />
The reasons that passengers have<br />
for making a trip is of value in<br />
over 100 miles 17% 13%<br />
evaluating whether opportunities<br />
might exist to alter the service to make a greater market penetration. Recreational <strong>and</strong><br />
social purposes currently dominate the current ridership (Table 11-15). These purposes<br />
might not be as sensitive to schedule alterations as other, more clock-sensitive purposes.<br />
Table 11-12<br />
Origin station access time<br />
Table 11-13<br />
Access distance to origin station<br />
Pleasure travel dominates Heartl<strong>and</strong> Flyer trips. The presence of the University of <strong>Oklahoma</strong><br />
at Norman might be expected to generate more trips, but the proximity of Norman<br />
to <strong>Oklahoma</strong> City combined with a single trip per day probably accounts for the low<br />
May 2012 11-19
Chapter 11<br />
11-20<br />
Table 11-14<br />
Destination radius<br />
Table 11-15<br />
Trip purpose<br />
Table 11-16<br />
Diverted <strong>and</strong> induced trips<br />
Table 11-17<br />
Trip duration<br />
Destination Radius April July<br />
10 miles or less 39% 38%<br />
10 to 20 miles 32% 26%<br />
20 to 50 miles 18% 21%<br />
50 to 100 miles 8% 14%<br />
over 100 miles 16% 10%<br />
Purpose April July<br />
Visit family/friends 36% 42%<br />
College/university 2% 1%<br />
Business trip 5% 2%<br />
Leisure/recreation 45% 33%<br />
Personal business 6% 5%<br />
Shopping 1% 2%<br />
Vacation 4% 15%<br />
Alternative Travel Mode April July<br />
Diverted Trips<br />
Private automobile 58% 63%<br />
Rental or company vehicle 3% 2%<br />
Airline 7% 5%<br />
Intercity bus 3% 3%<br />
<strong>Oklahoma</strong> <strong>Statewide</strong> <strong>Freight</strong> <strong>and</strong> <strong>Passenger</strong> <strong>Rail</strong> <strong>Plan</strong><br />
number of riders for that purpose.<br />
Students have historically<br />
been a good source of riders. The<br />
University community would be<br />
better served by a commuter or<br />
the Tulsa-<strong>Oklahoma</strong> City intercity<br />
services that are proposed<br />
with multiple daily frequencies.<br />
Table 11-16 reveals the travel<br />
mode that would have been used<br />
if the Heartl<strong>and</strong> Flyer was not<br />
used. The 27‐ to 29‐percent range<br />
for induced trips, that is trips that<br />
would not have been made without<br />
the Heartl<strong>and</strong> Flyer, is higher<br />
than usually seen for similar<br />
operations. As an alternative, the<br />
private automobile dominates.<br />
Significant in the results were the<br />
numbers of persons that would<br />
not have made the trip if it were<br />
not for the Heartl<strong>and</strong> Flyer. This<br />
level of induced travel is higher<br />
than what is usually predicted for<br />
this type of travel.<br />
Induced Trips<br />
Would not otherwise make trip 29% 27%<br />
Questions regarding trip<br />
duration yielded answers not<br />
completely predictable yet some<br />
general <strong>and</strong> expected patterns were present upon closer examination. First, <strong>Oklahoma</strong><br />
residents can <strong>and</strong> do make single day round trips. Two nights away are more prevalent<br />
for Texas residents traveling to <strong>Oklahoma</strong>. The survey did not determine the relationship<br />
between state of residence <strong>and</strong> trip duration directly. It can be seen that summer trips tend<br />
toward slightly longer duration (Table 11-17).<br />
Other characteristics<br />
Nights Away from Origin April July<br />
None<br />
1<br />
22%<br />
23%<br />
19%<br />
19%<br />
The vast majority of passengers<br />
are low frequency riders with<br />
2 20% 23% 89 percent indicating making<br />
four or fewer one-way trips per<br />
3 to 5 24% 25%<br />
year.<br />
6 or more 10% 14%<br />
The survey permitted up to two<br />
answers on why the Heartl<strong>and</strong> Flyer was chosen for the trip. The most common reasons<br />
(in order) were (1) more comfortable/relaxing (38 percent), (2) least expensive (32 percent),<br />
(3) rather not drive (22 percent), (4) avoid congestion or parking (12 percent). Only
<strong>Oklahoma</strong> <strong>Passenger</strong> <strong>Rail</strong><br />
7 percent of riders responded that they did not have access to another vehicle or did not<br />
drive. The novelty of a train trip or the opportunity to treat gr<strong>and</strong>children to a train trip<br />
was a common response (14 percent).<br />
<strong>Oklahoma</strong> residents made up the majority of passengers at 73 percent. Texas residents<br />
accounted for 20 percent. The train schedule is more convenient for <strong>Oklahoma</strong> residents<br />
but it should be noted that spending by passengers at their destination would better<br />
benefit Texas.<br />
The gender of Heartl<strong>and</strong> Flyer passengers was heavily weighted toward females at 62 percent.<br />
This result is not uncommon, but the percentage is high. All ages of passengers were<br />
represented but there is a bias towards passengers 45 years of age or older.<br />
<strong>Passenger</strong> service issues<br />
Southwest Chief reroute<br />
A re-route of the Southwest Chief, currently operating between Chicago <strong>and</strong> Los Angeles<br />
via the BNSF Raton Pass, has been proposed. One possible re-route would be directed<br />
onto the BNSF TransCon 8 line <strong>and</strong> the train would pass through Wichita <strong>and</strong> across western<br />
<strong>Oklahoma</strong>. A stop at Woodward would be possible.<br />
The re-route has been discussed but no plans to institute the change have been put in<br />
motion. The current route, through Dodge City <strong>and</strong> Garden City, Kansas, La Junta <strong>and</strong><br />
Trinidad, Colorado, across Raton Pass, <strong>and</strong> through Raton, Las Vegas, <strong>and</strong> Albuquerque,<br />
New Mexico, was the original main line of the BNSF predecessor Santa Fe <strong>Rail</strong>road <strong>and</strong><br />
famous for its former premier train, the Super Chief.<br />
The possible re-route is over the current BNSF TransCon <strong>and</strong> passes through Wichita,<br />
Kansas, Woodward, <strong>Oklahoma</strong>, Amarillo, Texas, <strong>and</strong> Vaughn, New Mexico. The route,<br />
however, misses Albuquerque before rejoining the historic main track at Belen, New<br />
Mexico, on its way to Los Angeles. This bypass of the historic Raton Pass mainline was<br />
originally built for freight trains to avoid the steep gradients. The Southwest Chief has been<br />
kept on the Raton Pass route to benefit from the scenery. As little freight now uses the<br />
route, <strong>and</strong> the incremental cost arrangement between the host railroads <strong>and</strong> Amtrak now<br />
makes operation over the original main more expensive for Amtrak.<br />
An alternative re-route would be on the BNSF MidCon 9 line, through Wichita to Perry,<br />
then west on the BNSF Avard subdivision to rejoin the TransCon at Avard, about<br />
44.6 miles east of Woodward.<br />
Delay<br />
Research into passenger preferences indicates that on-time performance is the most<br />
important parameter in customer satisfaction. 10 Service unreliability is a problem<br />
8<br />
TransCon—short for Trans Continental, is the BNSF high traffic density east-west route connecting California markets to<br />
the Midwest.<br />
9<br />
MidCon—short for mid-continent, is the BNSF high traffic density north-south route connecting the Midwest with<br />
Mexico <strong>and</strong> Gulf ports.<br />
10<br />
Taylor Nelson for British <strong>Rail</strong>ways Board, 1976.<br />
May 2012 11-21
Chapter 11<br />
experienced by Amtrak systemwide. The Heartl<strong>and</strong> Flyer has benefited from the perspective<br />
of BNSF that passenger train on-time arrivals reflects upon its br<strong>and</strong> also <strong>and</strong> has<br />
made changes to greatly improve its performance. With the improvement, ODOT cannot<br />
become complacent in monitoring delay <strong>and</strong> its causes. On-time performance is an issue<br />
made for constant improvement approaches.<br />
Dirty cars after maintenance<br />
This issue was raised in interviews with ODOT personnel involved with Heartl<strong>and</strong> Flyer<br />
stewardship. When returned from their periodic maintenance visits to Amtrak’s Beech<br />
Grove shops in Indiana, the cars have been used in other regular Amtrak operations<br />
before delivery to the Heartl<strong>and</strong> Flyer. It has been noted that the cars are not returned<br />
clean <strong>and</strong> orderly. Customer preference research has shown that the cleanliness of cars <strong>and</strong><br />
stations is a high priority, even higher than trip time. The Operating Agreement calls on<br />
Amtrak to perform in creating a high quality service. Methods to improve the situation<br />
need exploring by the parties.<br />
Need for improved connections<br />
Both ends of the Heartl<strong>and</strong> Flyer route have numerous transit <strong>and</strong> transportation operations<br />
that could enhance the usefulness of both the Heartl<strong>and</strong> Flyer <strong>and</strong> the connecting<br />
services. Tight connections with the Heartl<strong>and</strong> Flyer are not currently in place, <strong>and</strong> those<br />
connections are important, especially with shorter trips within the metropolitan areas.<br />
Wi-fi<br />
The installation of wireless internet access onboard passenger rail cars has proven to be<br />
a popular <strong>and</strong> widely used customer service feature on Amtrak’s routes in the northeast<br />
U.S. Wi-fi provides many passengers, not just business passengers, with the ability to be<br />
productive or just to be connected. <strong>Oklahoma</strong> is initiating investigations into the costs<br />
<strong>and</strong> logistics of providing internet connectivity for the Heartl<strong>and</strong> Flyer.<br />
Other <strong>Rail</strong> <strong>Passenger</strong> Operations<br />
No other passenger trains operate in <strong>Oklahoma</strong> strictly for the provision of transportation.<br />
The <strong>Oklahoma</strong> <strong>Rail</strong>way Museum in <strong>Oklahoma</strong> City offers short rides on passenger trains<br />
equipment. The rides are available primarily on weekends <strong>and</strong> holidays.<br />
Farmrail, in cooperation with the Lone Wolf <strong>and</strong> Quartz Mountain Arts <strong>and</strong> Conference<br />
Center <strong>and</strong> Nature Park, offers excursion rides between the Quartz Mountain Resort <strong>and</strong><br />
Lone Wolf. For 2010, five excursions are scheduled in the summer <strong>and</strong> fall months. The<br />
station is located at the intersection of State Highways 44 <strong>and</strong> 44A, near Lake Altus. Specific<br />
information can be obtained at (580) 323-1234.<br />
11-22<br />
<strong>Oklahoma</strong> <strong>Statewide</strong> <strong>Freight</strong> <strong>and</strong> <strong>Passenger</strong> <strong>Rail</strong> <strong>Plan</strong>
12. Multimodal Connectivity—<strong>Passenger</strong><br />
OKLAHOMA<br />
STATEWIDE FREIGHT &<br />
PASSENGER RAIL PLAN<br />
For numerous reasons detailed in the <strong>Oklahoma</strong> railroad development sections, passenger<br />
rail services have not been blended into the overall fabric of the transportation system in<br />
the U.S. except in the older, densely-populated northeast. The newer urbanized areas grew<br />
in the two-mode era of commercial aviation <strong>and</strong> private automobiles. While the speed of<br />
the airplane <strong>and</strong> the convenience of the private automobile have significant mobility benefits,<br />
neither of these modes are energy efficient <strong>and</strong> have rendered l<strong>and</strong> use patterns that<br />
further exaggerate energy dem<strong>and</strong> <strong>and</strong> consume vast tracts of l<strong>and</strong>.<br />
A st<strong>and</strong>-alone intercity passenger rail system does not make for convenient transportation.<br />
Its ability to attract patronage from the competing modes is greatly diminished<br />
without convenient connections. Consequently, the presence of last mile alternatives is<br />
critical to the success of intercity passenger rail services (just as they are to commercial<br />
air service). Intercity passenger trains themselves can assume the role of a feeder service<br />
for extended journeys. Newark Liberty International Airport in Newark, New Jersey, <strong>and</strong><br />
Baltimore-Washington International Airport are prime examples of where Amtrak (<strong>and</strong><br />
local commuter trains) feed passengers from an entire region to the airport.<br />
Amtrak has had success with its Thruway motorcoach services as a means of linking to a<br />
broader market. Thruway buses are used at many locations on Amtrak’s system to connect<br />
passengers to popular destinations. There is no Thruway bus service currently connected<br />
with the Heartl<strong>and</strong> Flyer, but passengers connecting with the southbound Texas Eagle can<br />
use the Thruway to reach Killeen, Texas, <strong>and</strong> Fort Hood from the Temple, Texas, Amtrak<br />
station. A return connection is also available.<br />
ODOT recently conducted a Transit Gap analysis, surveying where there is a lack of<br />
mobility in the state. This investigation found “Information obtained during public<br />
outreach efforts associated with the update of the <strong>Oklahoma</strong> <strong>Statewide</strong> Intermodal <strong>Plan</strong><br />
found that, in general, adequate urban <strong>and</strong> regional transit is available for users. However,<br />
a need exists to improve statewide mobility <strong>and</strong> provide modal connections that will<br />
permit transit users to travel beyond urban <strong>and</strong> regional boundaries.” While the analysis<br />
found that transit can be used for general mobility, it did not particularly address the convenience<br />
issues that make public transportation options attractive to the segment of the<br />
public that have other travel options. Capturing those riders is key to growing ridership<br />
<strong>and</strong> further growing the transport option available.<br />
Intercity <strong>Rail</strong> Connections<br />
The nearly five-hour layover of the Heartl<strong>and</strong> Flyer in Fort Worth complicates a tight connection<br />
with the Texas Eagle. While the connection with the southbound Heartl<strong>and</strong> Flyer<br />
is reasonable, the return to <strong>Oklahoma</strong> requires waiting throughout the afternoon. An<br />
May 2012 12-1
Chapter 12<br />
earlier departure to <strong>Oklahoma</strong> could reduce this wait but would harm other trip purposes<br />
that need time in Fort Worth. Fort Worth is home to world-class art museums <strong>and</strong> historical<br />
sites. Currently, the Texas Eagle connection accounts for only 6 to 9 percent of the<br />
Heartl<strong>and</strong> Flyer passengers. Leisure passengers account for a much higher percentage <strong>and</strong><br />
an earlier departure from Fort Worth might discourage day-trippers.<br />
Three days per week, cars from the Texas Eagle continue to Los Angeles connected to the<br />
Sunset Limited at San Antonio. Some cars from Los Angeles are connected to the Texas<br />
Eagle for the return trip. Connection to the Sunset Limited between San Antonio <strong>and</strong><br />
New Orleans is also convenient at San Antonio.<br />
Commuter <strong>Rail</strong> Connections<br />
The Trinity <strong>Rail</strong>way Express is a regional commuter train service that operates between<br />
Dallas Union Station <strong>and</strong> the Fort Worth ITC. There are 17 weekday departures from Fort<br />
Worth. Reduced service is offered on Saturday <strong>and</strong> no service on Sunday.<br />
Connections between the Heartl<strong>and</strong> Flyer <strong>and</strong> TRE are not coordinated at Fort Worth.<br />
Synchronization between these two services has the potential of increasing ridership for<br />
both services. A close connection would open the Dallas market for the Heartl<strong>and</strong> Flyer.<br />
A layover of 1 hour 12 minutes awaits the southbound Heartl<strong>and</strong> Flyer passenger at Fort<br />
Worth wanting to continue to Dallas or the DFW airport. Moving either the TRE or<br />
Heartl<strong>and</strong> Flyer departures to an earlier time would close this time gap.<br />
Departing Dallas at 3:50 p.m. to connect to the northbound Heartl<strong>and</strong> Flyer at Fort Worth<br />
is a better (but not ideal) situation with only a 41‐minute layover at the ITC. A later<br />
4:20 p.m. from Dallas is also available but leaves only an 11‐minute layover; <strong>and</strong> only a<br />
slight delay in the TRE schedule would result in a missed connection.<br />
Further improvement would be to time the airport shuttle buses to the TRE trains. The<br />
current system has the shuttles running every 15 minutes, regardless of arrivals or departures<br />
of TRE trains.<br />
Intercity Bus Connections<br />
<strong>Oklahoma</strong> is served by two traditional intercity motorcoach operators—Greyhound <strong>and</strong><br />
Jefferson Lines. Several newer, specialty intercity bus systems also serve <strong>Oklahoma</strong>. These<br />
companies in <strong>Oklahoma</strong> are target marketed to the Hispanic community <strong>and</strong> tend not<br />
to use centralized bus stations but rely on curbside pickup at locations within the ethnic<br />
communities. Among these carriers are El Conejo, Americanos, <strong>and</strong> Rapido Chihuahua.<br />
Their schedules <strong>and</strong> stops are published to reach their particular market segment rather<br />
than the general population.<br />
The bus was once the source of commercial transportation service for small rural communities.<br />
Today, intercity buses bypass most small towns <strong>and</strong> place the majority of their<br />
routes along the interstate highway corridors (Figure 12-1). This has rendered most small<br />
town residents completely dependent on the private automobile for regional trips.<br />
12-2<br />
<strong>Oklahoma</strong> <strong>Statewide</strong> <strong>Freight</strong> <strong>and</strong> <strong>Passenger</strong> <strong>Rail</strong> <strong>Plan</strong>
Multimodal Connectivity—<strong>Passenger</strong><br />
Figure 12-1<br />
Intercity bus routes (2011)<br />
Two primary bus routes correspond with Interstate highways 35 <strong>and</strong> 40, the primary<br />
north-south <strong>and</strong> east-west corridors crossing at <strong>Oklahoma</strong> City. A diagonal route crosses<br />
the state from the southwest (originating at Wichita Falls, Texas), through <strong>Oklahoma</strong> City,<br />
Tulsa, <strong>and</strong> Bartlesville, crossing into Kansas en route to Kansas City. Another diagonal<br />
route proceeds from <strong>Oklahoma</strong> City to Tulsa <strong>and</strong> then Joplin Missouri en route to St.<br />
Louis.<br />
In addition to the direct I-35 route from Dallas, a second route enters the state near<br />
Durant, proceeding through McAlester, Muskogee, terminating at Tulsa.<br />
A sampling of intercity bus travel between <strong>Oklahoma</strong> City <strong>and</strong> Tulsa, <strong>and</strong> between<br />
<strong>Oklahoma</strong> City <strong>and</strong> Lawton for an outbound leg on February 16, 2011, <strong>and</strong> returning on<br />
February 17, 2011, revealed:<br />
• <strong>Oklahoma</strong> City–Tulsa—5 published schedules by 2 bus lines (each way)<br />
Shortest trip time 1:40<br />
Lowest roundtrip fare $30.00 (>14 day advance)<br />
• <strong>Oklahoma</strong> City-Lawton—1 published schedule by 1 bus line (each way)<br />
Shortest trip time 1:40<br />
Lowest roundtrip fare $56.00 (>14 day advance)<br />
<strong>Oklahoma</strong> City<br />
At one time, an Amtrak Thruway bus (operated by Jefferson Lines) provided overnight<br />
service to Kansas City. This bus met the train at the <strong>Oklahoma</strong> City station. This service<br />
also connected Tulsa, Bartlesville, <strong>and</strong> other Amtrak trains at Kansas City. This coordinated<br />
service is no longer operated.<br />
Reasonable connections between Kansas City <strong>and</strong> the Heartl<strong>and</strong> Flyer at <strong>Oklahoma</strong> City<br />
can be made with Greyhound’s schedule 0487 that leaves Kansas City at 11:10 p.m. <strong>and</strong><br />
arrives in <strong>Oklahoma</strong> City at 5:30 a.m. (6 hour 20 minute trip time). A return trip departs<br />
May 2012 12-3
Chapter 12<br />
<strong>Oklahoma</strong> City at 12:20 a.m., arriving at Kansas City at 6:40 a.m. (6 hour 20 minute<br />
trip time) on Greyhound schedule 484. The intercity bus station is located about onehalf<br />
mile from the train station <strong>and</strong> passengers would either need to summon a taxi or<br />
walk the distance.<br />
Fort Worth<br />
Greyhound bus lines connect the Fort Worth ITC with Dallas, but the connections are<br />
not convenient to the Heartl<strong>and</strong> Flyer schedule. The next bus to Dallas following arrival<br />
of the Heartl<strong>and</strong> Flyer is at 2:00 p.m. almost 1 hour 30 minutes after the train’s arrival. The<br />
last bus leaving Dallas in time to make the northbound Heartl<strong>and</strong> Flyer departs Dallas at<br />
1:55 p.m., arriving at Fort Worth at 2:35 p.m., 2 hours 50 minutes before scheduled departure.<br />
These schedules preclude a day trip to Dallas.<br />
Other intercity bus connections toward Amarillo, Lubbock, El Paso, <strong>and</strong> Del Rio can be<br />
made at Fort Worth with varying degrees of convenience.<br />
No intercity bus service is purposely coordinated with the Heartl<strong>and</strong> Flyer.<br />
<strong>Plan</strong>ned <strong>Passenger</strong> <strong>Rail</strong> Intermodal Improvements<br />
Opportunities exist to enhance the multi-modal role of the Heartl<strong>and</strong> Flyer with agencies<br />
at both the <strong>Oklahoma</strong> City <strong>and</strong> Fort Worth terminals. Discussion with rural transit<br />
districts to coordinate at intermediate stops in <strong>Oklahoma</strong> may also be worthwhile. Ridership<br />
improvements could be anticipated if intermodal connections were improved <strong>and</strong><br />
publicized. Most of these connections would require extraordinary cooperation between<br />
companies or agencies with diverse goals <strong>and</strong> objectives.<br />
Fort Worth already has its ITC where rail passenger, commuter rail, local transit, <strong>and</strong><br />
intercity bus services come together, although the services are not coordinated.<br />
In <strong>Oklahoma</strong> City, recent emphasis on integrating various modes of public transportation<br />
into the city’s overall transportation matrix has led to several studies <strong>and</strong> initiatives.<br />
The ACOG just completed the Intermodal Transportation Hub Master <strong>Plan</strong>, which focuses<br />
on expansion <strong>and</strong> development of the existing Santa Fe Depot, <strong>and</strong> COTPA is about to<br />
begin The Greater Downtown Circulator AA, which is the first step toward implementing<br />
enhanced commuter transportation options such as light rail. The City of <strong>Oklahoma</strong><br />
City is also in the process of building a modern streetcar line which will serve the central<br />
business district. All these efforts work in conjunction to point toward a greatly enhanced<br />
transportation network in the coming years.<br />
Locating the intermodal hub in <strong>Oklahoma</strong> City will lead to improved market reach as the<br />
hub lays the groundwork for merging pedestrian, bicycle, bus, light rail, <strong>and</strong> heavy rail at<br />
the preferred location of the Santa Fe train station. The Santa Fe station is the home of the<br />
Heartl<strong>and</strong> Flyer. The hub plan includes the capacity necessary for expansion of the Heartl<strong>and</strong><br />
Flyer, introduction of rail service between <strong>Oklahoma</strong> City <strong>and</strong> Tulsa, <strong>and</strong> space for<br />
the introduction of commuter rail lines serving central <strong>Oklahoma</strong>. Exp<strong>and</strong>ed taxi service<br />
<strong>and</strong> parking will also be located at the planned hub to ensure this location is capable of<br />
meeting transportation needs for decades to come.<br />
12-4<br />
<strong>Oklahoma</strong> <strong>Statewide</strong> <strong>Freight</strong> <strong>and</strong> <strong>Passenger</strong> <strong>Rail</strong> <strong>Plan</strong>
Multimodal Connectivity—<strong>Passenger</strong><br />
Tulsa is experiencing a similar effort to prepare the way for exp<strong>and</strong>ed public transportation<br />
needs. Studies carried out by the City of Tulsa <strong>and</strong> the Indian Nations Council of<br />
governments (INCOG) are preparing the way for introduction of an enhanced transportation<br />
network.<br />
All of the plans discussed may be viewed in their entirety on the internet:<br />
• Overall fixed-guideway transit improvements for <strong>Oklahoma</strong> City by COTPA. This<br />
2005 Fixed Guideway Study includes the modern streetcar downtown circulator,<br />
bus rapid transit, <strong>and</strong> commuter rail www.gometro.org/fgp<br />
• Since the 2005 Fixed Guideway Study, further work has been conducted on the<br />
modern streetcar downtown circulator. The most recent information on the ongoing<br />
planning process can be found at www.letstalktransit.com<br />
• In coordination with the COTPA studies on fixed guideway transit in the <strong>Oklahoma</strong><br />
City region, ACOG recently published a comprehensive study for creating<br />
an intermodal hub to connect the wide variety of planned transportation options.<br />
in <strong>Oklahoma</strong> City. This report can be downloaded from www.acogok.org/Newsroom/Downloads11/hubreport.pdf<br />
• In the Tulsa region, the City of Tulsa <strong>and</strong> INCOG released their comprehensive<br />
transit development plan in October 2011. Entitled FastForward, the final report<br />
can be obtained at www.fastforwardplan.org/Final<strong>Plan</strong>.aspx<br />
High-speed Intercity <strong>Passenger</strong> <strong>Rail</strong><br />
ODOT began studying the issue of high speed rail in 1999, <strong>and</strong> it subsequently issued<br />
studies on this topic—the 2001 High Speed <strong>Passenger</strong> <strong>Rail</strong> Feasibility Study <strong>and</strong> the 2002<br />
<strong>Oklahoma</strong> High Speed <strong>Rail</strong> Initiative. <strong>Oklahoma</strong> was also instrumental in obtaining a high<br />
speed rail route designation for the region which led to the founding of the South Central<br />
Corridor designation by the FRA in 2000. This route includes portions of <strong>Oklahoma</strong> <strong>and</strong><br />
Texas, <strong>and</strong> it is one of only 11 designated high-speed rail corridors in the U.S.<br />
With the launch of the FRA HSIPR in 2009, ODOT renewed its efforts to examine the<br />
expansion of passenger rail in the state. It submitted a series of funding applications for<br />
every one of the HSIPR Program’s funding notices beginning in 2009, including an initial<br />
application that sought to fund a new passenger rail line between <strong>Oklahoma</strong> City <strong>and</strong><br />
Tulsa.<br />
Several descriptions <strong>and</strong> definitions of high-speed rail have circulated; recently, FRA has<br />
classified the various levels of intercity passenger rail services as follows:<br />
• High-speed rail express—Trains connecting major population centers 200 to<br />
600 miles apart with few intermediate stops. Top speeds are at least 150 mph on<br />
completely grade-separated <strong>and</strong> dedicated rights-of-way. Some exception to grade<br />
separation <strong>and</strong> dedicated track requirements may be acceptable in terminal areas.<br />
• High-speed rail regional—Trains with relatively frequent service between major<br />
<strong>and</strong> moderate population centers, 100 to 500 miles apart with some intermediate<br />
stops. Top speeds range between 110 <strong>and</strong> 150 mph with some dedicated <strong>and</strong> some<br />
freight-shared tracks. Tracks are grade-separated with terminal area exceptions.<br />
May 2012 12-5
Chapter 12<br />
• Emerging high-speed rail—<strong>Passenger</strong> rail in corridors of 100 to 500 miles that<br />
have strong potential for future high-speed rail (regional or express) development.<br />
Top speeds range from 90 to 110 mph, generally on shared track with advanced<br />
grade-crossing protection or grade separations. This stage is intended to provide<br />
travel options <strong>and</strong> develop a market for rail service.<br />
• Conventional rail—Traditional intercity rail service of more than 100 miles with<br />
as little as 1 to as many as 12 daily frequencies. Served corridors do not necessarily<br />
have potential for future high-speed rail development. Top speeds range from<br />
79 to 90 mph, generally on shared tracks.<br />
FRA has also stated that high-speed intercity passenger rail systems be time-competitive<br />
with air <strong>and</strong> automobile travel.<br />
Through the HSIPR Program, ODOT has individually secured three separate grants to aid<br />
<strong>Oklahoma</strong>’s passenger rail efforts. Grants were awarded to (1) help the state complete its<br />
long-term rail plan, (2) complete the Service Development <strong>Plan</strong> <strong>and</strong> the Environmental<br />
Impact Statement for the rail corridor from <strong>Oklahoma</strong> City to Tulsa, <strong>and</strong> (3) fund infrastructure<br />
improvements at the Santa Fe Station for safer <strong>and</strong> more efficient operation of<br />
the Heartl<strong>and</strong> Flyer.<br />
Regionally since 2009, ODOT, TxDOT, KDOT, along with Missouri DOT have been<br />
working together on HSIPR efforts related to the expansion of passenger rail service.<br />
ODOT <strong>and</strong> KDOT mutually funded <strong>and</strong> completed the <strong>Passenger</strong> <strong>Rail</strong> Service Development<br />
<strong>Plan</strong> 1 in 2011 that looks at options for adding passenger rail lines between Kansas<br />
<strong>and</strong> <strong>Oklahoma</strong>. TxDOT, with input from KDOT <strong>and</strong> ODOT, is about to begin a similar<br />
study for the corridor from <strong>Oklahoma</strong> City to South Texas. This study will also perform<br />
an environmental analysis of the corridor. While HSIPR has served as a vital tool to boost<br />
the State’s passenger rail efforts, other federal programs have led to beneficial rail projects<br />
as well for both existing <strong>and</strong> proposed services.<br />
In 2010, ODOT was awarded a TIGER grant for construction of the I-244 Multimodal<br />
Bridge in Tulsa, which has been designed to carry both intercity passenger rail <strong>and</strong> commuter<br />
rail on the lower deck of this state-of-the-art transportation facility. This project<br />
was one of the first granted in round one of USDOT’s innovative Transportation Infrastructure<br />
Generating Economic Recovery grant program. This project is a keystone to any<br />
new passenger rail service connecting <strong>Oklahoma</strong>’s two largest population centers.<br />
In fall of 2011, ODOT received a <strong>Rail</strong>-Highway Crossing Hazard Elimination Grant to<br />
upgrade three at-grade rail crossings in Ardmore to improve safety <strong>and</strong> operations for the<br />
existing Heartl<strong>and</strong> Flyer passenger rail service.<br />
In terms of additional intercity <strong>and</strong> high speed passenger rail planning efforts, the <strong>Oklahoma</strong><br />
City Intermodal Hub discussed earlier in this section included significant research<br />
to ensure that the hub was capable of supporting added passenger rail capacity should<br />
any of the projects being examined by ODOT, KDOT, <strong>and</strong> TxDOT move forward into<br />
construction. Additionally, ODOT <strong>and</strong> the <strong>Oklahoma</strong> Turnpike Authority have been<br />
examining upcoming large-scale highway projects to ensure they include necessary<br />
1<br />
This document may be viewed on the internet at www.ksdot.org/PDF_Files/PDF-<strong>Passenger</strong>-<strong>Rail</strong>-SDP.pdf.<br />
12-6<br />
<strong>Oklahoma</strong> <strong>Statewide</strong> <strong>Freight</strong> <strong>and</strong> <strong>Passenger</strong> <strong>Rail</strong> <strong>Plan</strong>
Multimodal Connectivity—<strong>Passenger</strong><br />
right-of-way to allow for the inclusion of passenger rail structures should they be needed<br />
in the future.<br />
<strong>Passenger</strong> <strong>Rail</strong> Improvement <strong>and</strong> Investment Act<br />
The passage of PRIIA in 2008 will have effects on the expansion of <strong>Oklahoma</strong>’s passenger<br />
rail system. Section 209 m<strong>and</strong>ates changes to Amtrak’s cost accounting <strong>and</strong> how costs<br />
are shared with the states for their state-sponsored trains. Current trains operated under<br />
the RPSA, Section 403(b) (state-sponsored trains), <strong>and</strong> trains with routes of less than<br />
750 miles, except Northeast Corridor trains, are subject to state support. Only long-distance<br />
trains <strong>and</strong> Northeast Corridor trains remain solely under Amtrak’s responsibility.<br />
States have raised concerns since a state’s expenses will increase under Section 209. While<br />
direct expenses assessed to a state-sponsored service are, to a degree, controllable by the<br />
state, the allocation of shared expenses is not. Shared expenses are those which are averaged<br />
over all Amtrak passenger operations <strong>and</strong> cannot be assigned to any specific train or<br />
route. For example, if a state adds a second train daily, its allocation of the shared expenses<br />
will almost double although the second train will have little effect in increasing the total<br />
shared costs across the system. If states start dropping services because of the cost, the<br />
shared costs will then be spread over a fewer number of trains <strong>and</strong> costs will further<br />
increase.<br />
PRIIA, which was enacted into law on October 16, 2008, required that the new cost<br />
sharing agreement be finalized by October 16, 2010, <strong>and</strong> to take effect 5 years following<br />
enactment. Amtrak <strong>and</strong> the various states, through a state working group, came to an<br />
agreement on the allocation of costs with the lone descent from the State of Indiana. Since<br />
unanimous consent was required, the methodology was placed before the STB for final<br />
decision. On March 13, 2012, the STB ruled that the allocation methodology formulated<br />
by Amtrak <strong>and</strong> the state working group was reasonable.<br />
Sample calculations made based upon cost share methodologies being discussed indicate<br />
that the subsidy provided by <strong>Oklahoma</strong> for Heartl<strong>and</strong> Flyer operation will increase by<br />
approximately 14.5 percent. Amtrak has not yet provided the State of <strong>Oklahoma</strong> with a<br />
final determination of the charges.<br />
Under Section 305 of the Act, Amtrak is directed to establish a committee to define<br />
requirements for the next generation of train equipment, the Next Generation Corridor<br />
Equipment Pool Committee. The committee is charged with the design of the next generation<br />
equipment; the development of technical specifications; preparation of procurement<br />
<strong>and</strong> contracting plans; preparation of funding <strong>and</strong> financing plans; <strong>and</strong> development of<br />
contract <strong>and</strong> service specifications.<br />
The committee was formed on January 13, 2010. Membership is made up of representatives<br />
of Amtrak, FRA, host railroads, equipment manufacturers, interested states, <strong>and</strong><br />
other passenger train operators.<br />
Initial specifications issued have been for (1) double-deck passenger cars, (2) single-level<br />
passenger cars, (3) diesel-electric locomotives, <strong>and</strong> (4) trainsets. The issued specifications<br />
May 2012 12-7
Chapter 12<br />
are for equipment capable of up to 125 mph operations. A specification for Diesel Multiple<br />
Units is currently under development.<br />
Future procurement of passenger train equipment using federal funds will be required to<br />
comply with the 305 specifications <strong>and</strong> process.<br />
In general, the specifications leave adequate flexibility for adaptation to a particular use.<br />
For <strong>Oklahoma</strong>, where serious consideration will be given to passenger trains powered by<br />
compressed natural gas (CNG), the locomotive specification explicitly provides for associated<br />
technologies indicating CNG would be potentially acceptable as a substitute for diesel<br />
fuel.<br />
Tulsa-<strong>Oklahoma</strong> City passenger rail corridor investment study<br />
In 2012, ODOT will initiate a corridor investment study for a passenger line from Tulsa to<br />
<strong>Oklahoma</strong> City. Under FRA guidelines, corridor investment studies incorporate preparation<br />
of a service development plan (SDP) <strong>and</strong> an environmental impact statement (EIS).<br />
Both of these documents are required for further funding of any system construction <strong>and</strong><br />
federal financing.<br />
An SDP analyzes the transportation needs <strong>and</strong> the purposes to be served by the service.<br />
The plan also presents the results from testing various alternatives for performance, ability<br />
to attract riders, <strong>and</strong> generate revenue. Financing of the system as well as the benefits<br />
accrued to both users <strong>and</strong> non-users are also examined. The benefit analysis will also<br />
include an examination of safety improvements associated with developments of a Tulsa-<br />
<strong>Oklahoma</strong> city service. Requirements for an SDP are defined by FRA.<br />
The EIS will examine the impact of system development on the natural, built, <strong>and</strong> cultural<br />
environments. The EIS is also required to examine the resulting effects if the system is not<br />
built. Requirements for an EIS are defined under NEPA.<br />
The 2011 <strong>Oklahoma</strong> Legislature enacted HB 1686, later signed into law by Governor<br />
Fallin. This legislation formed the Eastern Flyer <strong>Passenger</strong> <strong>Rail</strong> Development Taskforce<br />
comprised of 17 members. The taskforce is charged with examining the development of<br />
conventional <strong>and</strong> high-speed passenger rail transportation between Tulsa <strong>and</strong> <strong>Oklahoma</strong><br />
via the use of public-private partnership (P3) formulas. The taskforce is to present its final<br />
report to the Governor <strong>and</strong> state legislative bodies by December 31, 2012. Currently, the<br />
use of P3s is not legally authorized in <strong>Oklahoma</strong>. If a P3 is to finance a Tulsa-<strong>Oklahoma</strong><br />
City system, further legislative action would be required.<br />
ODOT has conducted previous work on the Tulsa-<strong>Oklahoma</strong> City Corridor, including<br />
an incomplete Environmental Assessment in 2009. Almost all of this previous work will<br />
materially contribute to the current effort.<br />
12-8<br />
<strong>Oklahoma</strong> <strong>Statewide</strong> <strong>Freight</strong> <strong>and</strong> <strong>Passenger</strong> <strong>Rail</strong> <strong>Plan</strong>
13. Safety <strong>and</strong> Security<br />
OKLAHOMA<br />
STATEWIDE FREIGHT &<br />
PASSENGER RAIL PLAN<br />
<strong>Oklahoma</strong>’s rail system is protected <strong>and</strong> monitored by both state <strong>and</strong> national entities.<br />
The events of September 11, 2001, led to a wave of security measures aimed at protecting<br />
America’s transportation systems, including both freight <strong>and</strong> passenger rail, <strong>and</strong> a<br />
recent rail tragedy led to the 2008 <strong>Rail</strong> Safety Improvement Act, which greatly enhanced<br />
all of the regulations <strong>and</strong> requirements aimed at ensuring the country’s trains run on safe<br />
infrastructure.<br />
Security<br />
Federal security<br />
As with all states, <strong>Oklahoma</strong> is covered by the federal Department of Homel<strong>and</strong> Security,<br />
which is administered locally by the <strong>Oklahoma</strong> Department of Homel<strong>and</strong> Security, which<br />
was established by state legislation in 2004 (HB 2280). While this department oversees<br />
coordination <strong>and</strong> communication, its on-the-ground enforcement is conducted through<br />
the Transportation Security Administration (TSA) which operates locally through a<br />
central office in <strong>Oklahoma</strong> City. TSA is charged with the safety of our country’s freight<br />
rail system, including the administration of the <strong>Freight</strong> <strong>Rail</strong> Security Grant Program. This<br />
grant program offers funding to railroads for both en-route monitoring projects as well as<br />
bridge hardening projects for high volume rail bridges.<br />
Within the TSA, the Transportation Sector Network Management’s <strong>Freight</strong> <strong>Rail</strong> Security<br />
Division leads the unified national effort to protect <strong>and</strong> secure the nation’s freight rail system.<br />
Efforts are divided into developing practices, protocols, <strong>and</strong> conducting enforcement<br />
to protect freight system infrastructure, monitor access to the infrastructure, <strong>and</strong> guard<br />
potentially hazardous material en route from trip origination to trip termination (www.<br />
tsa.gov/what_we_do/tsnm/freight_rail/index.shtm).<br />
State security<br />
<strong>Oklahoma</strong> Emergency Management <strong>and</strong> all local 911 dispatch centers coordinate regularly<br />
with police <strong>and</strong> fire departments to ensure incoming calls affecting railroads are<br />
h<strong>and</strong>led appropriately. Many local police <strong>and</strong> fire departments conduct annual exercises,<br />
both tabletop <strong>and</strong> field-based, to identify best practices for h<strong>and</strong>ling of railroad accidents<br />
or threats. BNSF <strong>and</strong> UP, <strong>Oklahoma</strong>’s largest railroads, conducted field exercises in 2011<br />
that focused on h<strong>and</strong>ling of hazardous materials accidents.<br />
May 2012 13-1
Chapter 13<br />
Other security<br />
All Class I railroads (BNSF, UP, KCS) maintain police units within <strong>Oklahoma</strong>, <strong>and</strong> these<br />
units include K9 deployments. These units not only offer protection, they also devote their<br />
time to extensive public outreach, education, training, <strong>and</strong> accident investigation. They<br />
interface with local law enforcement <strong>and</strong> respond to rail-involved accidents. All these<br />
organizations maintain Special Response Units trained to deal with hazardous spills <strong>and</strong><br />
catastrophic incidents. Through tabletop exercises <strong>and</strong> live field events, the Class I railroads<br />
interact with in-state law enforcement to ensure coordination <strong>and</strong> communication<br />
remain open.<br />
<strong>Oklahoma</strong>’s Class III railroads fall under the jurisdiction of the FRA <strong>and</strong>, as such, they<br />
are held to the same national st<strong>and</strong>ards as the Class I railroads. While these railroads<br />
do not maintain static police elements, they all participate in annual training <strong>and</strong> work<br />
h<strong>and</strong>-in-h<strong>and</strong> with the FRA <strong>and</strong> the local police to remain vigilant to trespassing, enforce<br />
infrastructure <strong>and</strong> employee st<strong>and</strong>ards <strong>and</strong> reporting, <strong>and</strong> participate in annual inspection<br />
programs aimed at both rail crossings <strong>and</strong> rail infrastructure. As summed up by one<br />
of <strong>Oklahoma</strong>’s short lines, Farmrail’s motto is “Working safely may get old, but so do those<br />
who practice it.”<br />
Safety<br />
Federal safety<br />
FRA is charged with the overall safety of our nation’s rail network, <strong>and</strong> it conducts on-theground<br />
inspection <strong>and</strong> enforcement activities throughout the U.S., including <strong>Oklahoma</strong><br />
(FRA Division 6). With the <strong>Rail</strong> Safety Improvement Act of 2008, FRA was charged with a<br />
redoubling of its mission of promoting safety on America’s rail infrastructure.<br />
The act was a comprehensive effort to address all the areas that affect rail safety by introducing<br />
requirements affecting rail workers, rail infrastructure, rail crossings, rail research,<br />
<strong>and</strong> technology. While it was mostly noted for its requirement concerning the implementation<br />
of PTC, the act has proven to be very far-reaching, <strong>and</strong> ODOT <strong>Rail</strong> Programs<br />
Division has noted a tremendous increase in field inspections being conducted by FRA<br />
across <strong>Oklahoma</strong>. Additionally, our state’s Class III railroads have noted it has led directly<br />
to increased employee safety requirements.<br />
State safety<br />
<strong>Oklahoma</strong> contains some 3,852 public at-grade railroad crossings, making up one of<br />
the state’s most important matters concerning rail safety. By state statute, the <strong>Oklahoma</strong><br />
Corporation Commission (OCC) is charged with overseeing this network. OCC’s <strong>Rail</strong>road<br />
Department monitors the operations of 21 <strong>Oklahoma</strong> railroads for compliance with<br />
state railroad crossing safety regulations. It also investigates <strong>and</strong> makes recommendations<br />
concerning railroad crossing openings, closings, <strong>and</strong> crossing signal upgrades.<br />
In addition to this main function, OCC’s <strong>Rail</strong> Division also h<strong>and</strong>les crossing violations<br />
(such as blockages) <strong>and</strong> the state’s rail fencing ordinance, which requires railroads to<br />
maintain fencing under certain conditions to ensure the safety of adjoining l<strong>and</strong> owners.<br />
13-2<br />
<strong>Oklahoma</strong> <strong>Statewide</strong> <strong>Freight</strong> <strong>and</strong> <strong>Passenger</strong> <strong>Rail</strong> <strong>Plan</strong>
Safety <strong>and</strong> Security<br />
It also oversaw development of the <strong>Oklahoma</strong> <strong>Rail</strong>road Grade Crossing Task Force Final<br />
Report in 1998, which led to codified recommendations for improving <strong>Oklahoma</strong>’s<br />
highway-rail crossing safety as well as guidelines for opening or closing crossings. ODOT’s<br />
<strong>Rail</strong> Programs Division has addressed many of the recommendations made through the<br />
Final Report.<br />
In conjunction with oversight by the OCC, ODOT <strong>Rail</strong> Programs Division administers a<br />
comprehensive <strong>Rail</strong> Crossing Safety Program. It conducts annual ranking <strong>and</strong> field inspections<br />
to ascertain which railroad crossings are most in need of upgrading, <strong>and</strong> it then<br />
works with all of <strong>Oklahoma</strong>’s railroads to enact an annual Crossing Upgrade Project List.<br />
As part of this program, ODOT built <strong>and</strong> maintains a comprehensive crossing database<br />
which is updated monthly to ensure that all the characteristics of <strong>Oklahoma</strong>’s railroad<br />
crossings are available at all times.<br />
The State of <strong>Oklahoma</strong> owns 428 miles of railroad line, the vast majority of which is currently<br />
in operation through various agreements with second-party operators. However,<br />
the State of <strong>Oklahoma</strong> conducts an annual inspection of its rail property through the <strong>Rail</strong><br />
Programs Division within ODOT. The State-Owned Property Section of the <strong>Rail</strong> Programs<br />
Division also administers an annual maintenance program to ensure continuous<br />
safe operation of its rail inventory. This same section coordinates the 8-Year State-Owned<br />
<strong>Rail</strong> Construction <strong>and</strong> Maintenance Work <strong>Plan</strong>, which funds basic maintenance <strong>and</strong><br />
repairs on the state-owned rail system to ensure the track is kept in operating condition.<br />
Earthquake safety<br />
<strong>Rail</strong>roads in <strong>Oklahoma</strong> follow established Earthquake Safety Procedures to ensure immediate<br />
assessment <strong>and</strong> response to any earthquake reported by the U.S. Geological Survey<br />
in Golden, Colorado. Depending on the nature of the earthquake, trains may be ordered<br />
into immediate shutdown until assessment determines the extent of the damage caused.<br />
Quakes rated 5.5 or higher cause immediate shutdown of train operations, while quakes<br />
5.4 or lower cause slow orders to be issued. Following any reported earthquake, qualified<br />
safety inspectors are required to travel the rail infrastructure to identify any possible safety<br />
concerns with the track or bridge structures.<br />
ODOT <strong>Rail</strong> Safety Program<br />
The <strong>Rail</strong> Programs Division Safety Section works with all railroads active in <strong>Oklahoma</strong><br />
<strong>and</strong> the OCC, as well as the counties <strong>and</strong> communities in which the railroads are found, to<br />
actively pursue actions that lead to direct improvements for <strong>Oklahoma</strong>’s citizens as well as<br />
employees of the railroads themselves.<br />
The ODOT <strong>Rail</strong> Safety Program is comprised of three primary focuses—single highpriority<br />
rail crossing locations, statewide minimum rail safety st<strong>and</strong>ards projects, <strong>and</strong><br />
rail corridor safety improvements. These programs aim to either improve on-the-ground<br />
safety conditions or close <strong>and</strong> eliminate highly active railroad crossings that rise to the top<br />
of the annual ranking <strong>and</strong> inspection reports. Through a combination of annual OK.RAIL<br />
crossing database reporting results <strong>and</strong> the field-based diagnostic team inspections, the<br />
ODOT <strong>Rail</strong> Programs Safety Section can identify the crossings most in need of attention.<br />
May 2012 13-3
Chapter 13<br />
Funding<br />
As previously stated, an average of 25 projects per year are instigated for rail crossing<br />
safety improvements. The single most important factor in determining how many projects<br />
can be carried forward is the size of the annual budget for such projects. The funding<br />
for all of the rail safety improvement projects comes from a combination of Section 130<br />
(railroad safety improvement funds) funding set aside through the highway funding bill<br />
current at the time of the project implementation, Hazard Elimination Safety (HES) funding<br />
sources provided through the same segment of highway safety funding, <strong>and</strong> 10 percent<br />
project match requirements that fall on either the railroads or the political entities geographically<br />
bound to the crossing.<br />
Figure 13-1<br />
<strong>Rail</strong> safety<br />
section funding<br />
Figure 13-2<br />
Public-involved crashes<br />
<strong>Oklahoma</strong> receives an average of $3.2 million per year in Section 130 railroad safety<br />
funding that is solely applied to the upgrade or consolidation of at-grade railroad crossing<br />
locations each federal fiscal year. In some years, additional funding is made available<br />
through HES funding sources provided through the same segment of highway safety<br />
funding. It should be noted, however, that HES funds are only utilized on railroad safety<br />
improvements when no other roadway HES improvement projects require its full funding<br />
during that fiscal year. HES averages $5 million per year for rail crossing safety projects.<br />
The only other source for railroad crossing safety improvement funding comes from the<br />
community or railroad through the 10-percent funding match participation required<br />
for the various project types<br />
described below. Occasionally, to<br />
comply with new safety st<strong>and</strong>ards,<br />
additional funding is arranged<br />
to ensure <strong>Oklahoma</strong> remains a<br />
leader in railroad safety compliance<br />
(Figure 13-1).<br />
As shown in Figure 13-2, all of<br />
<strong>Oklahoma</strong>’s safety activities have<br />
significantly improved <strong>Oklahoma</strong>’s<br />
overall rail safety record in regards<br />
to public-involved crashes.<br />
Diagnostic team inspection<br />
The <strong>Rail</strong> Programs Division<br />
Safety Section will utilize the<br />
results of the annual rail crossing<br />
ranking analysis to identify<br />
the crossings most in need of<br />
safety improvements. The Safety<br />
Section will then make arrangements<br />
with both the railroads operating the crossings, as well as the political entities<br />
within whose boundaries the crossings are located, to set up diagnostic team inspections<br />
(on-the-ground field inspections) aimed to further identify the crossings most in need of<br />
13-4<br />
<strong>Oklahoma</strong> <strong>Statewide</strong> <strong>Freight</strong> <strong>and</strong> <strong>Passenger</strong> <strong>Rail</strong> <strong>Plan</strong>
Safety <strong>and</strong> Security<br />
improvement. Annually, the Safety Section will conduct an average of 50 diagnostic team<br />
inspections. Of those 50, approximately 25 will result in projects.<br />
Single priority location safety improvements<br />
The single location safety improvements are selected utilizing the methods previously<br />
described in conjunction with Section 130 requirements <strong>and</strong> the FRA Accident Prediction<br />
Equation. This combination provides the incredibly detailed information necessary to<br />
prioritize locations with the highest potential for hazard, <strong>and</strong> it gives <strong>Oklahoma</strong> one of the<br />
nation’s most sophisticated models for conducting rail crossing hazard analysis calculations.<br />
These projects are paid with 90 percent funding from ODOT <strong>and</strong> 10 percent funding<br />
from the local community or political entity tied geographically to the crossing. The<br />
railroad will occasionally offer to pay the 10 percent match for the community.<br />
<strong>Statewide</strong> minimum requirements program<br />
This program is focused on providing the minimum safety requirements at at-grade crossing<br />
locations as established nationally <strong>and</strong> accounted for in the Manual on Uniform Traffic<br />
Control Devices. The types of improvements included in this program are crossbuck signs,<br />
advanced warning signs, AARDOT inventory number postings, supplemental advanced<br />
warning signs where applicable <strong>and</strong> advanced warning pavement markings at locations<br />
where the surface will facilitate the life cycle of the pavement marking proposed for placement.<br />
ODOT has previously completed several crossbuck upgrade projects on rail lines<br />
throughout the State <strong>and</strong> completed an Advanced Warning Sign <strong>and</strong> Pavement Marking<br />
program in the late 1980s for each local jurisdiction throughout the State who would sign<br />
a corresponding maintenance agreement.<br />
The most recent compliance program under <strong>Statewide</strong> Minimum Requirements involves<br />
the installation of YIELD or STOP signs at all passive railroad crossings where crossbucks<br />
are present. FHWA established a 10-year compliance period (until December 31, 2019) in<br />
the 2009 MUTCD for the installation of Crossbuck Assemblies at passive grade crossings.<br />
ODOT is currently working on the installations for this compliance. They have established<br />
a 50/50 funding split with the railroads.<br />
Corridor safety improvements<br />
When a community holds a section of track with multiple crossing locations, it becomes<br />
eligible to participate in a “Corridor <strong>Rail</strong> Crossing Improvement Project.” This project<br />
aims to eliminate hazardous <strong>and</strong> redundant railroad crossings by targeting closures as<br />
well as improvements. If a community holds 4 rail crossings, <strong>and</strong> it is willing to allow for<br />
at least 1 of these crossings to be permanently closed, it will not be responsible for any<br />
project costs. This can also be done on a 6+2 equation, where 6 crossings are improved<br />
<strong>and</strong> 2 crossings are closed. ODOT pays 90 percent, while the railroad pays the remaining<br />
10 percent. These projects result in the greatest potential rail safety improvements.<br />
May 2012 13-5
Chapter 13<br />
Corridor history<br />
• Corridor projects: 42<br />
• Closures: 52<br />
• Pending Corridor projects: 1 with 1 closure<br />
2000–2011: A decade of success<br />
Over the past decade, approximately 175 safety projects utilizing approximately<br />
$52,500,000 has been completed. These projects are comprised of surface improvements,<br />
signal improvements, signage/ marking improvements, <strong>and</strong> closures. As discussed previously,<br />
the projects may take place as single-location projects or as corridor projects.<br />
For the current year, FY2011, ODOT <strong>Rail</strong> Programs Division Safety Section has 25<br />
commissioned projects <strong>and</strong> 8 projects pending. Within the 8 pending, 1 is a major corridor<br />
project, 3 are signal upgrades, <strong>and</strong> one is a closure (Duncan). For the next fiscal<br />
year, FY2012, we currently have 25 additional scheduled diagnostic team inspections to<br />
complete.<br />
Other Safety <strong>and</strong> Security<br />
Heartl<strong>and</strong> Flyer passenger rail corridor<br />
With the recent award of an FY 2011 High-Speed <strong>Rail</strong>-Highway Crossing Hazard Elimination<br />
Grant, ODOT has nearly completed a 100-percent active crossing protection program<br />
for the corridor from <strong>Oklahoma</strong> City to the <strong>Oklahoma</strong>-Texas state line along the route<br />
traveled by the Heartl<strong>and</strong> Flyer. This line is also a segment of the nationally designated<br />
South Central High-Speed <strong>Rail</strong> Corridor. Currently, only three unprotected crossings<br />
remain.<br />
Positive train control<br />
Recent federal legislation (PRIIA 2008) m<strong>and</strong>ates all railroads implement PTC on rail<br />
operations deemed as critical safety corridors. All lines with passenger rail operations<br />
are so designated. Regarding PTC, <strong>Oklahoma</strong>’s only passenger rail service (the Heartl<strong>and</strong><br />
Flyer) runs on a BNSF corridor that has already been outfitted with a PTC system. BNSF<br />
has already conducted extensive testing of the system, <strong>and</strong> the Heartl<strong>and</strong> Flyer route is at<br />
the forefront of this new federal requirement.<br />
Additional public <strong>and</strong> private entities<br />
As with the Class I railroads, Amtrak maintains its own police units that the State of <strong>Oklahoma</strong><br />
participates in supporting annually by way of the Heartl<strong>and</strong> Flyer Annual Operating<br />
Agreement. Amtrak, in conjunction with TSA, has developed a nationwide network of<br />
agents <strong>and</strong> officials charged with ensuring that Amtrak’s passenger rail operation offers<br />
safe travel to its customers. It focuses on the luggage <strong>and</strong> people who travel with them as<br />
well as the railroad equipment. Amtrak maintains all FRA st<strong>and</strong>ards as well as enforces its<br />
own policies <strong>and</strong> programs geared to ensure safe passage on its routes.<br />
13-6<br />
<strong>Oklahoma</strong> <strong>Statewide</strong> <strong>Freight</strong> <strong>and</strong> <strong>Passenger</strong> <strong>Rail</strong> <strong>Plan</strong>
Operation lifesaver<br />
Safety <strong>and</strong> Security<br />
<strong>Oklahoma</strong> Operation Lifesaver is a nonprofit, public safety education program committed<br />
to preventing <strong>and</strong> reducing collisions, death, <strong>and</strong> injuries at highway-rail grade crossings<br />
<strong>and</strong> on railroad rights-of-way. It has a wide variety of partners, including federal, state,<br />
<strong>and</strong> local government agencies, highway safety <strong>and</strong> transportation organizations, <strong>and</strong> the<br />
nation’s railroads. <strong>Oklahoma</strong> Operation Lifesaver was established in 1979 <strong>and</strong> is a member<br />
of the national organization, Operation Lifesaver, Inc., which is headquartered in<br />
Alex<strong>and</strong>ria, Virginia. Its education efforts include increasing the public’s awareness of the<br />
dangers at highway-rail grade crossings <strong>and</strong> railroad rights-of-way through free Operation<br />
Lifesaver safety presentations made by trained, certified volunteers. The program strives<br />
to improve driver <strong>and</strong> pedestrian behavior at highway-rail grade crossings by encouraging<br />
compliance with traffic laws relating to crossing signs <strong>and</strong> signals. In conjunction with<br />
its education program, <strong>Oklahoma</strong> Operation Lifesaver emphasizes the enforcement of<br />
existing traffic <strong>and</strong> trespassing laws, consolidation <strong>and</strong> closure of redundant highway-rail<br />
grade crossings, <strong>and</strong> engineering improvements, including the installation <strong>and</strong> upgrade of<br />
crossing warning devices <strong>and</strong> signs.<br />
Additional needs<br />
One area that has been of concern to ODOT is the timely reporting of accidents to<br />
ODOT’s <strong>Rail</strong> Programs Division. While the Division maintains detailed accident records,<br />
including accident reports <strong>and</strong> investigations, it has shared a concern with railroad operators<br />
of the need to receive immediate notification when incidents or accidents occur that<br />
involve injury, death, or catastrophe so that it may fulfill its role as a public information<br />
source through ODOT. The State of New York, for instance, by law requires all railroads to<br />
notify the state immediately upon clear indication of a rail-involved accident or incident.<br />
In addition to accident notification, ODOT would benefit from the railroads including it<br />
in table-top <strong>and</strong> field-based training exercises carried out across the state with local jurisdictions.<br />
ODOT could coordinate with its field divisions to grow <strong>and</strong> exp<strong>and</strong> its rail safety<br />
education through participation <strong>and</strong> observation of rail safety training events routinely<br />
conducted by operators such as BNSF, UP, <strong>and</strong> KCS.<br />
May 2012 13-7
14. ODOT <strong>Statewide</strong> <strong>Freight</strong> <strong>and</strong><br />
<strong>Passenger</strong> <strong>Rail</strong> <strong>Plan</strong> Vision, Goals,<br />
<strong>and</strong> Objectives<br />
OKLAHOMA<br />
STATEWIDE FREIGHT &<br />
PASSENGER RAIL PLAN<br />
ODOT’s passenger <strong>and</strong> freight rail network is an integral component of a broader multimodal<br />
network <strong>and</strong> an even larger continental <strong>and</strong> global transportation system. Development<br />
of an implementable long-term rail transportation plan involved public <strong>and</strong><br />
private sector stakeholders representing a variety of interests. They included rail operators,<br />
shippers, interest groups, residents, <strong>and</strong> government planning partners. To ensure that<br />
the statewide rail plan is part of the broader transportation planning effort in the state, its<br />
development was informed by other existing plans as well as current planning efforts in<br />
the state. At the same time, the plan is guided by the federal m<strong>and</strong>ate provided by PRIIA,<br />
which stipulates the requirements of<br />
state rail plans.<br />
The vision, goals, <strong>and</strong> objectives of<br />
<strong>Oklahoma</strong>’s rail system have been developed<br />
in view of its role in domestic <strong>and</strong><br />
internal commerce <strong>and</strong> in recognition<br />
of the important role rail transportation<br />
plays in improving the state’s economy<br />
<strong>and</strong> environment. With the vision statement<br />
as the guiding principle, five goals<br />
of the state’s rail transportation system<br />
have been identified <strong>and</strong> used to shape<br />
the state rail plan, serving as broad statements<br />
of purpose for the rail transportation<br />
system. Each goal was translated<br />
into specific objectives, which serve as<br />
targeted, measurable, intended outcomes<br />
for rail transportation in the State.<br />
<strong>Oklahoma</strong> <strong>Rail</strong> Vision<br />
Through coordinated efforts aimed at<br />
developing a dynamic <strong>and</strong> responsive<br />
statewide rail system that provides<br />
for the safe, effective <strong>and</strong> environmentally<br />
sound movement of both<br />
people <strong>and</strong> goods, <strong>Oklahoma</strong> seeks<br />
to exp<strong>and</strong> its economy <strong>and</strong> meet the<br />
needs of its future growth while also<br />
aligning its rail system with regional<br />
<strong>and</strong> national goals when appropriate.<br />
Like many states, <strong>Oklahoma</strong> faces the<br />
challenge of funding an ever-growing<br />
need for infrastructure maintenance as well as improvement. Both will result in measurable<br />
regional economic <strong>and</strong> environmental benefits. The challenge, however, is to allocate<br />
scarce financial resources to their highest <strong>and</strong> best use. Taken together, the vision, goals,<br />
<strong>and</strong> objectives reflect the desires of rail stakeholders <strong>and</strong> constituents to preserve <strong>and</strong><br />
enhance the system, while recognizing the challenges <strong>and</strong> opportunities that exist in a rapidly<br />
changing economy.<br />
May 2012 14-1
Chapter 14<br />
Vision<br />
Goals <strong>and</strong> Objectives<br />
1. Further develop <strong>and</strong> exp<strong>and</strong> rail-based economic activity across <strong>Oklahoma</strong> <strong>and</strong><br />
the region.<br />
Objectives<br />
• A rail network that enhances <strong>Oklahoma</strong>’s economic competitiveness by maximizing<br />
efficiency <strong>and</strong> geographic reach of the freight rail system.<br />
• A clear underst<strong>and</strong>ing of the rail industry’s role in promoting <strong>Oklahoma</strong>’s economic<br />
viability <strong>and</strong> supporting emerging industries that rely on rail transportation.<br />
• Exp<strong>and</strong>ed rail capacity to promote <strong>and</strong> meet projected growth in freight <strong>and</strong> passenger<br />
dem<strong>and</strong>.<br />
• A rail capital development program aimed at increasing capacity <strong>and</strong> connecting businesses<br />
to the rail network.<br />
2. Maintain <strong>and</strong> develop a dynamic rail system that provides safe, efficient, <strong>and</strong><br />
reliable movement of people.<br />
Objectives<br />
• A safe <strong>and</strong> secure rail system that employs advances in rail technology to protect both<br />
people <strong>and</strong> assets.<br />
• <strong>Rail</strong> as part of a multimodal transportation vision <strong>and</strong> comprehensive funding strategy<br />
throughout <strong>Oklahoma</strong>.<br />
• Creation of a cohesive door-to-door passenger network that grows with <strong>Oklahoma</strong>.<br />
• Re-establishment of passenger rail service where supported by dem<strong>and</strong>.<br />
• Exp<strong>and</strong>ed metropolitan area transportation options available for residents <strong>and</strong> visitors.<br />
• Continued use of federal policy-compliant project development procedures to advance<br />
viable passenger rail concepts.<br />
• Integration of <strong>Oklahoma</strong>’s major population centers into the national passenger rail<br />
system.<br />
3. Maintain <strong>and</strong> develop a dynamic rail system that provides safe, efficient, <strong>and</strong><br />
environmentally sound movement of goods.<br />
Objectives<br />
• A safe <strong>and</strong> secure rail system that employs advances in rail technology to protect both<br />
people <strong>and</strong> assets.<br />
• Compliance with all Federal <strong>Rail</strong>road Administration policies, procedures, <strong>and</strong><br />
regulations.<br />
• Maintenance of the existing infrastructure to ensure reliable freight service.<br />
14-2<br />
<strong>Oklahoma</strong> <strong>Statewide</strong> <strong>Freight</strong> <strong>and</strong> <strong>Passenger</strong> <strong>Rail</strong> <strong>Plan</strong>
Safety <strong>and</strong> Security<br />
• Cost-effective programs to preserve the existing freight rail network <strong>and</strong> to meet<br />
expected future rail network capacity needs, including addressing potential chokepoints<br />
in the system.<br />
• Upgrading of rail infrastructure as required to permit universal accommodation of<br />
higher capacity rail rolling stock <strong>and</strong> higher operating densities.<br />
• Increased share of <strong>Oklahoma</strong> freight traffic through improved highway-rail <strong>and</strong><br />
water-rail intermodal connections as well as improved rail connectivity to <strong>Oklahoma</strong>’s<br />
industries.<br />
• The capability to support changes in the supply chain, such as the containerization<br />
of agriculture crops <strong>and</strong> the exp<strong>and</strong>ed use of rail to transport petroleum products.<br />
4. Identify, develop, <strong>and</strong> secure funding that promotes <strong>and</strong> enhances rail system<br />
investment.<br />
Objectives<br />
• Stable <strong>and</strong> sufficient funding secured for a program of rail investments to support<br />
operating, constructing, <strong>and</strong> maintaining <strong>Oklahoma</strong>’s rail network.<br />
• Statutory authority to enable the use of innovative funding sources, such as publicprivate<br />
partnerships.<br />
• Additional funding for high-priority grade crossing improvements that protect the<br />
public <strong>and</strong> enhance rail service.<br />
5. Promote the underst<strong>and</strong>ing of both rail service as a cost-effective, safe,<br />
secure, environmentally sound, <strong>and</strong> energy efficient means of improving<br />
freight <strong>and</strong> passenger mobility, as well as its importance to <strong>Oklahoma</strong>’s<br />
economy.<br />
Objectives<br />
• Effective safety <strong>and</strong> security partnerships with passenger <strong>and</strong> freight railroads.<br />
• An open door to <strong>Oklahoma</strong> Department of Transportation’s planning process <strong>and</strong><br />
transparency in communicating with <strong>and</strong> educating the public.<br />
• An appreciation of short <strong>and</strong> longer-term rail-related benefits by elected officials,<br />
the business community, <strong>and</strong> the public.<br />
• An expedited decision-making process to advance beneficial rail projects.<br />
• An underst<strong>and</strong>ing by elected officials, the business community, <strong>and</strong> the public of<br />
where <strong>and</strong> when passenger rail service is a viable transport alternative.<br />
• An awareness of agriculture-related rail issues in <strong>Oklahoma</strong> by elected officials, the<br />
business community, <strong>and</strong> the public.<br />
• Continuing education on the benefits of rail transportation <strong>and</strong> the opportunities to<br />
integrate rail <strong>and</strong> other modes of transportation.<br />
May 2012 14-3
15. Current <strong>Rail</strong> Development Activities<br />
OKLAHOMA<br />
STATEWIDE FREIGHT &<br />
PASSENGER RAIL PLAN<br />
The State of <strong>Oklahoma</strong>, through ODOT <strong>and</strong> agency partners, is supporting several rail<br />
development <strong>and</strong> improvement projects. The projects encompass freight <strong>and</strong> passenger<br />
services both locally <strong>and</strong> regionally.<br />
<strong>Oklahoma</strong> <strong>Statewide</strong> <strong>Freight</strong> <strong>and</strong> <strong>Passenger</strong> <strong>Rail</strong> <strong>Plan</strong><br />
The development of this state rail plan is an initiative funded through a FY 2010 FRA<br />
HSIPR state rail planning grant. Because of the federal m<strong>and</strong>ate to develop state rail plans,<br />
HSIPR program funds have been made available to the states.<br />
I-244 Multimodal Bridge in Tulsa<br />
The ODOT received a TIGER grant to fund this state-of-the-art transportation facility,<br />
which is a double-deck structure carrying auto <strong>and</strong> truck traffic on the top deck with<br />
intercity passenger rail <strong>and</strong> commuter rail on the lower deck. It also has a pedestrian <strong>and</strong><br />
bike facility connecting downtown Tulsa to its West Bank.<br />
Service Development <strong>Plan</strong> for Exp<strong>and</strong>ed <strong>Passenger</strong> <strong>Rail</strong><br />
Service: Fort Worth–<strong>Oklahoma</strong> City–Kansas City<br />
ODOT is participating in the preparation of a passenger rail service development plan<br />
evaluating the investment required to exp<strong>and</strong> passenger rail service in the region. Two<br />
alternatives are under consideration—extension of existing Heartl<strong>and</strong> Flyer service from<br />
<strong>Oklahoma</strong> City to Newton, Kansas, to connect with Amtrak’s Los Angeles–Chicago Southwest<br />
Chief <strong>and</strong> the introduction of a new train operating between Fort Worth <strong>and</strong> Kansas<br />
City. The latter would provide additional train service between Fort Worth <strong>and</strong> <strong>Oklahoma</strong><br />
City. The project is jointly funded by KDOT, ODOT, <strong>and</strong> FRA.<br />
Tulsa–<strong>Oklahoma</strong> City High-Speed <strong>Rail</strong> Corridor<br />
Investment <strong>Plan</strong><br />
With funding received from an FY 2010 FRA HSIPR planning grant, ODOT will be developing<br />
a federally m<strong>and</strong>ated High-Speed <strong>Rail</strong> Corridor Investment <strong>Plan</strong> for a new service<br />
between Tulsa <strong>and</strong> <strong>Oklahoma</strong> City. The investment plan will comprise an updated service<br />
development plan <strong>and</strong> documentation required to comply with NEPA requirements. At<br />
the conclusion of the plan development, the project can enter the design phase.<br />
May 2012 15-1
Chapter 15<br />
South Central HSIPR Corridor Study: <strong>Oklahoma</strong> City to<br />
South Texas<br />
An FY 2010 FRA HSIPR planning grant was awarded to TxDOT to develop a plan for<br />
high-speed passenger rail service from the Mexican border to <strong>Oklahoma</strong> City with the<br />
direction to examine initially the Fort Worth–<strong>Oklahoma</strong> City segment. TxDOT recently<br />
issued a request for consulting services.<br />
<strong>Oklahoma</strong> City Amtrak Station Access Improvement<br />
ODOT is improving access to the Santa Fe <strong>Rail</strong>road station in downtown <strong>Oklahoma</strong> City.<br />
The project funded through a FY 2010 FRA HSIPR construction grant will include the<br />
installation of a power switch <strong>and</strong> new rail line to provide the Heartl<strong>and</strong> Flyer in-<strong>and</strong>-out<br />
access to the station.<br />
Great Plains <strong>Freight</strong> <strong>Rail</strong> Project<br />
KDOT, on behalf of SKOL, received TIGER funding for the construction of a new yard<br />
<strong>and</strong> rail line improvements, which will permit the operation of heavier freight cars at<br />
higher speeds. Half of the project is located in <strong>Oklahoma</strong>.<br />
<strong>Oklahoma</strong> Rolling Pipeline <strong>Freight</strong> <strong>Rail</strong> Upgrade Project<br />
ODOT received TIGER III funding for upgrade of the rail line between Clinton <strong>and</strong> Sayre<br />
to meet the growing needs of western <strong>Oklahoma</strong> <strong>and</strong>, particularly, the energy sector. The<br />
improvements will exp<strong>and</strong> the capacity of the line <strong>and</strong> permit higher operating speeds for<br />
trains serving the Anadarko Basin oil fields.<br />
15-2<br />
<strong>Oklahoma</strong> <strong>Statewide</strong> <strong>Freight</strong> <strong>and</strong> <strong>Passenger</strong> <strong>Rail</strong> <strong>Plan</strong>
16. Strategic Initiatives<br />
OKLAHOMA<br />
STATEWIDE FREIGHT &<br />
PASSENGER RAIL PLAN<br />
The outreach meetings <strong>and</strong> individual stakeholder interviews identified strategic initiatives<br />
that should be considered by ODOT as it moves forward with its rail programs.<br />
These initiatives fell into several categories:<br />
• Communication <strong>and</strong> education<br />
• Economic development<br />
• Funding<br />
• Infrastructure/system improvements<br />
• Legislative<br />
• <strong>Passenger</strong> rail service<br />
• Safety<br />
• Studies<br />
The following initiatives, drawn from those recommended by stakeholders, are designed<br />
to move ODOT from a position of preserving rail service to one of rail industry growth in<br />
the state. As with many states, <strong>Oklahoma</strong> is facing several strategic challenges:<br />
• The need to support <strong>and</strong> promote rational growth of the short line industry <strong>and</strong><br />
passenger rail service in the state<br />
• The need to find new sources of funds to replace lease revenues lost as rail lines<br />
owned by the state revert to the rail operators as part of the lease-purchase<br />
program<br />
• The need to exploit the economic <strong>and</strong> public benefits of rail transportation<br />
• The need to inform the public of the benefits of rail transportation<br />
Communication <strong>and</strong> Education<br />
Continue developing effective relationships between ODOT <strong>and</strong> the<br />
freight railroads<br />
In order to maximize the efficiency of the state’s rail network <strong>and</strong> the public <strong>and</strong> private<br />
investments made in that network, ODOT will continue to have regular <strong>and</strong> effective<br />
dialogue <strong>and</strong> communication with the railroads through the <strong>Oklahoma</strong> <strong>Rail</strong>road Association<br />
<strong>and</strong> other venues. The railroads have requested development of a mutual forum to<br />
keep them current on proposed future highway projects with rail infrastructure impacts.<br />
This cooperative effort would enhance planning efforts, <strong>and</strong> it would lead to more efficient<br />
project coordination.<br />
May 2012 16-1
Chapter 16<br />
Use the State <strong>Rail</strong> <strong>Plan</strong> as a platform for the continuation of a rail<br />
information program<br />
As ODOT continues to be active in rail planning <strong>and</strong> other related programs, the need<br />
to educate the public on the benefits of rail transportation will increase. General public<br />
education information campaigns should build off the plan.<br />
Better inform the public on rail policies <strong>and</strong> requirements<br />
The public would benefit from a better underst<strong>and</strong>ing of ODOT activities <strong>and</strong> programs,<br />
such as the rail line acquisition program <strong>and</strong> its ongoing passenger rail service<br />
development.<br />
Incorporate passenger rail stations into the <strong>Oklahoma</strong> official state travel map<br />
Add notations for passenger rail station locations to the state’s travel map that is distributed<br />
to motorists <strong>and</strong> other travelers.<br />
Initiate a state rail workshop<br />
Convene a workshop on a recurring basis with relevant state agencies, such as the Departments<br />
of Transportation, Agriculture, <strong>and</strong> Commerce along with representatives of<br />
the MPOs, the rail industry, <strong>and</strong> major shippers to discuss current rail issues affecting<br />
<strong>Oklahoma</strong>.<br />
Establish regular rail forums between shippers <strong>and</strong> railroads<br />
Improving relationships <strong>and</strong> communication between railroads <strong>and</strong> shippers would<br />
enhance the economy of the state. Such events would allow participants to better underst<strong>and</strong><br />
opportunities <strong>and</strong> issues related to existing <strong>and</strong> emerging markets as well as rail<br />
service issues <strong>and</strong> infrastructure needs faced by both the railroads <strong>and</strong> the shippers.<br />
Continue partnering with adjacent states regarding rail passenger service<br />
Continue to meet on a regular basis with Kansas, Texas, <strong>and</strong> Missouri DOTs, a practice<br />
started with the preparation of the Fort Worth–<strong>Oklahoma</strong> City–Kansas City passenger<br />
rail service development plan, to create a regional base of support to enhance existing rail<br />
passenger services <strong>and</strong> create a regional passenger rail vision for the future which includes<br />
regional extensions of existing rail passenger services.<br />
Economic Development<br />
Integrate rail into <strong>Oklahoma</strong>’s economic development process<br />
ODOT should coordinate with the Governor’s Task Force on Economic Development <strong>and</strong><br />
Job Creation in regard to implementing the rail-related recommendations in that Task<br />
Force’s report entitled Bold Ideas for <strong>Oklahoma</strong>.<br />
16-2<br />
<strong>Oklahoma</strong> <strong>Statewide</strong> <strong>Freight</strong> <strong>and</strong> <strong>Passenger</strong> <strong>Rail</strong> <strong>Plan</strong>
Leverage the railroads connections with Mexico to stimulate business<br />
with Mexico<br />
Strategic Initiatives<br />
NAFTA <strong>and</strong> subsequent related Congressional legislation, has opened up numerous new<br />
business opportunities with Mexico. <strong>Oklahoma</strong> should explore the potential for creating<br />
new business alliances with Mexico that would benefit both <strong>Oklahoma</strong> shippers <strong>and</strong><br />
producers but also its short Line <strong>and</strong> Class l railroads.<br />
Promote rail-served industries, industrial parks, <strong>and</strong> transload facilities at<br />
strategic locations<br />
The need to establish more rail-served industrial parks was a theme at the workshop/open<br />
house meetings around the state. They would not only generate new rail business for the<br />
short line <strong>and</strong> Class l railroads but would also generate additional economic development<br />
for <strong>Oklahoma</strong>’s economy.<br />
• ODOT <strong>and</strong> the Department of Commerce should conduct a workshop on freight<br />
rail transportation <strong>and</strong> invite short line <strong>and</strong> Class l railroads, regional economic<br />
development agencies, <strong>Oklahoma</strong> Chamber of Commerce.<br />
• Should funding be available, the ODOT railroad assistance program should be<br />
exp<strong>and</strong>ed to include transload <strong>and</strong> transfer facilities.<br />
Integrate l<strong>and</strong> use <strong>and</strong> transportation planning<br />
ODOT should provide leadership in the integration of freight <strong>and</strong> passenger transportation<br />
<strong>and</strong> l<strong>and</strong> use planning at local, regional, <strong>and</strong> state levels with both governments <strong>and</strong><br />
businesses.<br />
Establish a trackside l<strong>and</strong> preservation education program<br />
ODOT <strong>and</strong> the Department of Commerce would work with local economic development<br />
agencies to preserve trackside for rail-dependent industrial use.<br />
Establish industrial rail access program<br />
There is a need for funding for rail spurs <strong>and</strong> industrial rail leads connecting <strong>Oklahoma</strong>’s<br />
industrial properties to the <strong>Oklahoma</strong> rail network. The state should explore the creation<br />
of an industrial rail access program <strong>and</strong> sources of funding for the program.<br />
Monitor <strong>and</strong> promote opportunities for development of an intermodal terminal<br />
in <strong>Oklahoma</strong><br />
Although conditions today are not favorable to the development of an intermodal container<br />
terminal in the state, the future may be different. The recent interest by the railroads<br />
in short haul domestic containerization may provide a future opportunity for a new terminal<br />
strategically located in <strong>Oklahoma</strong>.<br />
May 2012 16-3
Chapter 16<br />
Partner with the Waterways Advisory Board to implement recommendations of<br />
<strong>Oklahoma</strong>’s Intermodal Capacity Study <strong>and</strong> to encourage increased transportation<br />
of commodities by both rail <strong>and</strong> water<br />
Develop strategies with the ODOT Waterways Advisory Board <strong>and</strong> the ports at Catoosa<br />
<strong>and</strong> Muskogee to increase transportation of commodities <strong>and</strong> goods by rail <strong>and</strong> waterway,<br />
to increase access to both waterways <strong>and</strong> railways, <strong>and</strong> to take advantage of the efficiencies<br />
of these two modes of transportation <strong>and</strong> relieve <strong>Oklahoma</strong>’s highways of unnecessary<br />
heavy truck traffic.<br />
Funding<br />
Explore <strong>and</strong> analyze innovative funding <strong>and</strong> financing alternatives, including<br />
public-private partnerships<br />
The transfer of state-owned rail properties to rail operators as part of the state’s saleleaseback<br />
program will reduce revenues for rail improvements. ODOT will need to assess<br />
current approaches to infrastructure funding to compensate for reduced availability of<br />
resources.<br />
Continue to pursue regional approaches to secure federal rail-related funding<br />
ODOT should explore multi-state regional initiatives for obtaining federal funding for<br />
both freight <strong>and</strong> passenger rail-related projects.<br />
Explore development of innovative local funding mechanisms, such as the port<br />
authority concept<br />
<strong>Oklahoma</strong> should explore what is required for the creation of local authorities, such as<br />
Kansas Port Authorities, that can issue bonds for rail development.<br />
Educate stakeholders on existing rail funding programs <strong>and</strong> processes<br />
Educate rail stakeholders on the processes for applying for rail-related grants/loans,<br />
including TIGER, Community Development Block Grants, <strong>and</strong> Section 108 loans.<br />
Infrastructure <strong>and</strong> System Improvements<br />
Support increasing freight rail speeds where supported by business<br />
Increasing permitted speeds on short lines serves to both increase capacity <strong>and</strong> reduce<br />
operating costs. This should be done where warranted to support traffic growth.<br />
Continue to support the development of emerging industries to strengthen<br />
<strong>Oklahoma</strong>’s economy<br />
Provide the capacity in the state’s rail network to allow for the use of the rail network in<br />
the development of emerging industries, such as the Bakken Shale <strong>and</strong> wind energy.<br />
16-4<br />
<strong>Oklahoma</strong> <strong>Statewide</strong> <strong>Freight</strong> <strong>and</strong> <strong>Passenger</strong> <strong>Rail</strong> <strong>Plan</strong>
Strategic Initiatives<br />
Support the upgrading short line rail lines to accommodate 286,000-pound<br />
rail cars<br />
As with most states, the short line railroad industry in <strong>Oklahoma</strong> faces the issue of keeping<br />
its infrastructure on par with its larger counterparts, the Class I railroads. Currently,<br />
the Class I railroads maintain a minimum st<strong>and</strong>ardized railcar weighing 286,000 pounds<br />
loaded (286 cars). <strong>Rail</strong>roads with bridges, structures, or rail that are not rated for these<br />
heavier loads are limited to shipping 263,000-pound rail cars or loading 286,000-pound<br />
cars 23,000 pounds short of their full capacity. This can place limits on their ability to<br />
interchange with Class I railroads <strong>and</strong> to maximize their business potential. It is important<br />
that <strong>Oklahoma</strong>’s short line industry be able to maintain its infrastructure at the heavier<br />
286,000 classification.<br />
Although the short lines provided ODOT with basic 286,000 infrastructure data during<br />
the development of the <strong>Rail</strong> <strong>Plan</strong>, additional analysis is needed in <strong>Oklahoma</strong> to fully<br />
determine the costs <strong>and</strong> magnitude of the issue the short lines face in bringing all of their<br />
lines up to the 286,000-pound st<strong>and</strong>ard.<br />
Create a rail corridor preservation program<br />
Continue to preserve ab<strong>and</strong>oned rail lines, even in those instances where the tracks have<br />
been removed or salvaged for future rail use.<br />
Legislative<br />
Continue to promote legislative action to enable public-private<br />
partnerships opportunities<br />
Current state law in <strong>Oklahoma</strong> does not permit public funding in private corporations<br />
or businesses. Legislative changes need to continue to be pursued <strong>and</strong> implemented to<br />
provide other funding alternatives.<br />
<strong>Passenger</strong> <strong>Rail</strong> Service<br />
Continue supporting <strong>Oklahoma</strong> City as a multimodal hub<br />
Facilitate institutional arrangements that would enable <strong>Oklahoma</strong> City to become a multimodal<br />
passenger rail hub—Heartl<strong>and</strong> Flyer, additional proposed intercity rail services,<br />
new proposed commuter rail services, proposed high-speed rail, intercity bus service, <strong>and</strong><br />
local transit services serving the <strong>Oklahoma</strong> City metropolitan area.<br />
Develop strategies with the <strong>Oklahoma</strong> City area MPO to enhance the connectivity<br />
of passenger rail options<br />
Strategies should address the development of selected commuter rail lines which would<br />
include linking the downtown area to the Will Rogers World Airport.<br />
May 2012 16-5
Chapter 16<br />
Evaluate potential enhancements to existing passenger rail services on an<br />
ongoing basis<br />
Evaluate the potential for rail passenger operators other than Amtrak for the Heartl<strong>and</strong><br />
Flyer <strong>and</strong> other new proposed rail passenger services. Also, evaluate potential state ownership<br />
of rail passenger equipment.<br />
Safety<br />
Partner with the railroads to enhance safety<br />
Specific elements of this effort could include developing plans to contact ODOT in the<br />
event of an emergency <strong>and</strong> conducting Emergency Management System field training.<br />
Studies<br />
Periodically, perform an analysis of <strong>Oklahoma</strong>’s rail network to identify future<br />
connectivity gaps based on changing freight patterns<br />
Periodically re-evaluate the rail freight network in <strong>Oklahoma</strong> to identify potential gaps<br />
in freight service due to issues such as ab<strong>and</strong>onments or lines taken out of service. The<br />
analysis should take into consideration emerging freight economic sectors <strong>and</strong> distribution<br />
patterns.<br />
Conduct grain supply chain study to determine future multimodal needs<br />
Conduct a study, in cooperation with the <strong>Oklahoma</strong> Department of Agriculture, to evaluate<br />
the future supply chain requirements of the agriculture industry. The study should<br />
consider changes in grain distribution, future railroad service practices, freight car supply,<br />
storage capacity, <strong>and</strong> modal connectivity.<br />
Prepare <strong>and</strong> disseminate a GIS-based statewide rail database<br />
Create a publicly accessible GIS- <strong>and</strong> web-based railroad inventory which includes items<br />
such as right-of-way ownership, weight of rail, 286,000-pound load capability, etc.<br />
Develop an unused rail siding inventory<br />
In conjunction with the Department of Commerce, develop an inventory of all unused<br />
rail sidings <strong>and</strong> industrial leads in the state. This information would be valuable to economic<br />
development in identifying sites <strong>and</strong> locations for potential rail-served businesses<br />
in the state.<br />
16-6<br />
<strong>Oklahoma</strong> <strong>Statewide</strong> <strong>Freight</strong> <strong>and</strong> <strong>Passenger</strong> <strong>Rail</strong> <strong>Plan</strong>
17. <strong>Rail</strong> <strong>and</strong> <strong>Rail</strong>-related Infrastructure<br />
Improvement Projects<br />
OKLAHOMA<br />
STATEWIDE FREIGHT &<br />
PASSENGER RAIL PLAN<br />
A number of rail infrastructure improvement projects for the State of <strong>Oklahoma</strong> have<br />
been identified through submittals from Class I railroads <strong>and</strong> short line railroads, as well<br />
as by identifying potential passenger rail operations projects, including both intercity passenger<br />
rail <strong>and</strong> commuter rail. At present, ODOT has inadequate resources to fund all of<br />
the major capital improvement projects compiled other than projects that have been designated<br />
for inclusion in the state’s 8-Year <strong>Rail</strong> Program, or included as part of the 8-Year<br />
Highway Construction Program. The latter includes road projects that have a railroad<br />
element. The ODOT programs <strong>and</strong> railroad wish lists are outlined below.<br />
The State-owned <strong>Rail</strong> Construction <strong>and</strong> Maintenance<br />
Work <strong>Plan</strong><br />
The State-owned <strong>Rail</strong> Construction <strong>and</strong> Maintenance Work <strong>Plan</strong> is funded through the<br />
RMRF established through the passage of the <strong>Rail</strong>road Rehabilitation Act in 1978. Funding<br />
comes from both the <strong>Oklahoma</strong> <strong>Freight</strong> Car Tax <strong>and</strong> from the lease-purchase agreements<br />
with rail operators in the state. Annual contributions to the fund are approximately<br />
$1.8 million per year, expected now to fall to $1.2 million per year with the UP acquisition<br />
of its lease lines.<br />
Projects are, <strong>and</strong> will continue to be, identified from applications submitted through the<br />
<strong>Rail</strong>road Rehabilitation Act Loan Program as well as in the future from this State <strong>Rail</strong> <strong>Plan</strong>.<br />
Projects are prioritized based on safety considerations <strong>and</strong> infrastructure deficiencies.<br />
Consideration is given to the following in project selection:<br />
• Track condition<br />
• <strong>Rail</strong> structure condition<br />
• Annual tonnage transported<br />
• Anticipated percentage of truck traffic reduction<br />
• Capacity<br />
• <strong>Rail</strong> highway safety<br />
• National freight transportation trends<br />
ODOT has employed an objective investment program intended to maximize the benefit<br />
from its scarce resources. Last year’s plan included 31 multiple year projects on six short<br />
line railroads. The current plan is pending approval by the <strong>Oklahoma</strong> Transportation<br />
Commission.<br />
May 2012 17-1
Chapter 17<br />
Table 17-1<br />
ODOT construction work plan—projects with railroad improvements<br />
County Highway Description<br />
Programmed<br />
Construction Estimate<br />
Canadian I-40B I-408 over the UP railroad on the south edge of El Reno $6,500,000<br />
Grant U.S. 81 U.S. 81 over Pole Cat <strong>and</strong> unnamed creeks approximately 6.0 <strong>and</strong> 6.7 miles north of the U.S. 81 <strong>and</strong> SH 11 junction $6,663,700<br />
Kay I-235 I-35 beginning at mile marker 220 <strong>and</strong> extending north to mile marker 224.43, including removal of ab<strong>and</strong>oned railroad bridges $20,000,000<br />
Kay U.S. 77 U.S. 77 add shoulder <strong>and</strong> resurface from Newkirk city limits north 3.2 miles south of the Kansas stateline $5,907,834<br />
Logan SH 51 SH-51 over East Beaver Creek 0.3 miles west of the U.S. 77 <strong>and</strong> SH 51 junction (includes improvements to the junction <strong>and</strong> BNSF<br />
railroad overpass).<br />
$12,000,000<br />
Logan SH 33 SH-33 over Cottonwood Creek Noble Street railroad in Guthrie (an additional rail project will be tied to this project) $13,554,466<br />
<strong>Oklahoma</strong> I-235 I-235 NW 50th <strong>and</strong> BNSF bridges <strong>and</strong> approaches (Segment 4A) $7,760,267<br />
<strong>Oklahoma</strong> I-235 I-235 mainline from NW 36th street interchange to north of NW 50th (Segment 7) (S-48) (H-88, 69) (an additional rail project will<br />
$15,450,000<br />
be tied to this project)<br />
<strong>Oklahoma</strong> I-235 I-35 over the I-240 junction (Phase I) reconstruct interchange (an additional rail project will be tied to this project; BNSF rail<br />
bridges over I-240, north of Flynn Yard)<br />
$14,233,431 (additional<br />
railroad bridge costs to be<br />
determined)<br />
<strong>Oklahoma</strong> I-40 I-40 Crosstown WP 14, pedestrian bridge (superstructure) in the vicinity of Harvey Avenue (100 percent state) $3,056,725<br />
<strong>Oklahoma</strong> I-40 I-40 Crosstown WP 34, GR, DR, BR <strong>and</strong> surface from Agnew west 0.7 mile $21,528,822<br />
<strong>Oklahoma</strong> I-40 I-40 Crosstown deconstruction of the existing Crosstown bridge $9,949,993<br />
<strong>Oklahoma</strong> I-40 I-40 Crosstown WP 35, west connection of new Crosstown with the boulevard $12,247.811<br />
<strong>Oklahoma</strong> I-40 I-40 Crosstown WP 1.5, BNSF bridge at boulevard $6,688,495<br />
<strong>Oklahoma</strong> I-40 I-40 Crosstown WP, 4.4, GR, DR, BR <strong>and</strong> surface from the <strong>Oklahoma</strong> City Canal east 0.9 mile <strong>and</strong> shift I-40 traffic to new alignment $30,000,000<br />
<strong>Oklahoma</strong> I-40 I-40 Crosstown WP 4.5, GR, DR, BR <strong>and</strong> surface the boulevard from BNSF east to I-40 $6,116,431<br />
<strong>Oklahoma</strong> I-40 I-40 Crosstown UP at the Harter Yard $1,315,097<br />
<strong>Oklahoma</strong> I-40 I-40 Crosstown WP 1.5, railroad work for the BNSF bridge at the boulevard $1,340,000<br />
<strong>Oklahoma</strong> I-40 I-40 Crosstown BNSF Riverside Connection tracks, from I-35 to the new permanent interchange track site (an additional rail project<br />
will be tied to this project)<br />
$8,583,181<br />
Payne SH 51 SH-51 over Boomer Creek, just west of U.S. 177 in Stillwater City = right-of-way, UT, <strong>and</strong> preliminary engineering $8,540,000<br />
17-2<br />
<strong>Oklahoma</strong> <strong>Statewide</strong> <strong>Freight</strong> <strong>and</strong> <strong>Passenger</strong> <strong>Rail</strong> <strong>Plan</strong>
ODOT Construction Work <strong>Plan</strong> (Highway)<br />
<strong>Rail</strong> <strong>and</strong> <strong>Rail</strong>-related Infrastructure Improvement Projects<br />
<strong>Oklahoma</strong> has a similar plan for highway construction projects. Some of those projects<br />
include a railroad component. They are shown in Table 17-1.<br />
Stakeholder identified projects<br />
Many projects were identified during the development of this State <strong>Rail</strong> <strong>Plan</strong>. They have<br />
been categorized by type of railroad—Class I, state-owned Class III, privately owned<br />
Class III, <strong>and</strong> commuter rail. The projects are summarized in the following tables.<br />
Major <strong>Rail</strong>-related Issue Facing <strong>Oklahoma</strong><br />
<strong>Oklahoma</strong> has been involved in the business of preserving <strong>and</strong> maintaining rail service<br />
within the state for the past 30+ years. The efforts to acquire lines subject to ab<strong>and</strong>onment<br />
via mergers or bankruptcies has been well documented earlier in this <strong>Plan</strong> as the state has<br />
worked to maintain the rail freight network. In the same sense, the state’s involvement<br />
in retaining/maintaining rail passenger service after the creation of Amtrak in the early<br />
1970s was detailed in Chapter 11.<br />
The overriding theme of this state rail plan is to take advantage of the ability for both<br />
freight rail <strong>and</strong> passenger rail to serve as fuel for the economic engine of the state. The<br />
state is focusing on growth in all sectors of the state; <strong>and</strong>, the railroad sector should be a<br />
leader in this growth movement.<br />
Instead of attempting to preserve <strong>and</strong> maintain the state’s rail infrastructure, <strong>Oklahoma</strong><br />
should focus on upgrading the infrastructure of its Class III short line railroads so that<br />
they can all serve the 286,000-pound rail cars that are the state of the art in the movement<br />
of commodities by rail today. Expansion <strong>and</strong> growth should also occur in emerging <strong>and</strong><br />
growing energy sectors as well as in the areas of additional rail-served industrial parks <strong>and</strong><br />
transload facilities.<br />
Also, the state should go forward in the movement of people by seeking increased service<br />
<strong>and</strong> extension of service into new markets on its state-supported Heartl<strong>and</strong> Flyer passenger<br />
rail service. Also, the potential for high-speed passenger rail service connecting<br />
<strong>Oklahoma</strong>’s two largest cities should continue to be explored as well as new commuter rail<br />
services that would provide mobility options for commuters into the <strong>Oklahoma</strong> City Area.<br />
Class III railroad 286,000-pound capacity issue<br />
The short line railroad industry in <strong>Oklahoma</strong>, as well as many other states, has a significant<br />
portion of its rail system that is deficient in terms of being able to h<strong>and</strong>le<br />
286,000-pound rail cars. This is the equipment that is currently the st<strong>and</strong>ard for the<br />
Class I railroads. For those railroads that are not capable of these loads, either due to<br />
bridges or structures that are not rated for these heavier loads, or light weight rail (pounds<br />
per 3-foot sections of rail), they are limited to shipping 263,000-pound rail cars or loading<br />
286,000-pound cars 23,000 pounds short of their full capacity. This puts shippers at a disadvantage<br />
by removing some of the efficiencies <strong>and</strong> advantages of rail freight shipments.<br />
May 2012 17-3
Chapter 17<br />
Table 17-2<br />
Proposed Class I railroad improvements (continued on next page)<br />
Sponsors/<br />
Advocates<br />
<strong>Rail</strong>road(s)<br />
Operating<br />
or Owning<br />
Lines Project name/description Municipalities Counties<br />
Estimated<br />
Cost<br />
(thous<strong>and</strong>s) Benefits Program Status<br />
1 UP UP Jacks siding extension Jacks Kingfisher $6,000 Added capacity benefits shippers<br />
<strong>and</strong> improves efficiency<br />
2 UP UP Tank farm—new siding $8,000 Added capacity benefits shippers<br />
<strong>and</strong> improves efficiency<br />
3 UP UP El Reno—power switches<br />
<strong>and</strong> south leg of wye<br />
4 UP UP CTC—Enid/Duncan subs Chickasha<br />
Duncan<br />
El Reno<br />
Enid<br />
Kingfisher<br />
Medford<br />
Waurika<br />
5 UP UP Washita/Chickasha run<br />
through terminal<br />
El Reno Canadian $12,000 Private benefits include reduced<br />
switching costs<br />
Canadia<br />
Garfield<br />
Grady<br />
Grant<br />
Jefferson<br />
Kingfisher<br />
Stephens<br />
Caddo<br />
Grady<br />
$40,000 Added capacity benefits shippers<br />
with reduced shipping time; private<br />
benefits include reduced rail<br />
operating costs<br />
$40,000 Terminal improvements benefit<br />
shippers by reducing total time;<br />
private benefits include improved<br />
safety <strong>and</strong> reduced costs<br />
6 UP UP CTC—Wagoner sub Wagoner Wagoner $15,000 Added capacity benefits shippers<br />
with reduced shipping time; private<br />
benefits include reduced rail<br />
operating costs<br />
7 UP UP Sunray—siding extension Sunray Stephens $6,000 Added capacity benefits shippers<br />
<strong>and</strong> improves efficiency<br />
2012–2016 Potential<br />
stimulus<br />
2012–2016 Potential<br />
stimulus<br />
2012–2016 Potential<br />
stimulus<br />
2012–2016 Potential<br />
stimulus<br />
2017–2031 Potential<br />
stimulus<br />
2012–2016 Potential<br />
stimulus<br />
2017–2031 Potential<br />
stimulus<br />
17-4<br />
<strong>Oklahoma</strong> <strong>Statewide</strong> <strong>Freight</strong> <strong>and</strong> <strong>Passenger</strong> <strong>Rail</strong> <strong>Plan</strong>
<strong>Rail</strong> <strong>and</strong> <strong>Rail</strong>-related Infrastructure Improvement Projects<br />
Table 17-2<br />
Proposed Class I railroad improvements (continued from previous page)<br />
Sponsors/<br />
Advocates<br />
<strong>Rail</strong>road(s)<br />
Operating<br />
or Owning<br />
Lines Project name/description Municipalities Counties<br />
8 UP UP Waurika—siding<br />
extension<br />
9 UP UP Rush Springs—siding<br />
extension<br />
10 UP UP Enid terminal<br />
improvements<br />
Estimated<br />
Cost<br />
(thous<strong>and</strong>s) Benefits Program Status<br />
Waurika Jefferson $6,000 Added capacity benefits shippers<br />
<strong>and</strong> improves efficiency<br />
Rush Springs Grady $6,000 Added capacity benefits shippers<br />
<strong>and</strong> improves efficiency<br />
Enid Garfield $10,000 Terminal improvements benefit<br />
shippers by reducing total time;<br />
private benefits include improved<br />
safety <strong>and</strong> reduced costs<br />
11 UP UP Ryan—siding extension Ryan Jefferson $6,000 Added capacity benefits shippers<br />
<strong>and</strong> improves efficiency<br />
12 ODOT UP/BNSF Grade separation of UP<br />
<strong>and</strong> BNSF<br />
13 City of<br />
Tulsa<br />
BNSF Downtown Tulsa sealed<br />
corridor (BNSF railway)<br />
extension<br />
14 ODOT BNSF BNSF bridge at<br />
boulevard—I-40<br />
Claremore Rogers $59,000 Public benefits include reduced<br />
crossing delays <strong>and</strong> safety; private<br />
benefits include reduced train delays<br />
Tulsa Tulsa $400 Public benefits include improved<br />
safety <strong>and</strong> reduced crossing<br />
accidents<br />
<strong>Oklahoma</strong> City <strong>Oklahoma</strong> $6,700 Public benefits include improved<br />
downtown accessibility<br />
2012–2016 Potential<br />
stimulus<br />
2017–2031 Potential<br />
stimulus<br />
2012–2016 Potential<br />
stimulus<br />
2017–2031 Potential<br />
stimulus<br />
Proposed Potential<br />
TIGER Grant stimulus<br />
2012–2016<br />
2012–2016 Potential<br />
stimulus<br />
Related<br />
to I-40<br />
Crosstown<br />
Project<br />
2012-2016<br />
May 2012 17-5
Chapter 17<br />
Table 17-2<br />
Proposed Class I railroad improvements (continued from previous page)<br />
Sponsors/<br />
Advocates<br />
<strong>Rail</strong>road(s)<br />
Operating<br />
or Owning<br />
Lines Project name/description Municipalities Counties<br />
Estimated<br />
Cost<br />
(thous<strong>and</strong>s) Benefits Program Status<br />
15 ODOT UP Reconstruct Harter yard <strong>Oklahoma</strong> City <strong>Oklahoma</strong> $1,300 Private benefits include improved<br />
capacity <strong>and</strong> operating efficiency<br />
16 ODOT UP Relocate up wye track <strong>Oklahoma</strong> City <strong>Oklahoma</strong> $5,400 Private benefits include operating<br />
flexibility<br />
17 ODOT BNSF BNSF Riverside connecting<br />
track to new permanent<br />
interchange site<br />
18 ODOT BNSF Bridge/SH 33/over<br />
cottonwood creek<br />
19 ODOT BNSF I-235/BNSF bridges <strong>and</strong><br />
NW 50th<br />
20 ODOT BNSF BNSF rail bridges over<br />
I-240 north of Flynn Yard<br />
<strong>Oklahoma</strong> City <strong>Oklahoma</strong> Unknown Private benefits include reduced<br />
time for railroad interchange moves;<br />
public benefits include reduced train<br />
movements on roadway crossings<br />
<strong>and</strong> elimination of rail back-up<br />
moves<br />
Guthrie Logan $13,600 Public benefit—highway<br />
improvement<br />
<strong>Oklahoma</strong> City <strong>Oklahoma</strong> Unknown Public benefit—highway<br />
improvement<br />
<strong>Oklahoma</strong> City <strong>Oklahoma</strong> Unknown Public benefit—highway<br />
improvement<br />
Related<br />
to I-40<br />
Crosstown<br />
Project<br />
Related<br />
to I-40<br />
Crosstown<br />
Project<br />
Related<br />
to I-40<br />
Crosstown<br />
Project<br />
2012-2016<br />
2012-2016<br />
2012-2016<br />
2017-2031<br />
2017-2031<br />
2017-2031<br />
17-6<br />
<strong>Oklahoma</strong> <strong>Statewide</strong> <strong>Freight</strong> <strong>and</strong> <strong>Passenger</strong> <strong>Rail</strong> <strong>Plan</strong>
<strong>Rail</strong> <strong>and</strong> <strong>Rail</strong>-related Infrastructure Improvement Projects<br />
Table 17-2<br />
Proposed Class I railroad improvements (continued from previous page)<br />
Sponsors/<br />
Advocates<br />
21 <strong>Oklahoma</strong><br />
City<br />
22 City of<br />
Perry<br />
<strong>Rail</strong>road(s)<br />
Operating<br />
or Owning<br />
Lines Project name/description Municipalities Counties<br />
Estimated<br />
Cost<br />
(thous<strong>and</strong>s) Benefits Program Status<br />
BNSF Multimodal HUB <strong>Oklahoma</strong> City <strong>Oklahoma</strong> $26,000 Public benefit—improved public<br />
transport<br />
BNSF Grade separation Perry Noble Unknown Public benefit—highway<br />
improvement<br />
23 BNSF BNSF DT sections of Panh<strong>and</strong>le<br />
sub<br />
24 BNSF BNSF Siding extensions along<br />
Avard sub<br />
25 BNSF BNSF DT sections of Cherokee<br />
Sub<br />
Woods<br />
Ellis<br />
Woodward<br />
Alfalfa<br />
Woods<br />
Alfalfa<br />
Garfield<br />
Noble<br />
Pawnee<br />
Creek<br />
Tulsa<br />
Tulsa<br />
Rogers<br />
Craig<br />
Related to<br />
Commuter<br />
<strong>Rail</strong> <strong>and</strong><br />
Intercity<br />
<strong>Passenger</strong><br />
<strong>Rail</strong><br />
Unknown TBD TBD<br />
Unknown TBD TBD<br />
Unknown TBD TBD<br />
TIGER Funds<br />
requested<br />
2012-2016<br />
2017-2031<br />
May 2012 17-7
Chapter 17<br />
Table 17-2<br />
Proposed Class I railroad improvements (continued from previous page)<br />
Sponsors/<br />
Advocates<br />
<strong>Rail</strong>road(s)<br />
Operating<br />
or Owning<br />
Lines Project name/description Municipalities Counties<br />
26 BNSF BNSF New sidings along<br />
Cherokee sub<br />
27 BNSF BNSF Siding extensions along<br />
Cherokee sub<br />
28 BNSF BNSF Siding extensions along<br />
Red Rock sub<br />
29 BNSF BNSF Track improvements at<br />
Scullin<br />
30 BNSF BNSF East leg of wye<br />
Avard to Panh<strong>and</strong>le subs<br />
31 BNSF BNSF East leg of wye, Port of<br />
Catoosa<br />
Tulsa<br />
Rogers<br />
Estimated<br />
Cost<br />
(thous<strong>and</strong>s) Benefits Program Status<br />
Unknown TBD TBD<br />
Craig<br />
Tulsa<br />
Unknown TBD TBD<br />
Rogers<br />
Craig<br />
Kay<br />
Unknown TBD TBD<br />
Noble<br />
Logan<br />
<strong>Oklahoma</strong><br />
Clevel<strong>and</strong><br />
McClain<br />
Garvin<br />
Murry<br />
Carter<br />
Love<br />
Johnston Unknown TBD TBD<br />
Woods Unknown TBD TBD<br />
Rogers Unknown TBD TBD<br />
17-8<br />
<strong>Oklahoma</strong> <strong>Statewide</strong> <strong>Freight</strong> <strong>and</strong> <strong>Passenger</strong> <strong>Rail</strong> <strong>Plan</strong>
<strong>Rail</strong> <strong>and</strong> <strong>Rail</strong>-related Infrastructure Improvement Projects<br />
Table 17-3<br />
Proposed Class III railroad improvements—state-owned lines (continued on next page)<br />
Sponsors/<br />
Advocates<br />
<strong>Rail</strong>road(s)<br />
Operating<br />
or Owning<br />
Lines<br />
Project name/<br />
description Municipalities Counties<br />
1 AT&L AT&L Tie project Unknown Blaine<br />
Canadian<br />
2 AT&L AT&L Tie projects Unknown Blaine<br />
Canadian<br />
3 BNGR BNGR Grain shuttle facility<br />
site<br />
4 BNGR BNGR Grain shuttle<br />
mainline<br />
improvement<br />
5 BNGR BNGR Fertilizer<br />
distribution site<br />
Estimated<br />
Cost<br />
(thous<strong>and</strong>s) Benefits Program Status<br />
$268 Preserves state investment,<br />
2012<br />
improves capacity for shippers to<br />
use bigger cars; improved operating<br />
speeds reduce shipping time <strong>and</strong><br />
reduce crew costs<br />
$270 to<br />
$300<br />
Preserves state investment,<br />
improves capacity for shippers to<br />
use bigger cars; improved operating<br />
speeds reduce shipping time <strong>and</strong><br />
reduce crew costs<br />
Braman or Blackwell Kay $750 Benefit shippers through reduced<br />
shipping rates<br />
Braman or Blackwell Kay $1,000 Preserves state investment,<br />
improves capacity for shippers to<br />
use bigger cars; improved operating<br />
speeds reduce shipping time <strong>and</strong><br />
reduce crew costs<br />
Braman or Blackwell Kay $250 New service reduces shippers<br />
trucking costs<br />
Need to<br />
identify site<br />
Assumed<br />
improvement<br />
for project #5<br />
Need to<br />
identify site<br />
Multi-year<br />
2012–<br />
2016<br />
2012–<br />
2016<br />
2012–<br />
2016<br />
2012–<br />
2016<br />
May 2012 17-9
Chapter 17<br />
Table 17-3<br />
Proposed Class III railroad improvements—state-owned lines (continued from previous page)<br />
Sponsors/<br />
Advocates<br />
<strong>Rail</strong>road(s)<br />
Operating<br />
or Owning<br />
Lines<br />
6 SLWC SLWC Spot ties for gauge<br />
<strong>and</strong> curves, 20 miles<br />
Project name/<br />
description Municipalities Counties<br />
Sapulpa<br />
Ch<strong>and</strong>ler<br />
<strong>Oklahoma</strong> City<br />
El Reno<br />
Chickasha<br />
Anadarko<br />
Lawton<br />
Hobart<br />
Creek<br />
Lincoln<br />
<strong>Oklahoma</strong><br />
Canadian<br />
Grady<br />
Caddo<br />
Comanche<br />
Kiowa<br />
7 SLWC SLWC Resurface, ballast,<br />
20 miles<br />
8 SLWC SLWC Ballast, 600 tons, 20<br />
miles<br />
Sapulpa<br />
Ch<strong>and</strong>ler<br />
<strong>Oklahoma</strong> City<br />
El Reno<br />
Chickasha<br />
Anadarko<br />
Lawton<br />
Hobart<br />
Sapulpa<br />
Ch<strong>and</strong>ler<br />
<strong>Oklahoma</strong> City<br />
El Reno<br />
Chickasha<br />
Anadarko<br />
Lawton<br />
Hobart<br />
Creek<br />
Lincoln<br />
<strong>Oklahoma</strong><br />
Canadian<br />
Grady<br />
Caddo<br />
Comanche<br />
Kiowa<br />
Creek<br />
Lincoln<br />
<strong>Oklahoma</strong><br />
Canadian<br />
Grady<br />
Caddo<br />
Comanche<br />
Kiowa<br />
Estimated<br />
Cost<br />
(thous<strong>and</strong>s) Benefits Program Status<br />
$671 Preserves state investment,<br />
improves capacity for shippers to<br />
use bigger cars; improved operating<br />
speeds reduce shipping time <strong>and</strong><br />
reduce crew costs<br />
Assumed<br />
improvement<br />
not for<br />
Stillwater<br />
Branch<br />
P2012<br />
$207 Preserves state investment,<br />
improves capacity for shippers to<br />
use bigger cars; improved operating<br />
speeds reduce shipping time <strong>and</strong><br />
reduce crew costs<br />
Assumed<br />
improvement<br />
not for<br />
Stillwater<br />
Branch<br />
W2012<br />
$218 Preserves state investment,<br />
improves capacity for shippers to<br />
use bigger cars; improved operating<br />
speeds reduce shipping time <strong>and</strong><br />
reduce crew costs<br />
Assumed<br />
improvement<br />
not for<br />
Stillwater<br />
Branch<br />
W2013<br />
17-10<br />
<strong>Oklahoma</strong> <strong>Statewide</strong> <strong>Freight</strong> <strong>and</strong> <strong>Passenger</strong> <strong>Rail</strong> <strong>Plan</strong>
<strong>Rail</strong> <strong>and</strong> <strong>Rail</strong>-related Infrastructure Improvement Projects<br />
Table 17-3<br />
Proposed Class III railroad improvements—state-owned lines (continued from previous page)<br />
Sponsors/<br />
Advocates<br />
<strong>Rail</strong>road(s)<br />
Operating<br />
or Owning<br />
Lines<br />
9 SLWC SLWC Cross ties, resurface,<br />
100 miles<br />
10 SLWC SLWC Cross ties, surface,<br />
ballast, 38 miles of<br />
track<br />
11 FMRC FMRC Sayre yard<br />
rehabilitation<br />
12 FMRC FMRC Weatherford yard<br />
track<br />
Project name/<br />
description Municipalities Counties<br />
Sapulpa<br />
Ch<strong>and</strong>ler<br />
<strong>Oklahoma</strong> City<br />
El Reno<br />
Chickasha<br />
Anadarko<br />
Lawton<br />
Hobart<br />
Creek<br />
Lincoln<br />
<strong>Oklahoma</strong><br />
Canadian<br />
Grady<br />
Caddo<br />
Comanche<br />
Kiowa<br />
Estimated<br />
Cost<br />
(thous<strong>and</strong>s) Benefits Program Status<br />
$588 Preserves state investment,<br />
improves capacity for shippers to<br />
use bigger cars; improved operating<br />
speeds reduce shipping time <strong>and</strong><br />
reduce crew costs<br />
$517 Preserves state investment,<br />
improves capacity for shippers to<br />
use bigger cars; improved operating<br />
speeds reduce shipping time <strong>and</strong><br />
reduce crew costs<br />
Sayre Beckham $175 Yard improvements reduce<br />
derailments with public <strong>and</strong> private<br />
benefits<br />
Arapaho Custer $150 Increased yard capacity <strong>and</strong><br />
efficiency<br />
Assumed<br />
Improvement<br />
not for<br />
Stillwater<br />
Branch<br />
W2014<br />
W2015<br />
2012–<br />
2016<br />
2012–<br />
2016<br />
May 2012 17-11
Chapter 17<br />
Table 17-3<br />
Proposed Class III railroad improvements—state-owned lines (continued from previous page)<br />
Sponsors/<br />
Advocates<br />
<strong>Rail</strong>road(s)<br />
Operating<br />
or Owning<br />
Lines<br />
13 FMRC FMRC Sayre to Clinton<br />
upgrade tracks<br />
14 BNGR BNGR <strong>Rail</strong> improvements,<br />
36 miles<br />
Wellington, Kansas,<br />
to Blackwell<br />
(17 miles in<br />
<strong>Oklahoma</strong>)<br />
AT&L = Austin, Todd & Ladd <strong>Rail</strong>road<br />
BNGR = Blackwell Northern Gateway <strong>Rail</strong>road<br />
FMRC = Farmrail Corporation<br />
FRA = Federal <strong>Rail</strong>road Administration<br />
SLWC = Stillwater Central <strong>Rail</strong>road<br />
Project name/<br />
description Municipalities Counties<br />
Sayre<br />
Elk City<br />
Canute<br />
Foss<br />
Clinton<br />
Beckham<br />
Washita<br />
Custer<br />
Estimated<br />
Cost<br />
(thous<strong>and</strong>s) Benefits Program Status<br />
Improves track capacity for larger<br />
freight cars <strong>and</strong> increased operating<br />
speeds—public <strong>and</strong> private benefits<br />
Kay County $25,000 Preserves state investment,<br />
improves freight service for shippers<br />
TIGER Grant<br />
from FRA<br />
2012–<br />
2016<br />
2017–<br />
2031<br />
17-12<br />
<strong>Oklahoma</strong> <strong>Statewide</strong> <strong>Freight</strong> <strong>and</strong> <strong>Passenger</strong> <strong>Rail</strong> <strong>Plan</strong>
<strong>Rail</strong> <strong>and</strong> <strong>Rail</strong>-related Infrastructure Improvement Projects<br />
Table 17-4<br />
Proposed Class III railroad improvements—privately owned lines (continued on next page)<br />
Sponsors/<br />
Advocates<br />
<strong>Rail</strong>road(s)<br />
Operating or<br />
Owning Lines<br />
1 KRR KRR Sub<br />
improvement<br />
2 KRR KRR Sub rail<br />
replacement<br />
3 KRR KRR System 75#<br />
replace rail<br />
4 SKOL SKOL Replace cross<br />
ties, switch ties,<br />
surface new<br />
ballast<br />
5 SKOL SKOL Replace cross<br />
ties <strong>and</strong> surface<br />
Project name/<br />
description Municipalities Counties<br />
Ashdown/<br />
Lakeside<br />
Estimated<br />
Cost<br />
(thous<strong>and</strong>s) Benefits Program Status<br />
Arkansas $11,000 Public benefits include reduced transit<br />
times <strong>and</strong> capacity for larger freight cars;<br />
private benefits include reduced crew<br />
costs <strong>and</strong> lower maintenance costs<br />
Antlers Pushmataha $2,000 Public benefits include reduced transit<br />
times <strong>and</strong> capacity for larger freight cars;<br />
private benefits include reduced crew<br />
costs <strong>and</strong> lower maintenance costs<br />
Unknown $1,000 Public benefits include reduced transit<br />
times <strong>and</strong> capacity for larger freight cars;<br />
private benefits include reduced crew<br />
costs <strong>and</strong> lower maintenance costs<br />
$1,200 Public benefits include reduced transit<br />
times <strong>and</strong> capacity for larger freight cars;<br />
private benefits include reduced crew<br />
costs <strong>and</strong> lower maintenance costs<br />
$400 Public benefits include reduced transit<br />
times <strong>and</strong> capacity for larger freight cars;<br />
private benefits include reduced crew<br />
costs <strong>and</strong> lower maintenance costs<br />
2017–2031<br />
2012–2016<br />
2012–2016<br />
W2012<br />
W2014<br />
May 2012 17-13
Chapter 17<br />
Table 17-4<br />
Proposed Class III railroad improvements—privately owned lines (continued from previous page)<br />
Sponsors/<br />
Advocates<br />
<strong>Rail</strong>road(s)<br />
Operating or<br />
Owning Lines<br />
6 SKOL SKOL 7,000 ballast,<br />
cross ties, <strong>and</strong><br />
surface<br />
7 TOE TOE Track<br />
maintenance<br />
<strong>and</strong> bridges<br />
8 TOE TOE Grade separation<br />
U.S. 70<br />
9 TSU TSU 5 bridges—<br />
stringer, cap,<br />
<strong>and</strong> tie<br />
10 GNBC GNBC Relay new rail<br />
(2,500 feet)<br />
Project name/<br />
description Municipalities Counties<br />
Estimated<br />
Cost<br />
(thous<strong>and</strong>s) Benefits Program Status<br />
$1,300 Public benefits include reduced transit<br />
W2015<br />
times <strong>and</strong> capacity for larger freight cars;<br />
private benefits include reduced crew<br />
costs <strong>and</strong> lower maintenance costs<br />
Idabel McCurtain $1,500 Public benefits include reduced transit<br />
times <strong>and</strong> capacity for larger freight cars;<br />
private benefits include reduced crew<br />
costs <strong>and</strong> lower maintenance costs<br />
Valliant McCurtain Improved public safety by elimination of<br />
grade crossing of U.S. 70<br />
Sapulpa<br />
Tulsa<br />
Arapaho<br />
Cordell<br />
Enid<br />
Fairview<br />
Frederick<br />
Hobart<br />
Taloga<br />
Watonga<br />
Creek<br />
Tulsa<br />
Blaine<br />
Custer<br />
Dewey<br />
Garfield<br />
Kiowa<br />
Major<br />
Tillman<br />
Washita<br />
Public benefits include reduced transit<br />
times <strong>and</strong> capacity for larger freight cars;<br />
private benefits include reduced crew<br />
costs <strong>and</strong> lower maintenance costs<br />
$110 Public benefits include reduced transit<br />
times <strong>and</strong> capacity for larger freight cars;<br />
private benefits include reduced crew<br />
costs <strong>and</strong> lower maintenance costs<br />
Need to ID<br />
site<br />
2012–2016<br />
2012–2016<br />
2012–2016<br />
P2012–<br />
2016<br />
17-14<br />
<strong>Oklahoma</strong> <strong>Statewide</strong> <strong>Freight</strong> <strong>and</strong> <strong>Passenger</strong> <strong>Rail</strong> <strong>Plan</strong>
<strong>Rail</strong> <strong>and</strong> <strong>Rail</strong>-related Infrastructure Improvement Projects<br />
Table 17-4<br />
Proposed Class III railroad improvements—privately owned lines (continued from previous page)<br />
Sponsors/<br />
Advocates<br />
<strong>Rail</strong>road(s)<br />
Operating or<br />
Owning Lines<br />
11 GNBC GNBC Tie replacement<br />
(6,000)<br />
12 GNBC GNBC 10 crossing<br />
upgrades<br />
13 PC PC Pre-construction<br />
initial line<br />
logistics center<br />
14 PMR PMR Build wye to add<br />
north access<br />
Project name/<br />
description Municipalities Counties<br />
Arapaho<br />
Cordell<br />
Enid<br />
Fairview<br />
Frederick<br />
Hobart<br />
Taloga<br />
Watonga<br />
Arapaho<br />
Cordell<br />
Enid<br />
Fairview<br />
Frederick<br />
Hobart<br />
Taloga<br />
Watonga<br />
Blaine<br />
Custer<br />
Dewey<br />
Garfield<br />
Kiowa<br />
Major<br />
Tillman<br />
Washita<br />
Blaine<br />
Custer<br />
Dewey<br />
Garfield<br />
Kiowa<br />
Major<br />
Tillman<br />
Washita<br />
Claremore Rogers $2,670<br />
FRA Capital<br />
Grant<br />
Application<br />
Estimated<br />
Cost<br />
(thous<strong>and</strong>s) Benefits Program Status<br />
$375 Public benefits include reduced transit<br />
times <strong>and</strong> capacity for larger freight cars;<br />
private benefits include reduced crew<br />
costs <strong>and</strong> lower maintenance costs<br />
P2012–<br />
2016<br />
$250 Improved public safety at crossings 2012–2016<br />
Public benefits through improved<br />
intermodal service for shippers<br />
2012–2016<br />
Muskogee Muskogee $1,000 Improved rail access 2012–2016<br />
May 2012 17-15
Chapter 17<br />
Table 17-4<br />
Proposed Class III railroad improvements—privately owned lines (continued from previous page)<br />
Sponsors/<br />
Advocates<br />
<strong>Rail</strong>road(s)<br />
Operating or<br />
Owning Lines<br />
15 PMR PMR Connection<br />
between UP <strong>and</strong><br />
BNSF<br />
16 PMR PMR Longer third<br />
track exp<strong>and</strong><br />
yard<br />
17 City of<br />
Shawnee<br />
18 ODOT,<br />
ADOT,<br />
TxDOT<br />
UP (out of<br />
service)<br />
Project name/<br />
description Municipalities Counties<br />
Restore rail<br />
Shawnee to<br />
McAlester<br />
KRR Upgrade siding<br />
tracks, industrial<br />
leads, grade<br />
crossings<br />
Muskogee Muskogee $4,000 to<br />
5,000<br />
Estimated<br />
Cost<br />
(thous<strong>and</strong>s) Benefits Program Status<br />
Improved rail access for competitive<br />
shipping rates<br />
2017–2031<br />
Muskogee Muskogee Improved rail access 2012–2016<br />
Hughes<br />
Pittsburg<br />
Pottawatomi<br />
Seminole<br />
Bryan<br />
Choctaw<br />
McCurtain<br />
Pushmataha<br />
$36,500 Public benefits through new east-west<br />
service<br />
$28,300 Public benefits through new east-west<br />
service<br />
2017–2031<br />
2017–2031<br />
17-16<br />
<strong>Oklahoma</strong> <strong>Statewide</strong> <strong>Freight</strong> <strong>and</strong> <strong>Passenger</strong> <strong>Rail</strong> <strong>Plan</strong>
<strong>Rail</strong> <strong>and</strong> <strong>Rail</strong>-related Infrastructure Improvement Projects<br />
Table 17-4<br />
Proposed Class III railroad improvements—privately owned lines (continued from previous page)<br />
Sponsors/<br />
Advocates<br />
<strong>Rail</strong>road(s)<br />
Operating or<br />
Owning Lines<br />
19 WTJR WTJR Reconstruct<br />
bridge (52.4)<br />
Project name/<br />
description Municipalities Counties<br />
20 WTJR WTJR Reconstruct<br />
bridge (76.1)<br />
21 WTJR WTJR Replace 61.06<br />
miles 85 <strong>and</strong> 90#<br />
rail with 115#<br />
rail<br />
ADOT = Arkansas Department of<br />
SKOL = South Kansas & <strong>Oklahoma</strong> <strong>Rail</strong>road<br />
Transportation<br />
TOE = Texas, <strong>Oklahoma</strong> & Eastern <strong>Rail</strong>road<br />
FRA = Federal <strong>Rail</strong>road Administration<br />
GNBC = Grainbelt<br />
KRR = Kiamichi <strong>Rail</strong>road<br />
ODOT = <strong>Oklahoma</strong> Department of<br />
Transportation<br />
PC = Tulsa’s Port of Catoosa<br />
PMR = Port of Muskogee <strong>Rail</strong>road<br />
TSU = Tulsa-Sapulpa Union <strong>Rail</strong>way<br />
TxDOT = Texas Department of Transportation<br />
UP = Union Pacific <strong>Rail</strong>road<br />
WTJR = Wichita, Tillman & Jackson <strong>Rail</strong>way<br />
Estimated<br />
Cost<br />
(thous<strong>and</strong>s) Benefits Program Status<br />
$320 Public benefits include reduced transit<br />
2012–2016<br />
times <strong>and</strong> capacity for larger freight cars;<br />
private benefits include reduced crew<br />
costs <strong>and</strong> lower maintenance costs<br />
$100 Public benefits include reduced transit<br />
2012–2016<br />
times <strong>and</strong> capacity for larger freight cars;<br />
private benefits include reduced crew<br />
costs <strong>and</strong> lower maintenance costs<br />
$20,000 Public benefits include reduced transit<br />
2017–2031<br />
times <strong>and</strong> capacity for larger freight cars;<br />
private benefits include reduced crew<br />
costs <strong>and</strong> lower maintenance costs<br />
May 2012 17-17
Chapter 17<br />
Table 17-5<br />
Proposed commuter <strong>and</strong> passenger rail improvements (continued on next page)<br />
Sponsors/<br />
Advocates<br />
1 Commuter<br />
<strong>Rail</strong><br />
<strong>Rail</strong>road(s)<br />
Operating or<br />
Owning Lines<br />
Commuter<br />
<strong>Rail</strong><br />
Project<br />
Name/<br />
Description Municipalities Counties<br />
20 miles<br />
north to<br />
Edmond<br />
<strong>Oklahoma</strong><br />
City–Edmond<br />
<strong>Oklahoma</strong><br />
Logan<br />
2 Commuter<br />
<strong>Rail</strong><br />
Commuter<br />
<strong>Rail</strong><br />
20 miles<br />
south to<br />
Norman<br />
<strong>Oklahoma</strong><br />
City–Norman<br />
<strong>Oklahoma</strong><br />
Clevel<strong>and</strong><br />
3 Commuter<br />
<strong>Rail</strong><br />
Commuter<br />
<strong>Rail</strong><br />
30 miles<br />
west to El<br />
Reno<br />
<strong>Oklahoma</strong><br />
City–El Reno<br />
<strong>Oklahoma</strong><br />
Canadian<br />
Estimated<br />
Cost<br />
(thous<strong>and</strong>s) Benefits Program Status<br />
Unknown Add BNSF mainline track, station<br />
facilities at Edmond crossinging<br />
improvements; public benefits include<br />
new commuter service <strong>and</strong> improved<br />
crossing safety; private benefits<br />
include added freight rail operating<br />
capacity<br />
Unknown Add BNSF mainline track, possible<br />
station upgrades, review possible<br />
crossing improvements; public<br />
benefits include new commuter<br />
service <strong>and</strong> improved crossing safety;<br />
private benefits include added freight<br />
rail capacity<br />
Unknown Track improvements to be determined,<br />
station facilities in El Reno <strong>and</strong> Yukon,<br />
crossing improvements, possible<br />
park <strong>and</strong> ride in West <strong>Oklahoma</strong><br />
City; public benefits included new<br />
commuter service <strong>and</strong> grade crossing<br />
improvements<br />
Alternatives<br />
analysis in<br />
progress<br />
Alternatives<br />
analysis in<br />
progress<br />
2017–2031<br />
2017–2031<br />
TBD TBD<br />
17-18<br />
<strong>Oklahoma</strong> <strong>Statewide</strong> <strong>Freight</strong> <strong>and</strong> <strong>Passenger</strong> <strong>Rail</strong> <strong>Plan</strong>
<strong>Rail</strong> <strong>and</strong> <strong>Rail</strong>-related Infrastructure Improvement Projects<br />
Table 17-5<br />
Proposed commuter <strong>and</strong> passenger rail improvements (continued from previous page)<br />
Sponsors/<br />
Advocates<br />
4 Commuter<br />
<strong>Rail</strong><br />
5 Commuter<br />
<strong>Rail</strong><br />
<strong>Rail</strong>road(s)<br />
Operating or<br />
Owning Lines<br />
Commuter<br />
<strong>Rail</strong><br />
Commuter<br />
<strong>Rail</strong><br />
Project<br />
Name/<br />
Description Municipalities Counties<br />
30 miles<br />
east to<br />
Shawnee<br />
5 miles east<br />
to Midwest<br />
City<br />
<strong>Oklahoma</strong><br />
City–Shawnee<br />
<strong>Oklahoma</strong><br />
City–Midwest<br />
City<br />
<strong>Oklahoma</strong><br />
Pottawatomie<br />
Estimated<br />
Cost<br />
(thous<strong>and</strong>s) Benefits Program Status<br />
Unknown Track rehabilitation, station facilities<br />
in Shawnee, other possible station<br />
facilities in McLoud, Harrah, Choctaw<br />
<strong>and</strong> Spencer, crossing improvements,<br />
possible second bridge over <strong>Oklahoma</strong><br />
River; public benefits include new<br />
commuter service <strong>and</strong> grade crossing<br />
improvements; private benefits<br />
include improved freight capacity<br />
<strong>Oklahoma</strong> Unknown Track rehabilitation, station facilities<br />
in Midwest City <strong>and</strong> Del City, crossing<br />
improvements; public benefits include<br />
new commuter service <strong>and</strong> grade<br />
crossing improvements<br />
TBD TBD<br />
Alternatives<br />
analysis in<br />
progress<br />
2017–2031<br />
May 2012 17-19
Chapter 17<br />
Table 17-5<br />
Proposed commuter <strong>and</strong> passenger rail improvements (continued from previous page)<br />
Sponsors/<br />
Advocates<br />
6 Intercity<br />
<strong>Passenger</strong> <strong>Rail</strong><br />
<strong>Rail</strong>road(s)<br />
Operating or<br />
Owning Lines<br />
Intercity<br />
<strong>Passenger</strong> <strong>Rail</strong><br />
Project<br />
Name/<br />
Description Municipalities Counties<br />
<strong>Oklahoma</strong><br />
City to<br />
Tulsa, 110<br />
Miles<br />
<strong>Oklahoma</strong><br />
City–Tulsa<br />
<strong>Oklahoma</strong>,<br />
Lincoln, Creek,<br />
Tulsa<br />
7 ODOT, KDOT Intercity<br />
<strong>Passenger</strong><br />
Extend<br />
Heartl<strong>and</strong><br />
Flyer to<br />
Newton<br />
<strong>Oklahoma</strong><br />
City–Kansas<br />
Estimated<br />
Cost<br />
(thous<strong>and</strong>s) Benefits Program Status<br />
Unknown <strong>Oklahoma</strong> City station/platform<br />
improvements, construct wye<br />
connection from elevated BNSF<br />
tracks to UP tracks in former CRIP<br />
freight yard, track rehabilitation from<br />
BNSF connection to NE 50th Street,<br />
address crossing <strong>and</strong> grade separation<br />
improvements, construct new<br />
trackage NE 50th to Sapulpa, new park<br />
<strong>and</strong> rides near Arcadia <strong>and</strong> Sapulpa,<br />
new mainline track from Tulsa to<br />
Sapulpa, station facilities in Tulsa,<br />
new trackage around Cherokee yard;<br />
public benefits include new intercity<br />
passenger service <strong>and</strong> option for travel<br />
between State’s two major cities<br />
$136,500 ODOT,<br />
TxDOT,<br />
KDOT with<br />
FRA<br />
Provide new passenger service to<br />
North Central <strong>Oklahoma</strong> <strong>and</strong> to<br />
Wichita; connections at Newton,<br />
Kansas, to Southwest Chief; public<br />
benefits include new option for<br />
intercity travel<br />
Corridor<br />
investment<br />
plan in<br />
progress<br />
Service<br />
development<br />
plan<br />
completed<br />
TBD<br />
TBD<br />
17-20<br />
<strong>Oklahoma</strong> <strong>Statewide</strong> <strong>Freight</strong> <strong>and</strong> <strong>Passenger</strong> <strong>Rail</strong> <strong>Plan</strong>
<strong>Rail</strong> <strong>and</strong> <strong>Rail</strong>-related Infrastructure Improvement Projects<br />
Table 17-5<br />
Proposed commuter <strong>and</strong> passenger rail improvements (continued from previous page)<br />
Sponsors/<br />
Advocates<br />
<strong>Rail</strong>road(s)<br />
Operating or<br />
Owning Lines<br />
8 ODOT, KDOT Intercity<br />
<strong>Passenger</strong><br />
9 ODOT Intercity<br />
<strong>Passenger</strong><br />
Project<br />
Name/<br />
Description Municipalities Counties<br />
New<br />
Daytime<br />
Service<br />
Kansas<br />
City–<br />
<strong>Oklahoma</strong><br />
City–Fort<br />
Worth<br />
New<br />
passenger<br />
rail<br />
equipment<br />
FRA = Federal <strong>Rail</strong>road Administration<br />
KDOT = Kansas Department of Transportation<br />
ODOT = <strong>Oklahoma</strong> Department of Transportation<br />
TxDOT = Texas Department of Transportation<br />
North-South<br />
Corridor<br />
Estimated<br />
Cost<br />
(thous<strong>and</strong>s) Benefits Program Status<br />
$436,200 ODOT,<br />
TxDOT,<br />
KDOT with<br />
FRA<br />
Provide new daytime passenger<br />
service between Kansas City, Wichita,<br />
<strong>Oklahoma</strong> City, <strong>and</strong> Fort Worth;<br />
public benefits include new option for<br />
intercity travel<br />
<strong>Statewide</strong> TBD Possible use of CNG; public benefits<br />
include reduced diesel emissions<br />
Service<br />
development<br />
plan<br />
completed<br />
TBD<br />
TBD TBD<br />
May 2012 17-21
Chapter 17<br />
Table 17-6<br />
Proposed industrial improvements<br />
Sponsors/<br />
Advocates<br />
<strong>Rail</strong>road(s)<br />
Operating or<br />
Owning Lines Project Name/Description Municipalities Counties<br />
1 PC PC Pre-construction initial line<br />
LOGISTICS CENTER<br />
Claremore Rogers $2,670<br />
FRA Capital Grant<br />
Application<br />
Estimated Cost<br />
(thous<strong>and</strong>s) Fund Source Program<br />
TBD TBD<br />
2 PMR PMR Build wye to add north access Muskogee Muskogee $1,000 TBD TBD<br />
3 PMR PMR Connection between UP <strong>and</strong> BNSF Muskogee Muskogee $4,000 to 5,000 TBD TBD<br />
4 PMR PMR Longer third track exp<strong>and</strong> yard Muskogee Muskogee NA TBD TBD<br />
$36,500 FRA TIGER<br />
5 City of<br />
Shawnee<br />
UP (out of<br />
service)<br />
6 Neal McCaleb WATCO<br />
operator: BNSF<br />
serving railroad<br />
7 WATCO<br />
Companies/<br />
Kinder Morgan<br />
Energy<br />
Partners<br />
8 Citizen’s<br />
Pottawatomie<br />
Nation<br />
Restore rail Shawnee to McAlester NA Pottawatomi<br />
Seminole<br />
Hughes<br />
Pittsburg<br />
North American Opportunity Zone Ardmore Carter $33,000 Sovereign<br />
Development Fund,<br />
LLC<br />
SLWC WATCO-Kinder Morgan CRUDE OIL<br />
TRANSFER FACILITY<br />
UP <strong>and</strong> AOK Citizen’s Pottawatomie Nation<br />
industrial park<br />
Stroud Lincoln TBD WATCO-Kinder<br />
Morgan<br />
Shawnee Pottawatomie TBD TBD TBD<br />
NA<br />
NA<br />
17-22<br />
<strong>Oklahoma</strong> <strong>Statewide</strong> <strong>Freight</strong> <strong>and</strong> <strong>Passenger</strong> <strong>Rail</strong> <strong>Plan</strong>
<strong>Rail</strong> <strong>and</strong> <strong>Rail</strong>-related Infrastructure Improvement Projects<br />
In some cases, 90-pound 1 rail may be sufficient to h<strong>and</strong>le 286,000-pound loads, but usually<br />
these higher weight shipments require 115-pound rail. The condition of the ties <strong>and</strong> ballast<br />
on the short line are also factors that affect the rail line’s ability to carry heavier loads.<br />
<strong>Rail</strong>road<br />
Structures deficient at<br />
286,000-pound Load<br />
Miles of <strong>Rail</strong> less than<br />
90 pounds per yard<br />
Arkansas-<strong>Oklahoma</strong> <strong>Rail</strong>road Structures on 12 miles Good<br />
Austin, Todd <strong>and</strong> Ladd <strong>Rail</strong>road All good 8.5 miles<br />
Blackwell Northern Gateway <strong>Rail</strong>road 28 structures 18 miles<br />
Kiamichi <strong>Rail</strong>road Structures on 143.2 miles Good<br />
Stillwater Central <strong>Rail</strong>road All structures on 22 miles Good<br />
Tulsa-Sapulpa Union <strong>Rail</strong>way All structures on 23 miles 10 miles (estimated)<br />
Grainbelt 94 structures Good<br />
Farmrail Corporation 109 structures 80 miles<br />
Wichita, Tillman <strong>and</strong> Jackson <strong>Rail</strong>way 4 structures 12.2 miles<br />
Northwestern <strong>Oklahoma</strong> 1 structure Good<br />
Table 17-7<br />
Proposed 286,000-pound<br />
capacity improvements<br />
Figure 17-1<br />
Lines with 286,000-pound<br />
deficiency<br />
1<br />
<strong>Rail</strong> size is designated in pounds per yard; in this case, a 3-foot section of rail weighs 90 pounds.<br />
May 2012 17-23
Chapter 17<br />
Additional analysis is needed in <strong>Oklahoma</strong> to fully determine the magnitude of the issue<br />
the short lines face in bringing all of their lines up to the 286,000-pound st<strong>and</strong>ard. The<br />
short lines provided ODOT with data during the development of this State <strong>Rail</strong> <strong>Plan</strong> that<br />
are shown in Table 17-7 <strong>and</strong> Figure 17-1.<br />
17-24<br />
<strong>Oklahoma</strong> <strong>Statewide</strong> <strong>Freight</strong> <strong>and</strong> <strong>Passenger</strong> <strong>Rail</strong> <strong>Plan</strong>
18. Funding <strong>and</strong> Financing Alternatives<br />
OKLAHOMA<br />
STATEWIDE FREIGHT<br />
&<br />
PASSENGER RAIL PLAN<br />
This section provides funding <strong>and</strong> financing sources used by ODOT as well as a survey<br />
of federal rail funding <strong>and</strong> financing sources currently available in the U.S. It also offers<br />
snapshots of alternatives used in other states. A number of the sources examined could<br />
serve as models to offset infrastructure <strong>and</strong> operating costs related to new <strong>and</strong> existing rail<br />
service in <strong>Oklahoma</strong>.<br />
Funding vs. Financing Programs<br />
Funding <strong>and</strong> financing are two different concepts, though they are often misused<br />
interchangeably. Funding is money provided to pay for the capital or operations <strong>and</strong><br />
maintenance needs of a project <strong>and</strong> could come from grants, fare revenue, tax collections,<br />
bond programs, private equity, or a variety of other sources. Funding is generally received<br />
as a cash payment on a one-time or ongoing basis.<br />
Financing, on the other h<strong>and</strong>, refers to a number of mechanisms that accelerate cash flows<br />
through borrowing. There are a number of public <strong>and</strong> private financing programs available,<br />
<strong>and</strong> each requires an ongoing (short- or long-term) flow of funds to repay the debt.<br />
The most attractive financing programs are those that are both inexpensive (have low<br />
initial fees <strong>and</strong> interest charges) <strong>and</strong> are flexible in the repayment terms. But financing is<br />
not simply a series of cash inflows; rather, it is a transaction that dedicates all or part of a<br />
series of cash inflows to the repayment of an upfront sum that fits the needs of a project.<br />
Existing <strong>Oklahoma</strong> <strong>Rail</strong> Funding<br />
State-owned rail funding in <strong>Oklahoma</strong> is collected from several sources <strong>and</strong> deposited<br />
into the RMRF. This fund is then utilized for projects on <strong>Oklahoma</strong>’s state-owned rail<br />
system. Major revenue sources for the funds are highlighted below.<br />
<strong>Oklahoma</strong> freight car tax<br />
This fund, composed of an annual 4-percent tax on freight rail car revenues, yields a nearly<br />
constant annual income because its rate has not been changed since its inception in 1978.<br />
Lease agreements<br />
ODOT <strong>Rail</strong> Programs Division receives annual lease <strong>and</strong> operations payments from<br />
seven separate short line rail operators. (ODOT has most all of its state-owned rail under<br />
lease at this time.) These leases also carry a revenue-sharing component. Until recently,<br />
there were nine such leases, but UP <strong>and</strong> WTJR both exercised their right to purchase the<br />
lines they were operating under the terms of their matured lease-purchase agreements.<br />
May 2012 18-1
Chapter 18<br />
It is significant to note that the loss of the annual payment that was being made by UP is<br />
roughly equivalent to 66 percent of the total annual RMRF, so there is a strong need to<br />
make up for this reduction in annual funding starting in 2012.<br />
Following are the current leases:<br />
• Farmrail Corporation (FMRC)—179 miles on the Sunbelt Line between Hydro<br />
<strong>and</strong> Erick <strong>and</strong> the Orient Line between Thomas <strong>and</strong> Elmer<br />
• Austin, Todd & Ladd (AT&L)—29-mile segment between El Reno <strong>and</strong> Geary<br />
• Arkansas-<strong>Oklahoma</strong> <strong>Rail</strong>road (AOK)—70-mile segment between McAlester <strong>and</strong><br />
Howe<br />
• Stillwater Central <strong>Rail</strong>road (SLWC)—125 miles on two segments: one segment<br />
from Stillwater to Pawnee <strong>and</strong> the other from <strong>Oklahoma</strong> City to Tulsa<br />
• Blackwell Northern Gateway <strong>Rail</strong>road (BNGR)—17-mile segment from Blackwell<br />
to the <strong>Oklahoma</strong>-Kansas state line<br />
At this time, almost all of the state-owned rail lines are under lease <strong>and</strong> in operation.<br />
The only track not under lease or in operation is a heavily deteriorated segment between<br />
Hydro <strong>and</strong> Bridgeport.<br />
Right-of-way sales<br />
ODOT occasionally sells portions of l<strong>and</strong> deemed as excess to its needs, <strong>and</strong> some of<br />
these sales are former rail rights-of-way acquired by ODOT. Also, as discussed previously,<br />
ODOT has situations where sales are generated as a result of a mature lease-purchase<br />
agreement. ODOT also recently sold a former rail segment, known as the Guthrie, to Fairmont<br />
Line following exhaustive efforts to return the rail line to active use. These sales are<br />
very infrequent <strong>and</strong> do not constitute any significant amount of annual funding.<br />
Funding for the Heartl<strong>and</strong> Flyer passenger rail operation<br />
The Heartl<strong>and</strong> Flyer passenger rail operation is funded through two sources: (1) an annual<br />
line item state appropriation which goes into the <strong>Oklahoma</strong> <strong>Passenger</strong> <strong>Rail</strong> <strong>and</strong> Tourism<br />
Revolving Fund <strong>and</strong> (2) HB 1873. This house bill was passed in 1994 to establish a dedicated<br />
fund for the public transit revolving fund. Past funding has come as a result of the<br />
appropriations process. Previously, $500,000 from the motor fuel tax was going to public<br />
transit every year. In 1993, the Legislature established a dedicated fund for passenger<br />
rail service from the motor fuel tax. This passenger rail fund amounted to approximately<br />
$1.2 million. This bill combines two funds (Amtrak earmark of $1.2 million <strong>and</strong> transit<br />
funding of $500,000) <strong>and</strong> splits the $1.7 million funds evenly between the two systems at<br />
$850,000 each.<br />
Federal Funding Programs<br />
ODOT <strong>Rail</strong> Programs Division participates in all rail-specific <strong>and</strong> rail-related federal<br />
programs. Recent years have provided numerous rail funding opportunities which have<br />
resulted in very positive results for the state. ODOT’S success is summarized below following<br />
descriptions of the various programs.<br />
18-2<br />
<strong>Oklahoma</strong> <strong>Statewide</strong> <strong>Freight</strong> <strong>and</strong> <strong>Passenger</strong> <strong>Rail</strong> <strong>Plan</strong>
<strong>Passenger</strong> <strong>Rail</strong> Improvement <strong>and</strong> Investment Act of 2008<br />
Funding <strong>and</strong> Financing Alternatives<br />
PRIIA was enacted in October 2008 <strong>and</strong> provided for the reauthorization of the National<br />
<strong>Rail</strong>road <strong>Passenger</strong> Corporation (Amtrak); the act tasked Amtrak, USDOT, FRA, individual<br />
states, <strong>and</strong> other stakeholders with improving operations, facilities, <strong>and</strong> service. PRIIA<br />
authorized over $13 billion between 2009 <strong>and</strong> 2013 <strong>and</strong> promotes the development of new<br />
<strong>and</strong> improved intercity rail passenger services <strong>and</strong> state-sponsored corridors throughout<br />
the U.S., as well as the development of high-speed rail corridors.<br />
PRIIA established three new competitive grant programs for funding high-speed intercity<br />
passenger rail improvements. Each of these three programs provides 80-percent federal<br />
funding with a required 20-percent non-federal match. The three grant programs established<br />
by PRIIA are described individually below:<br />
• Intercity passenger rail service corridor capital assistance program—Under<br />
PRIIA, an intercity passenger rail capital grant program was established, which<br />
requires individual states to identify passenger rail corridor improvement projects<br />
as potential funding recipients in their state rail plans. The program is intended<br />
to create the framework for a new intercity passenger rail service corridor capital<br />
assistance program. The HSIPR Program provides funding assistance to states,<br />
groups of states, interstate compacts, public agencies, <strong>and</strong> Amtrak (both alone <strong>and</strong><br />
in cooperation with states). HSIPR funds can be utilized for service development<br />
programs; planning projects; or financing facilities, infrastructure, or equipment<br />
necessary to provide or improve intercity passenger rail transportation. Existing<br />
or proposed intercity passenger services are eligible for funding under this<br />
program.<br />
• High-speed rail corridor development program—PRIIA also authorized<br />
$1.5 billion annually to establish <strong>and</strong> implement a high-speed rail corridor development<br />
program. Funding is currently restricted to projects intended to develop<br />
the ten federally designated high-speed corridors for intercity passenger rail<br />
services that may reasonably be expected to reach speeds of at least 110 miles per<br />
hour.<br />
• Congestion grants—PRIIA authorizes $325 million annually for grants to states,<br />
or to Amtrak in cooperation with states, for financing the capital costs of facilities,<br />
infrastructure, <strong>and</strong> equipment for high-priority rail corridor projects necessary to<br />
reduce congestion or facilitate intercity passenger rail ridership growth.<br />
ODOT has received three FRA HSIPR grants, providing matching planning <strong>and</strong> capital<br />
funds towards the state’s effort to improve <strong>and</strong> exp<strong>and</strong> its passenger rail service. These<br />
funds are being used to complete planning <strong>and</strong> environmental studies for the proposed<br />
high-speed rail route from Tulsa to <strong>Oklahoma</strong> City, to complete the <strong>Oklahoma</strong> <strong>Freight</strong> <strong>and</strong><br />
<strong>Passenger</strong> <strong>Rail</strong> <strong>Plan</strong>, <strong>and</strong> to improve infrastructure at the Santa Fe Depot related to operation<br />
of the Heartl<strong>and</strong> Flyer.<br />
The state also participated in the recently completed HSIPR-funded KDOT-ODOT SDP<br />
examining passenger rail service expansion between Kansas, <strong>Oklahoma</strong>, <strong>and</strong> Texas. Additionally,<br />
ODOT will participate in the $14-million HSIPR-funded Texas-<strong>Oklahoma</strong> study,<br />
which will produce an EIS <strong>and</strong> an SDP for the <strong>Oklahoma</strong> City to South Texas <strong>Passenger</strong><br />
<strong>Rail</strong> Corridor.<br />
May 2012 18-3
Chapter 18<br />
As noted, funding for programs associated with PRIIA must be appropriated annually<br />
<strong>and</strong>, at this time, these programs have not been funded for fiscal year 2012. However,<br />
the initial appropriation is nearing 100 percent obligation, <strong>and</strong> these projects will be<br />
completed over the next few years. ODOT, for instance, will be completing two projects<br />
associated with this program over the next three years.<br />
American Recovery <strong>and</strong> Reinvestment Act of 2009<br />
ARRA allocated $48.1 billion in transportation investments throughout the U.S., including<br />
$8.0 billion for high-speed rail, $1.3 billion for Amtrak, <strong>and</strong> $1.5 billion in TIGER<br />
grants. Additional information on ARRA funding programs available for HSIPR services<br />
is detailed below.<br />
ODOT <strong>Rail</strong> Programs Division carried out two ARRA-funded projects that improved<br />
rail infrastructure. AOK was able to shore up a section of rail line being encroached upon<br />
by the North Canadian River, <strong>and</strong> BNSF was able to improve operating conditions on an<br />
industrial track serving the community of Shawnee.<br />
TIGER<br />
To date, the TIGER program has provided over $2.6 billion for the National Surface<br />
Transportation System through 2011. Funds are awarded towards capital investments on a<br />
competitive basis toward projects that demonstrate they will have a significant national or<br />
regional impact. Congress dedicated $1.5 billion for the first round of the TIGER program<br />
as part of ARRA, <strong>and</strong> rounds two <strong>and</strong> three dedicated an additional $1.1 billion through<br />
FYs 2010 <strong>and</strong> 2011 appropriations acts. Congress has appropriated $500 million for the<br />
TIGER program for FY 2012, with details to be announced this year in the Federal Register.<br />
The third round of TIGER funding in 2011 allocated $511 million in grants, of which<br />
10 percent will go to freight rail projects.<br />
<strong>Oklahoma</strong> has been the recipient or co-recipient of three TIGER grant awards totaling<br />
$66.5 million, which all significantly improve rail in the state:<br />
• The I-244 multimodal bridge replacement is Tulsa’s first multimodal bridge crossing<br />
<strong>and</strong> will accommodate highway, high-speed intercity <strong>and</strong> commuter rail, <strong>and</strong><br />
pedestrian <strong>and</strong> bicycle traffic.<br />
• The Great Plains freight rail project is constructing yard, shop, <strong>and</strong><br />
286,000‐pound line improvements <strong>and</strong> relocating the SKOL hub from an urban to<br />
a rural area.<br />
• The <strong>Oklahoma</strong> freight rail upgrade will upgrade 49 miles of state-owned rail line<br />
in the Anadarko Basin to more efficiently <strong>and</strong> safely transport crude oil <strong>and</strong> gas to<br />
the refinement stage.<br />
18-4<br />
<strong>Oklahoma</strong> <strong>Statewide</strong> <strong>Freight</strong> <strong>and</strong> <strong>Passenger</strong> <strong>Rail</strong> <strong>Plan</strong>
SAFETEA-LU programs<br />
Funding <strong>and</strong> Financing Alternatives<br />
The Safe, Accountable, Efficient Transportation Equity Act—A Legacy for Users (SAFETEA-<br />
LU), the current authorization bill for the nation’s surface transportation program, was<br />
scheduled to expire on October 1, 2009. However, temporary extensions for SAFETEA-LU<br />
have been passed through March 2012 or until a new transportation authorization bill is<br />
approved.<br />
The SAFETEA-LU bill contains a number of program provisions with specific eligibility<br />
for rail. These include both funding <strong>and</strong> financing programs, which are described in detail<br />
below.<br />
Section 130 highway-rail grade crossing program<br />
This program provides federal support to projects in an effort to reduce the incidence of<br />
accidents, injuries, <strong>and</strong> fatalities at public rail-highway crossings. States may utilize funds<br />
to improve the safety of railroad crossings, including installing or upgrading warning<br />
devices, eliminating at-grade crossings through grade separation, or consolidating or closing<br />
at-grade crossings. The federal share for these funds is 90 percent, with the remaining<br />
10 percent to be provided by local matching funds.<br />
As discussed in the Safety <strong>and</strong> Security Section, ODOT <strong>Rail</strong> Programs Safety Branch<br />
carries out numerous grade crossing safety improvement projects annually utilizing this<br />
fund.<br />
<strong>Rail</strong> line relocation <strong>and</strong> improvement capital grant program<br />
Section 9002 of SAFETEA-LU authorizes funding for the purpose of providing financial<br />
assistance for local rail line <strong>and</strong> improvement projects. Any construction project that<br />
improves the route or structure of a rail line <strong>and</strong> (1) involves a lateral or vertical relocation<br />
of any portion of the rail line or (2) is carried out for the purpose of mitigating the<br />
adverse effects of rail traffic on safety, motor vehicle traffic flow, community quality of life,<br />
or economic development is eligible. The federal share for these funds is 90 percent, not to<br />
exceed $20 million.<br />
Successful grant applicants will meet cost-benefit requirements—specifically, the requirement<br />
that a project’s benefits (for the period of the estimated economic life of the<br />
improvements) exceed the costs of that project for the same time period.<br />
Congestion mitigation <strong>and</strong> air quality improvement program<br />
CMAQ funds transportation projects <strong>and</strong> programs that improve air quality by reducing<br />
transportation-related emissions in non-attainment <strong>and</strong> maintenance areas for ozone,<br />
carbon monoxide, <strong>and</strong> particulate matter. Examples of CMAQ-funded rail projects<br />
include intermodal facilities, rail track rehabilitation, diesel engine retrofits, idle-reduction<br />
projects, <strong>and</strong> new rail sidings.<br />
May 2012 18-5
Chapter 18<br />
Funding is available for areas that do not meet the National Ambient Air Quality St<strong>and</strong>ards<br />
(non-attainment areas) as well as former non-attainment areas that are now in<br />
compliance (maintenance areas). Funds are distributed based on a formula considering<br />
an area’s population by county <strong>and</strong> the severity of an area’s ozone <strong>and</strong> carbon monoxide<br />
problems.<br />
SAFETEA-LU requires states <strong>and</strong> MPOs to give priority in distributing CMAQ funds to<br />
diesel engine retrofits <strong>and</strong> other cost-effective emission reduction <strong>and</strong> congestion mitigation<br />
activities. SAFETEA-LU also requires the Secretary of Transportation to evaluate <strong>and</strong><br />
assess the effectiveness of a representative sample of CMAQ projects to determine the<br />
direct <strong>and</strong> indirect impacts of projects on air quality <strong>and</strong> congestion levels as well as to<br />
ensure the effective implementation of the program.<br />
<strong>Freight</strong> initiatives may be eligible under the 1999 CMAQ guidance. Although freight is<br />
not mentioned specifically, the provision for P3s represents another avenue of support<br />
for freight <strong>and</strong> intermodal projects that generate air quality benefits. Emissions reductions<br />
can be generated directly by private projects through treatment of tailpipe exhaust<br />
or application of advanced engine technologies <strong>and</strong> thus may qualify for CMAQ funding<br />
(assuming all other requirements are met).<br />
State DOTs <strong>and</strong> MPOs select <strong>and</strong> approve projects for funding. The federal matching<br />
share for these funds is 80 percent.<br />
Surface transportation program<br />
The surface transportation program is a grant program available for improvement of any<br />
federal-aid highway, bridge, or transit capital project. The program is meant to provide<br />
flexible funding to be used by states <strong>and</strong> localities. Eligible rail improvements include<br />
lengthening or increasing vertical clearance of bridges, eliminating crossings, or improving<br />
intermodal connectors. State DOTs <strong>and</strong> MPOs select <strong>and</strong> approve projects for funding<br />
under this program. The federal matching share for these funds is 80 percent.<br />
<strong>Rail</strong> <strong>and</strong> fixed guideway modernization<br />
The transit capital investment program (49 USC 5309) provides capital assistance for new<br />
rail systems (new starts/small starts program), bus systems (bus <strong>and</strong> bus-related equipment<br />
<strong>and</strong> facilities program), <strong>and</strong> modernization of existing rail systems (fixed guideway<br />
modernization program). Funding can be used for a variety of purposes, including the<br />
following:<br />
• Purchase <strong>and</strong> rehabilitation of rolling stock, track, line equipment, structures,<br />
signals, <strong>and</strong> communications<br />
• Development of power equipment <strong>and</strong> substations<br />
• Construction of passenger stations <strong>and</strong> terminals<br />
• Purchases of security equipment <strong>and</strong> systems<br />
• Construction of maintenance facilities<br />
• Operational support equipment, including computer hardware <strong>and</strong> software<br />
• System extensions<br />
• Preventive maintenance<br />
18-6<br />
<strong>Oklahoma</strong> <strong>Statewide</strong> <strong>Freight</strong> <strong>and</strong> <strong>Passenger</strong> <strong>Rail</strong> <strong>Plan</strong>
Funding <strong>and</strong> Financing Alternatives<br />
Eligible recipients for new starts funding are public entities <strong>and</strong> agencies (transit authorities<br />
<strong>and</strong> other state/local public bodies <strong>and</strong> agencies), including states, municipalities,<br />
other political subdivisions of states; public agencies <strong>and</strong> instrumentalities of one or more<br />
states; <strong>and</strong> certain public corporations, boards, <strong>and</strong> commissions established under state<br />
law. Modes eligible for funding include heavy rail, commuter rail, <strong>and</strong> a number of other<br />
transit modes.<br />
Transportation <strong>and</strong> community <strong>and</strong> system preservation pilot program<br />
The TCSP program provides funding for initiatives, including planning <strong>and</strong> implementing<br />
grants; performing research to investigate <strong>and</strong> address the relationships between transportation,<br />
community, <strong>and</strong> system preservation; <strong>and</strong> identifying private sector-based initiatives.<br />
Funds are available to states, MPOs, local governments, <strong>and</strong> tribal governments. The law<br />
requires the equitable distribution of funds to a diversity of populations <strong>and</strong> geographic<br />
locations. For discretionary funding, an interagency team evaluates applications for<br />
competitive TCSP grants. TCSP grants can also be designated by Congress. Although<br />
SAFETEA-LU authorized TCSP funding, specific funding levels can vary based on Congress’<br />
annual appropriations.<br />
Transportation enhancement program<br />
These funds are available to strengthen the cultural, aesthetic, <strong>and</strong> environmental aspects<br />
of the nation’s intermodal transportation system. Eligible projects include the rehabilitation<br />
of historic transportation facilities <strong>and</strong> the preservation of ab<strong>and</strong>oned rail corridors,<br />
though a number of environmental preservation, scenic beautification, <strong>and</strong> historic preservation<br />
projects would also qualify. Projects are usually chosen at the local government<br />
level. The federal share of project costs is 80 percent.<br />
Federal Financing Programs<br />
Private activity bonds<br />
SAFETEA-LU established a new financial assistance program that allows the issuance of<br />
up to $15 billion in private activity bonds for transportation infrastructure projects. States<br />
<strong>and</strong> local governments are allowed to issue tax-exempt bonds to finance projects sponsored<br />
by the private sector subject to rules set forth by the Internal Revenue Service.<br />
Eligible projects include privately owned-or-operated highway <strong>and</strong> rail-truck transfer<br />
facilities, including any surface transportation project receiving Title 23 assistance. This<br />
provision, therefore, extends eligibility to TIFIA-assisted public transportation, intercity<br />
bus, or rail facilities <strong>and</strong> vehicles. Eligible rail activities include Amtrak vehicles <strong>and</strong><br />
May 2012 18-7
Chapter 18<br />
facilities, public freight rail facilities, or private facilities providing public benefit for highway<br />
users, as well as intermodal freight transfer facilities.<br />
Transportation infrastructure finance <strong>and</strong> innovation act<br />
The Transportation Infrastructure Finance <strong>and</strong> Innovation Act (TIFIA) program provides<br />
credit assistance for qualified large-scale surface transportation projects of regional <strong>and</strong><br />
national significance. State <strong>and</strong> local governments, as well as special authorities, are eligible<br />
applicants.<br />
The TIFIA program provides credit assistance for qualified projects of regional <strong>and</strong><br />
national significance. Many large-scale surface transportation projects—highway, transit,<br />
railroad, intermodal freight, <strong>and</strong> port access—are eligible for assistance. Eligible applicants<br />
include state <strong>and</strong> local governments, transit agencies, railroad companies, special authorities,<br />
special districts, <strong>and</strong> private entities.<br />
TIFIA offers three distinct types of financial assistance designed to address the varying<br />
requirements of projects throughout their life cycles—secured (direct) loans, loan guarantees,<br />
<strong>and</strong> st<strong>and</strong>by lines of credit. The amount of federal credit assistance may not exceed<br />
33 percent of total reasonably anticipated eligible project costs. The exact terms for each<br />
loan are negotiated between USDOT <strong>and</strong> the borrower, based on the project economics,<br />
the cost <strong>and</strong> revenue profile of the project, <strong>and</strong> any other relevant factors. TIFIA interest<br />
rates are equivalent to Treasury rates. Depending on market conditions, these rates are<br />
often lower than what most borrowers can obtain in the private markets. Unlike private<br />
commercial loans with variable rate debt, TIFIA interest rates are fixed. Overall, borrowers<br />
benefit from improved access to capital markets <strong>and</strong> potentially achieve earlier completion<br />
of large-scale, capital-intensive projects that otherwise might be delayed or not built<br />
at all because of their size <strong>and</strong> complexity or the market’s uncertainty over the timing of<br />
revenues.<br />
Any project that is eligible for federal assistance through existing surface transportation<br />
programs (highway projects <strong>and</strong> transit capital projects) is eligible for the TIFIA credit<br />
program.<br />
The following types of projects are eligible:<br />
• International bridges <strong>and</strong> tunnels<br />
• Intercity passenger bus <strong>and</strong> rail facilities <strong>and</strong> vehicles<br />
• Publicly owned freight rail facilities<br />
• Private facilities providing public benefit for highway users<br />
• Intermodal freight transfer facilities <strong>and</strong> projects that provide access to such<br />
facilities<br />
• Service improvements on or adjacent to the National Highway System<br />
• Projects located within the boundary of a port terminal under certain conditions<br />
An eligible project must be included in the applicable state transportation improvement<br />
program. Major requirements include a capital cost of at least $50 million (or 33.3 percent<br />
of a state’s annual apportionment of federal-aid funds, whichever is less) or $15 million<br />
in the case of Intelligent Transportation Systems. TIFIA credit assistance is limited to a<br />
18-8<br />
<strong>Oklahoma</strong> <strong>Statewide</strong> <strong>Freight</strong> <strong>and</strong> <strong>Passenger</strong> <strong>Rail</strong> <strong>Plan</strong>
Funding <strong>and</strong> Financing Alternatives<br />
maximum of 33 percent of total eligible project costs. Senior debt must be rated investment<br />
grade. The project also must be supported at least in part by user charges or other<br />
non-federal dedicated funding sources. Applicable federal requirements include, but are<br />
not limited to, USC Titles 23 <strong>and</strong> 49, NEPA, Buy America provisions, <strong>and</strong> the Civil Rights<br />
<strong>and</strong> Uniform Relocation Acts.<br />
<strong>Rail</strong>road rehabilitation <strong>and</strong> improvement financing program<br />
The <strong>Rail</strong>road Rehabilitation <strong>and</strong> Improvement Financing (RRIF) Program provides direct<br />
federal loans <strong>and</strong> loan guarantees to finance development of railroad infrastructure. The<br />
FRA is authorized to provide direct loans <strong>and</strong> loan guarantees of up to $35 billion. The<br />
funding may be used to acquire, improve, or rehabilitate intermodal or rail equipment or<br />
facilities, including track, components of track, bridges, yards, buildings, <strong>and</strong> shops; refinance<br />
outst<strong>and</strong>ing debt incurred for the purposes listed above; <strong>and</strong> develop or establish<br />
new intermodal or railroad facilities. Eligible borrowers include railroads, state <strong>and</strong> local<br />
governments, government-sponsored authorities <strong>and</strong> corporations, joint ventures that<br />
include at least one railroad, <strong>and</strong> limited-option freight shippers who intend to construct a<br />
new rail connection.<br />
The RRIF program was established by the Transportation Equity Act for the 21st Century<br />
<strong>and</strong> amended by the SAFETEA-LU. Up to $7.0 billion is reserved for projects benefiting<br />
freight railroads other than Class I carriers.<br />
Direct loans can fund up to 100 percent of a railroad project with repayment periods of up<br />
to 35 years. Interest rates on loans are equal to current Treasury rates. All federal financial<br />
assistance programs must pay for the cost to the government of providing that financial<br />
assistance. In most cases, this is done with appropriations from Congress. Since RRIF<br />
does not currently have an appropriation, this cost must be borne by the applicant, or<br />
another entity on behalf of the applicant, through the payment of the credit risk premium.<br />
FRA will calculate the amount of the credit risk premium that must be paid for each loan<br />
before it can be disbursed. In addition to the credit risk premium, which is paid only if<br />
a loan is approved, each applicant must pay an investigation fee regardless of whether<br />
the loan is approved. The investigation fee defrays costs that FRA incurs in evaluating<br />
RRIF loan applications <strong>and</strong> may not exceed one-half of one percent of the requested loan<br />
amount, but it is often substantially less.<br />
State infrastructure banks<br />
SAFETEA-LU established a new State Infrastructure Bank (SIB) program under which<br />
all states are authorized to enter into cooperative agreements with the Secretary of Transportation<br />
to establish infrastructure revolving funds. The SIB program gives states the<br />
capacity to increase the efficiency of their transportation investment <strong>and</strong> significantly<br />
leverage federal resources by attracting non-federal investment. A SIB, much like a private<br />
bank, can offer a range of loans <strong>and</strong> credit assistance enhancement products to public<br />
<strong>and</strong> private sponsors of Title 23 highway construction projects or Title 49 transit capital<br />
projects. <strong>Oklahoma</strong> has authorization for a SIB; however, <strong>Oklahoma</strong>’s bank has not been<br />
capitalized sufficiently.<br />
May 2012 18-9
Chapter 18<br />
Future Federal Funding<br />
Surface Transportation Reauthorization Act<br />
The last full SAFETEA-LU authorization expired at the end of September 2009. Unable to<br />
pass a full reauthorization, Congress has passed nine temporary extensions, set to expire<br />
in March 2012. There is significant uncertainty over when SAFETEA-LU will be reauthorized<br />
<strong>and</strong> in what form:<br />
• The House has proposed a six-year bill at current funding levels which would<br />
require $75 billion of federal appropriations in addition to gas tax receipts.<br />
• The Senate has proposed a two-year bill at current funding levels which would<br />
require $12 billion of federal appropriations in addition to gas tax receipts.<br />
• Speculation that the Congressional Super Committee would include a robust<br />
Highway Trust Fund reauthorization proposal as part of its deficit reduction plan<br />
died with the Committee’s failure to reach an agreement last November.<br />
With such uncertainty, it is unlikely that we will see a full extension of the Transportation<br />
Reauthorization Act before the 2012 elections.<br />
Exp<strong>and</strong>ed public-private partnership opportunities<br />
Many public agencies that have faced financial or operational difficulties managing infrastructure<br />
assets have found P3s to be an attractive means of achieving a desired level of<br />
service over the long term while transferring undesired risks to the private sector. In its<br />
simplest form, a P3 is an agreement between public <strong>and</strong> private sector parties that transfers<br />
some or all infrastructure functions to the private sector for some predetermined<br />
period of time.<br />
Varying degrees of private sector involvement are available, from design-build contracts<br />
for new construction projects to long-term operations concession agreements. Specific<br />
project characteristics <strong>and</strong> prevailing market trends will guide what is desirable <strong>and</strong><br />
acceptable in a P3 arrangement for a given project. A number of rail project components<br />
can be transferred to the private sector in a P3 arrangement, including project development,<br />
design, construction, financing, operations, <strong>and</strong> maintenance.<br />
Currently, <strong>Oklahoma</strong> is one of 19 states without P3-enabling legislation, which is typically<br />
required in order to complete complex transfers of risk or rights over state property. As<br />
such, the state is currently unable to enter into most P3 arrangements. However in 2011,<br />
Governor Fallin approved the creation of the Eastern Flyer <strong>Passenger</strong> <strong>Rail</strong> Development<br />
Task Force, which will study the feasibility of using P3 delivery formulas to accelerate passenger<br />
rail operations between Tulsa <strong>and</strong> <strong>Oklahoma</strong> City. The Task Force is scheduled to<br />
deliver its final report by the end of 2012. In addition, the State of <strong>Oklahoma</strong> is currently<br />
studying options for implementing P3 legislation, <strong>and</strong> discussion of this issue will be<br />
taken up during the 2012 State legislative session.<br />
18-10<br />
<strong>Oklahoma</strong> <strong>Statewide</strong> <strong>Freight</strong> <strong>and</strong> <strong>Passenger</strong> <strong>Rail</strong> <strong>Plan</strong>
<strong>Oklahoma</strong> <strong>Statewide</strong> <strong>Freight</strong> <strong>and</strong> <strong>Passenger</strong> <strong>Rail</strong> <strong>Plan</strong><br />
<strong>Oklahoma</strong> Department of Transportation