investors IRIL Results Ppt Q4 FY05 - Aditya Birla Nuvo, Ltd
investors IRIL Results Ppt Q4 FY05 - Aditya Birla Nuvo, Ltd
investors IRIL Results Ppt Q4 FY05 - Aditya Birla Nuvo, Ltd

Create successful ePaper yourself
Turn your PDF publications into a flip-book with our unique Google optimized e-Paper software.
Performance Review<br />
2004-05<br />
05<br />
Mumbai, 27 th April 2005<br />
Investor Presentation
Presentation Structure<br />
m Significant initiatives and Business highlights<br />
m Indian Rayon’s (Consolidated) financial performance<br />
m Indian Rayon’s (Standalone) financial performance<br />
m Business performance<br />
m Growth outlook<br />
2
Significant initiatives across businesses<br />
VFY<br />
m Expanded CSY capacity<br />
of 1,000 TPA stabilized<br />
m Initiated work on<br />
à 20 MW captive power<br />
plant<br />
à 85 TPD caustic soda<br />
expansion in 2 phases<br />
Carbon Black<br />
m 40,000 TPA expansion in<br />
Mar-04 fully utilized<br />
m 10,000 TPA added by<br />
de-bottlenecking<br />
m Initiated brown-field<br />
expansion of 50,000 TPA<br />
Textiles<br />
m 20 looms (1,15,000 mtrs<br />
per month) added in<br />
Linen Fabric<br />
m 4,000 TPA wool combing<br />
facility being installed<br />
Garments<br />
Life Insurance<br />
BPO<br />
Insulator JV<br />
m Controlled retail<br />
m 11 new branches<br />
m Addition of 850<br />
m 8,000 TPA<br />
expanded in big way<br />
opened<br />
seats<br />
expansion at<br />
m Distribution<br />
m 11 more<br />
m Further addition<br />
Halol<br />
agreement with<br />
ESPIRIT<br />
branches this<br />
year<br />
of 450 seats by<br />
year-end<br />
3
Business Highlights<br />
Business<br />
Growth in Full year<br />
Highlights for the year<br />
Revenue<br />
Profits<br />
Garments<br />
VFY<br />
Carbon Black<br />
Textiles<br />
Insulator-JV<br />
Life Insurance<br />
Richer product mix, New and innovative products<br />
VFY realisation under pressure; Chlor-alkali demand on a rise;<br />
Implemented revised work norms; To result in productivity improvement<br />
Deeper penetration into export market; Margins impacted by change in<br />
custom duty<br />
Linen Fabric segment outperformed<br />
Satisfactory progress on yield and efficiency improvement efforts; Low<br />
exports affected profitability<br />
Maintained No.2 position amongst private players; Focus on alternate<br />
channel for new business contributed<br />
IT Services<br />
BPO<br />
Curtailed losses by focusing on target segments and reducing nonprofitable<br />
segments<br />
Increased share of non-voice business; Earned positive net profit<br />
4
Consolidated Revenue<br />
m Consolidated revenue jumped to Rs 3,189.3 Crs<br />
à Indian Rayon standalone revenue grew by 18%<br />
2404.3<br />
33%<br />
3189.3<br />
Rs. Cr.<br />
1577.4<br />
18%<br />
1860.6<br />
FY 04 FY 05<br />
Indian Rayon Consolidated<br />
FY 04 FY 05<br />
Indian Rayon Standalone<br />
5
Consolidated Revenue<br />
Cont…<br />
Rs. Cr.<br />
Revenue<br />
Full Year<br />
2004-05 2003-04<br />
Actual <strong>IRIL</strong> share Actual <strong>IRIL</strong> share<br />
Software<br />
3%<br />
BPO<br />
3%<br />
Insulator<br />
3%<br />
Telecom<br />
3%<br />
Indian Rayon (Standalone) 1,860.6 1,860.6 1,577.4 1,577.4<br />
Insurance 956.2 956.2 545.3 545.3<br />
18%<br />
75%<br />
Insurance<br />
30%<br />
Indian Rayon<br />
58%<br />
Software 82.0 82.0 86.0 86.0<br />
5%<br />
BPO 107.8 107.8 69.3 57.3<br />
Others 1.0 1.0 1.0 1.0<br />
56%<br />
<strong>FY05</strong><br />
Insulator 168.8 84.4 163.7 81.8<br />
Telecom 2,270.4 97.3 1,296.7 55.6<br />
Consolidated 5,446.8 3,189.3 3,739.2 2,404.3<br />
33%<br />
All-round growth across businesses<br />
6
Consolidated PAT<br />
m Consolidated Profit improved by 77%<br />
à Indian Rayon profits before exceptional items up 9%<br />
• Exceptional items affected net profits<br />
FY 04 FY 05<br />
Rs. Cr.<br />
111.3 121.4 131.3<br />
113.7<br />
33.1<br />
58.6<br />
9%<br />
13%<br />
77%<br />
FY 04 FY 05<br />
Indian Rayon Consolidated<br />
Before Exceptional<br />
After Exceptional<br />
Indian Rayon Standalone<br />
7
Consolidated PAT<br />
Cont…<br />
PAT<br />
Full Year<br />
2004-05 2003-04<br />
Rs. Cr.<br />
Actual <strong>IRIL</strong> share Actual <strong>IRIL</strong> share<br />
Indian Rayon (Standalone)<br />
Before Exceptional items 121.4 121.4 111.3 111.3<br />
9%<br />
Exceptional Items (7.6) (7.6) 20.0 20.0<br />
After Exceptional items 113.7 113.7 131.3 131.3<br />
13%<br />
Insurance (60.6) (44.9) (77.7) (57.5)<br />
Software (2.6) (2.6) (20.9) (20.9)<br />
BPO 1.0 1.0 (4.1) (2.2)<br />
22%<br />
88%<br />
125%<br />
Others 0.8 0.8 (0.3) (0.3)<br />
Insulator (25.3) (12.7) (14.2) (7.1)<br />
79%<br />
Telecom 74.1 3.2 (236.4) (10.1)<br />
Consolidated 101.2 58.6 (222.3) 33.1<br />
77%<br />
8
Indian Rayon (Standalone)<br />
Financial Performance
Revenue<br />
1577.4<br />
18%<br />
1860.6<br />
Rs. Cr.<br />
400.2<br />
22%<br />
487.0<br />
<strong>Q4</strong> FY 04 <strong>Q4</strong> FY 05<br />
FY 04 FY 05<br />
Impressive Growth of 18% YoY<br />
10
Segmental Revenue<br />
Rs. Cr.<br />
Revenue<br />
4th Quarter<br />
Full Year<br />
2004-05 2003-04 Variance 2004-05 2003-04 Variance<br />
Garments 108.7 89.0 19.6 472.4 391.7 80.7<br />
21%<br />
VFY 91.2 84.9 6.3 352.0 335.2 16.8<br />
Carbon Black 123.7 89.9 33.8 467.2 340.3 126.9<br />
Textiles 124.7 107.1 17.5 456.1 397.0 59.1<br />
Insulator 35.3 21.7 13.7 100.1 72.5 27.6<br />
37%<br />
15%<br />
38%<br />
Others 3.4 7.5 (4.1) 12.7 40.7 (28.0)<br />
Total 487.0 400.2 86.8 1,860.6 1,577.4 283.2<br />
Growth across businesses<br />
18%<br />
11
Revenue composition<br />
Textiles<br />
25%<br />
Insulator<br />
5%<br />
Others<br />
3%<br />
VFY<br />
21%<br />
Textiles<br />
25%<br />
Insulator<br />
5%<br />
Others<br />
1%<br />
VFY<br />
19%<br />
Carbon Black<br />
22%<br />
FY04<br />
Garments<br />
Carbon Black<br />
24% 25% <strong>FY05</strong><br />
Garments<br />
25%<br />
Garments, Carbon Black and Textiles contributes equally<br />
12
Operating Profits<br />
PBDIT<br />
263.3 264.0<br />
Rs. Cr.<br />
64.3<br />
9%<br />
70.2<br />
<strong>Q4</strong> FY 04 <strong>Q4</strong> FY 05<br />
FY 04 FY 05<br />
13
Segmental Operating Profit<br />
Rs. Cr.<br />
PBDIT<br />
4th Quarter<br />
Full Year<br />
2004-05 2003-04 Variance 2004-05 2003-04 Variance<br />
Garments 9.6 6.9 2.7 39.2 28.4 10.8<br />
VFY 21.8 24.0 (2.2) 87.6 99.4 (11.8)<br />
38%<br />
12%<br />
Carbon Black 20.8 19.1 1.8 77.2 79.6 (2.4)<br />
Textiles 9.6 6.9 2.7 33.3 23.8 9.6<br />
40%<br />
Insulator 7.9 6.6 1.3 21.6 21.4 0.2<br />
Others 0.5 0.8 (0.3) 5.1 10.7 (5.6)<br />
Total 70.2 64.3 5.8 264.0 263.3 0.8<br />
Garments and Textiles shows impressive growth<br />
14
Operating profit composition<br />
Textiles<br />
9%<br />
Insulator<br />
8%<br />
Others<br />
4%<br />
VFY<br />
38%<br />
Textiles<br />
13%<br />
Insulator<br />
8%<br />
Others<br />
2%<br />
VFY<br />
33%<br />
Carbon Black<br />
30%<br />
FY04<br />
Garments<br />
11%<br />
Carbon Black<br />
29%<br />
<strong>FY05</strong><br />
Garments<br />
15%<br />
Garments and Textiles share increased<br />
15
Net interest moves up<br />
Interest Expense<br />
Rs. Cr.<br />
Interest Income<br />
Rs. Cr.<br />
Full Year<br />
24.0 22.9<br />
Surplus fund used<br />
for Working capital<br />
and Capex<br />
9.2<br />
4.3<br />
4 th Quarter<br />
FY04<br />
5.3<br />
<strong>FY05</strong><br />
6.7<br />
FY04<br />
<strong>FY05</strong><br />
1.7 1.2<br />
16<br />
FY04<br />
<strong>FY05</strong><br />
FY04<br />
<strong>FY05</strong>
Exceptional Items<br />
Rs. Cr.<br />
Particulars<br />
4th Qtr<br />
Full Year<br />
2004-05 2003-04 2004-05 2003-04<br />
Voluntary Retirement Scheme at Rayon Division (0.6) - (9.5) -<br />
Gain on sale of Global Exports - - 4.0 -<br />
Gain/loss on Strategic Investments (0.3) - (2.1) 20.0<br />
Total (0.9) - (7.6) 20.0<br />
17
Financial <strong>Results</strong> (Standalone)<br />
Rs. Cr.<br />
Particulars<br />
4th Quarter<br />
Full Year<br />
2004-05 2003-04 Variance 2004-05 2003-04 Variance<br />
Net Sales 486.9 400.2 86.8 1,860.6 1,577.4 283.2<br />
Other Income 2.7 3.2 (0.6) 10.1 14.2 (4.2)<br />
Operating Profit (PBDIT) 70.2 64.3 5.9 264.0 263.3 0.8<br />
Less: Interest and Finance Expenses 6.7 5.3 (1.5) 23.0 24.0 1.0<br />
Add: Interest Income 1.2 1.7 (0.5) 4.3 9.2 (4.8)<br />
Gross Profit (before Royalty) 64.7 60.8 3.9 245.4 248.5 (3.0)<br />
Royalty - - - - 5.5 5.5<br />
Depreciation/ Amortisation 20.6 20.3 (0.3) 80.7 81.5 0.8<br />
Profit Before Tax and Exceptional Items 44.0 40.5 3.5 164.7 161.5 3.3 2%<br />
Exceptional Items (0.9) - (0.9) (7.6) 20.0 (27.6)<br />
Profit after Exceptional Items 43.2 40.5 2.7 157.1 181.4 (24.3)<br />
Provision for Taxation 3.6 12.9 9.3 43.4 50.2 6.8 14%<br />
18%<br />
Net Profit 39.5 27.6 12.0 113.7 131.3 (17.5) 13%<br />
Less: Exceptional Items (0.9) - (7.6) 20.0<br />
Tax thereon (0.2) - (3.5) -<br />
Net Profit before Exceptional Items 40.2 27.6 12.6 117.9 111.3 6.5 6%<br />
18
Business Performance
Garments: Strong performance continued<br />
m Fashion brands strengthened further<br />
à Successful conversion from “Shirt Brands” to “Wardrobe Brands”<br />
à Continued focus on innovative designs and technology<br />
m Louis Philippe and Peter England crosses Rs. 100 Cr revenue mark<br />
m Peter England rejuvenated; On a profitable growth trajectory<br />
à Portfolio enriched with launch of PE suits<br />
m Retail presence enhanced<br />
à 21 high quality stores opened during the year<br />
“Best apparel company<br />
of the year,2004” by IFFA<br />
m Volumes grew by 10%<br />
à Notwithstanding US Embargo on Contract Exports<br />
à Volume of branded business grew by 14%<br />
Market Leadership with Richer Product Mix<br />
20
Garments: Continued strong growth<br />
m Revenue up 21%<br />
à Significant contribution from higher price points and Value added products<br />
à Positioning of suits strengthened<br />
m PBDIT up by 70% at Rs. 39.2 Cr<br />
à Richer product mix with higher realization<br />
à Improved cost structure helped<br />
356.1<br />
Revenue (Rs. Cr.)<br />
326.1<br />
391.7 472.4<br />
FY02 FY03 FY04 <strong>FY05</strong><br />
m Ad spend at Rs. 44.6 Cr. contained at 9% of revenue<br />
à Effective media planning<br />
à Towards sustaining brand leadership<br />
à New showrooms opening<br />
ROCE (%)<br />
-3.3<br />
-7.3<br />
-0.8<br />
5.2<br />
Business ROCE turned positive<br />
FY02 FY03 FY04 <strong>FY05</strong><br />
21
Garments: Performance Summary<br />
Particulars<br />
4th Quarter<br />
Full Year<br />
Rs. Cr.<br />
2004-05 2003-04 2004-05 2003-04<br />
Sales Volumes (Lac Pcs.) 22.8 18.4 83.3 75.5<br />
Revenue 108.7 89.0 472.4 391.7<br />
21%<br />
Operating Profit 14.0 11.5 83.8 67.6<br />
Advt. Expenses 4.4 4.6 44.6 39.2<br />
PBDIT 9.6 6.9 39.2 28.4<br />
Royalty - - - 5.5<br />
PBDIT after Royalty 9.6 6.9 39.2 23.0<br />
70%<br />
PBIT 3.4 0.0 13.0 (1.8)<br />
Capital Employed 252.2 242.2 252.2 242.2<br />
ROCE (Annualised) (%) 5.4 0.1 5.2 (0.8)<br />
Benefits of scale to yield better returns<br />
22
Garments: Bright prospect ahead…<br />
m Industry growing at a rapid pace<br />
à Positive consumer sentiments aided by organized retail<br />
m Madura Garments to maintain industry leadership amidst challenging environment<br />
à Reap benefits of fast growing organized retail<br />
• Expanding “controlled retail” – a growth driver<br />
• Aggressive expansion plan; to be present in Upcoming Malls and High Street<br />
• New openings to deliver international retail experience<br />
à “Fashion Brands” becoming “LifeStyle Brands”<br />
• Constant enrichment of product mix<br />
à Peter England to be made a “Mega Brand”<br />
• Expand reach to masses<br />
• Supply chain management efforts<br />
à Be a niche player in Contract Exports<br />
• Design and delivery capabilities<br />
à Simultaneous focus on cost efficieny<br />
• Optimize Ad spend<br />
• Efficient management of discounting and outsourcing<br />
23
VFY: Higher volumes and stable prices<br />
m Market sentiments remained challenging<br />
à Pressure to liquidate accumulated stocks and cheap imports from China<br />
à At year end, industry stocks reduced from 60 days to 36 days<br />
m Satisfactory operating performance<br />
à 1,000 TPA CSY expansion stabilized<br />
à 106% utilization at expanded capacity<br />
à Aggressive marketing efforts reduced Indian Rayon’s stocks to 24 days<br />
m Encouraging Chemicals business performance<br />
à Increased volumes with higher capacity utilization<br />
à ECU realization up by 20%<br />
175<br />
Realisation (Rs./Kg)<br />
m Revenue up by 5% though margin<br />
declined from 30% to 25%<br />
165<br />
165<br />
160<br />
157<br />
151<br />
151<br />
151<br />
à Lower YoY realizations<br />
à Higher wood pulp / coal costs<br />
à VRS helped partially; however, full benefits to accrue next fiscal<br />
Q1 FY04 Q2 FY04 Q3 FY04 <strong>Q4</strong> FY04 Q1 <strong>FY05</strong> Q2 <strong>FY05</strong> Q3 <strong>FY05</strong> <strong>Q4</strong> <strong>FY05</strong><br />
24
VFY: Performance Summary<br />
Particulars<br />
4th Quarter<br />
Full Year<br />
Rs. Cr.<br />
2004-05 2003-04 2004-05 2003-04<br />
Production (Tons) 4,147 4,031 16,420 16,060<br />
Capacity Utilization (%) 103.7 107.5 105.9 107.1<br />
Sales Volumes (Tons) 4,085 4,024 16,445 15,694<br />
5%<br />
VFY Realisation (Rs./Kg.) 151 160 152 167<br />
Revenue- VFY 61.6 64.5 250.5 261.9<br />
- Chemical 29.6 20.4 101.5 73.3<br />
4%<br />
38%<br />
Revenue 91.2 84.9 352.0 335.2<br />
PBDIT 21.8 24.0 87.6 99.4<br />
PBIT 15.9 19.0 66.3 77.9<br />
12%<br />
Capital Employed 318.6 264.4 318.6 264.4<br />
ROCE (Annualised) (%) 20.0 28.8 20.8 29.5<br />
Higher VFY volumes and better ECU realization<br />
25
VFY: Prospects improving<br />
m Demand recovery to sustain<br />
à Improving export prospects for VFY based products<br />
m Strategic efforts to capitalize on emerging opportunities<br />
à Market development efforts to grow business further<br />
• Working with VFY end-users to improve their quality / productivity<br />
à Technological improvement to further improve quality<br />
m Simultaneous focus on reaping benefits of recent initiatives<br />
à CSY capacity utilization<br />
à Improving productivity with revised work norms and VRS<br />
m Capex initiatives<br />
à Work initiated on 20 MW captive power plant<br />
à Capacity addition of Caustic Soda by 85 TPD<br />
26
Carbon Black: Capturing volume growth<br />
m Volumes surged 40% to 165,095 MT<br />
à Rising domestic volumes; market share maintained<br />
à Enhanced capacity operating at 102%<br />
à Rising exports with greater penetration<br />
into Asian markets<br />
m Realization however declined 3% YoY<br />
à Impacted by duty reduction<br />
à Rising share of exports<br />
m Revenue grew by 37% to Rs. 467.2 Cr.<br />
à Higher volume and energy sales is key<br />
m Higher costs impacted profitability<br />
à CBFS cost higher by 5.6% YoY<br />
à High Sea-freight<br />
24,868<br />
m Operating profit and ROCE down marginally<br />
Volumes (MT)<br />
Q1<br />
FY04<br />
30,219<br />
Q2<br />
FY04<br />
30,047<br />
29,151<br />
Q1<br />
FY04<br />
Q2<br />
FY04<br />
29,847<br />
Q3<br />
FY04<br />
29,347<br />
Q3<br />
FY04<br />
<strong>Q4</strong><br />
FY04<br />
33,249<br />
40,899 41,170<br />
Q1<br />
<strong>FY05</strong><br />
Q2<br />
<strong>FY05</strong><br />
41,499<br />
Realisation (Rs./Ton)<br />
27,961 27,542<br />
27,032<br />
<strong>Q4</strong><br />
FY04<br />
Q1<br />
<strong>FY05</strong><br />
Q2<br />
<strong>FY05</strong><br />
Q3<br />
<strong>FY05</strong><br />
41,528<br />
<strong>Q4</strong><br />
<strong>FY05</strong><br />
28,779<br />
29,826<br />
Q3<br />
<strong>FY05</strong><br />
<strong>Q4</strong><br />
<strong>FY05</strong><br />
27
Carbon Black: Performance Summary<br />
Particulars<br />
4th Quarter<br />
Full Year<br />
Rs. Cr.<br />
Production (Tons)<br />
Capacity Utilization %<br />
Sales Volumes (Tons)<br />
Realisation (Rs./Ton)<br />
Revenue<br />
PBDIT<br />
PBIT<br />
Capital Employed<br />
ROCE (Annualised) (%)<br />
2004-05 2003-04 2004-05 2003-04<br />
41,138 31,169 164,025 118,707<br />
99.1 93.5 101.6 100.3<br />
41,528 33,249 165,095 118,182<br />
29,798 27,038 28,302 28,795<br />
123.7 89.9 467.2 340.3<br />
20.8 19.1 77.2 79.6<br />
16.2 15.1 60.3 64.7<br />
371.9 333.0 371.9 333.0<br />
17.5 18.2 16.2 19.4<br />
40%<br />
3%<br />
28
Carbon Black: Improving prospects<br />
m Domestic market outlook remains strong<br />
à Robust auto / tyre sector demand<br />
m Encouraging export prospects<br />
à Leveraging coastal location advantage<br />
m Focus on R&D for value added grades<br />
m Working with Tyre majors to reduce the impact of rising CBFS prices<br />
m Initiated work on 50,000 TPA brown-field expansion at Chennai<br />
Market mix optimization to help improving returns<br />
29
Textiles: Profits improve across segments<br />
m Linen fabric: Benefited from<br />
à Increased demand from growing usage<br />
• Worked with leading Brands for promoting use of Linen<br />
à Capacity enhancement and technology up-gradation<br />
m Flax yarn: Performance backed by higher volumes<br />
à Improved operational efficiency complemented<br />
m Worsted segment: Value added products and stable input prices helped to<br />
improve profitability<br />
m Synthetic Yarn: Rising share of specialty yarn coupled with increased<br />
productivity<br />
m Revenue up 15% YoY to Rs 456.1 Cr<br />
6.5<br />
ROCE (%)<br />
5.7<br />
4.3<br />
9.4<br />
m Operating profits jumped<br />
à From Rs. 23.8 Cr to Rs. 33.3 Cr<br />
m Business returns improved to 9%<br />
FY02 FY03 FY04 <strong>FY05</strong><br />
30
Textiles: Performance Summary<br />
Particulars<br />
4th Quarter<br />
Full Year<br />
Rs. Cr.<br />
2004-05 2003-04 2004-05 2003-04<br />
Sales-Fabric('000 Mtrs) 973 667 3,593 2,798<br />
Flax Yarn (Tons) 320 291 1,623 1,041<br />
Worsted (Tons) 1,192 1,152 4,381 4,302<br />
Synthetic (Tons) 3,087 2,842 11,425 10,676<br />
Revenue - Fabrics 20.9 12.9 74.2 51.8<br />
Flax Yarn 11.5 11.3 59.4 39.7<br />
43%<br />
50%<br />
Worsted 54.6 46.7 184.4 180.1<br />
Synthetic 37.7 36.2 138.1 125.4<br />
Total Revenue 124.7 107.1 456.1 397.0<br />
Operating Profit 9.6 6.9 33.3 23.8<br />
40%<br />
PBIT 6.4 3.2 19.8 6.6<br />
Capital Employed 211.3 153.4 211.3 153.4<br />
ROCE (Annualised) (%) 12.0 8.2 9.4 4.3<br />
500bps<br />
Strong performance of Linen Fabric and Flax Yarn<br />
31
Textiles: Performance set to improve<br />
m Increasing awareness of Linen fabric<br />
à To promote greater usage<br />
à Focus on wide availability across retail chains<br />
à Deeper penetration into the premium segment<br />
m Conversion of synthetic yarn facility to EOU<br />
à To focus on specialty yarns targeted at niche segment<br />
m Expansion of Wool combing by 4,000 TPA being completed in phased manner<br />
à To become fully operational by Jun-05<br />
32
Insulators: Domestic Marketing<br />
Rs. Cr.<br />
Particulars<br />
4th Quarter<br />
Full Year<br />
2004-05 2003-04 2004-05 2003-04<br />
Revenue 35.3 21.7 100.1 72.5<br />
PBDIT/ PBIT 7.9 6.6 21.6 21.4<br />
Capital Employed 21.0 20.0 21.0 20.0<br />
m Revenues up 38% to Rs. 100.1 Cr.<br />
à Share of direct sales volume increased from 42% to 67%<br />
m Volumes down 6% at 15,310 MT<br />
à Increased share of value added product<br />
m Operating profit maintained at Rs. 21.6 Cr.<br />
à Despite high input cost<br />
m Positive domestic demand outlook<br />
33
Insulator JV: Improvement efforts underway<br />
m Brownfield expansion of 8,000 TPA commissioned in Dec-04<br />
à Full benefits to accrue next fiscal<br />
à Production up by 6% at 25,469 MT<br />
m Improvement in yield of Transmission & Distribution products<br />
m Sales volume down at 24,412 MT<br />
à Lower volume in domestic market due to focus on high value added products<br />
à Exports lower due to relatively weak demand and stringent quality standards<br />
m Revenue marginally up at Rs. 168.8 Cr<br />
à Higher realization in domestic market<br />
m Losses incurred on account of<br />
à Higher rejections and process improvement initiatives<br />
à Higher input costs<br />
à Unutilized capacity due to lower exports<br />
m Performance to improve going forward<br />
à Volume growth and higher value products from expanded capacity<br />
à Quality and yield benefits from initiatives under way with NGK experts<br />
à Increased input cost to be passed neutralized by superior realization<br />
34
Insulators JV: Performance Summary<br />
Rs. Cr.<br />
Particulars<br />
Full Year<br />
2004-05 2003-04<br />
Production (Tons) 25,469 24,048<br />
Sales Volumes (Tons) 24,412 24,967<br />
Revenue 168.8 163.7<br />
PBDIT (15.6) (10.6)<br />
PBIT (23.4) (17.1)<br />
PAT (25.3) (14.2)<br />
Capital Employed 179.2 152.9<br />
<strong>IRIL</strong> Equity Investment 12.5 12.5<br />
Improvement efforts underway<br />
35
Life Insurance: Market share continue to grow<br />
m Strong market position; Improving market share<br />
25<br />
20<br />
15<br />
10<br />
5<br />
0<br />
Private Players<br />
m Distribution network strengthened further<br />
à 9,468 agents with higher productivity<br />
à Strong alternate channel with 114 Bancassurance/Corporate agents/Brokers<br />
• 25 added during the year<br />
à Branches increased to 44, 11 opened during the year<br />
• Reach increased to 30 cities<br />
<strong>Birla</strong> Sunlife (RHS)<br />
Q1 '04 Q2 '04 Q3 '04 <strong>Q4</strong> '04 Q1 '05 Q2 '05 Q3 '05 <strong>Q4</strong> '05<br />
à Tied up with 8 NGOs to enlarge rural presence<br />
“Best private Life Insurance company, 2004”*<br />
* By Outlook Money – Dec 2004<br />
4.0<br />
3.5<br />
3.0<br />
2.5<br />
2.0<br />
1.5<br />
1.0<br />
0.5<br />
0.0<br />
36
Life Insurance: Strong growth in Premium income<br />
m Premium income up 70% to Rs. 915.5 Cr<br />
Premium Income (Rs. Cr.)<br />
Average Ann Premium (Rs.)<br />
23120<br />
34550<br />
14140<br />
16580<br />
461.3<br />
607.4<br />
31.6 131<br />
FY02 FY03 FY04 <strong>FY05</strong><br />
à New Business Annualized Premium up by 31% to Rs. 607.4 Cr.<br />
• Impressive growth of 74% in Individual Life Business<br />
à Unit linked business contributed more than 98%<br />
à Product portfolio strengthened with launch of Woman first and Credit Guard plan<br />
m Average per policy premium improved by 49% to Rs. 34,550 for FY 2005 over FY<br />
2004<br />
m Losses decreased with higher share of renewal premium and is inline with plan<br />
m <strong>IRIL</strong> contributed Rs. 44.4 Cr. in FY 05; (cumulative investment Rs. 260.5 Cr.)<br />
37
Life Insurance: Performance Summary<br />
Particulars<br />
Full Year<br />
Rs. Cr.<br />
2004-05 2003-04<br />
New Business-Annualized Premium<br />
Individual Business 521.4 299.5<br />
Group Business 86.0 163.0<br />
Total New Business 607.4 462.6<br />
Premium Income<br />
First Year Premium 593.3 426.5<br />
Renewal Premium 294.2 87.7<br />
Single Premium 28.0 23.3<br />
Total Premium Income 915.5 537.5<br />
PBIT/PBT (60.6) (77.7)<br />
Share Capital 350.0 290.0<br />
31%<br />
70%<br />
22%<br />
Higher renewal income to fuel profitability<br />
No of Individual<br />
Policies issued<br />
increased 28%<br />
YoY at 198,281<br />
policies<br />
38
Life Insurance: Tapping high growth<br />
m Tap lower penetration of insurance with value differentiator<br />
à Strengthen the branch network<br />
• 11 to be added next year increasing reach to B & C cities<br />
à Improving agent productivity<br />
m Focus to remain on ULIP<br />
à Continuous improvement in product portfolio inline with market<br />
m Earning trust of customers<br />
à Superior returns with transparency<br />
• Launch of Crisil benchmark indices<br />
à Delivering superior customer value<br />
à Efficient policy administration through process improvement<br />
39
IT Services: EBITDA maintains positive trend<br />
m Software revenue flat at Rs 77.7 Cr<br />
à Focus on key clients in Banking, Finance and Insurance<br />
à Conscious efforts to exit non-core business viz. hardware business<br />
à New focus on Independent Software Vendor (ISV) segment<br />
m Healthy gross margin at 36% (26%)<br />
à Improving project profile<br />
à Share of high margin off-shore business increased to 31% vs. 20% last year<br />
à Improved manpower utilization at 75%<br />
m Positive EBIDTA of Rs. 1.8 Cr against negative EBITDA of Rs. 6.7 Cr<br />
m Focus on achieving sustainable profitability through:<br />
à Strengthening of marketing and delivery capabilities<br />
à Increased share of offshore developmental activities<br />
à Synergistic inorganic growth opportunities<br />
40
IT Services: Performance Summary<br />
Rs. Cr.<br />
Particulars<br />
Full Year<br />
2004-05 2003-04<br />
Software Revenue 77.7 76.9<br />
Hardware Revenue 4.4 9.1<br />
Total Revenue 82.1 86.0<br />
Gross Margin 29.5 22.7<br />
SG&A 27.7 29.4<br />
EBITDA 1.8 (6.7)<br />
PAT before excepional items (2.6) (18.2)<br />
Exceptional Items - (2.7)<br />
Looses curtailed<br />
by 88%<br />
PAT (2.6) (20.9)<br />
Capital Employed 19.7 25.3<br />
<strong>IRIL</strong> Equity Investment 100.3 100.3<br />
Positive EBITDA trend continued for the year<br />
41
BPO: Growth momentum sustained<br />
m Impressive ramp-up of expanded capacity<br />
à Improved capacity utilization post expansion<br />
Employees<br />
Seats<br />
m Enriched client portfolio<br />
à 6 new clients added during current fiscal<br />
à Business from existing clients ramping up<br />
à 8 clients with more than $ 1 Mn revenue<br />
m Revenues up 56% to Rs. 108.2 Cr<br />
m Business profits turned positive<br />
despite capacity expansion<br />
à Continued cost optimization<br />
à New push in Technical Support vertical<br />
1,656<br />
FY2005<br />
3,235<br />
1,005<br />
FY2004<br />
1,846<br />
Revenue (Rs. Cr.)<br />
36.6<br />
23.9 26.8<br />
23.1<br />
18.7<br />
20.9<br />
15.5<br />
Q2 FY04 Q3 FY04 <strong>Q4</strong> FY04 Q1 <strong>FY05</strong> Q2 <strong>FY05</strong> Q3 <strong>FY05</strong> <strong>Q4</strong> <strong>FY05</strong><br />
42
BPO: Performance Summary<br />
Particulars<br />
Full Year<br />
Rs. Cr.<br />
2004-05 2003-04<br />
No of Op Seats 1,656 1,005<br />
No of Employees 3,235 1,846<br />
Voice 87.6 57.3<br />
Non-Voice 20.7 12.2<br />
Revenue 108.2 69.4<br />
56%<br />
PBDIT 14.2 2.9<br />
PBIT 2.5 (3.7)<br />
PAT 1.0 (4.1)<br />
Turned<br />
positive<br />
Capital Employed 61.5 53.8<br />
<strong>IRIL</strong> investment 68.8 68.8<br />
Profits follow revenue growth and new capacity utilization<br />
43
BPO: Well placed for high growth<br />
m Industry growth forecasts impressive<br />
m Heightened growth momentum through:<br />
à Quality clientele<br />
• Strong focus on new and existing clients<br />
à Improved asset utilization through<br />
• Optimum mix of voice and non voice business<br />
• Inbound vs. Outbound in voice business<br />
à Robust delivery capabilities<br />
• Improved SLAs<br />
• World Class facilities<br />
m Sustain growth momentum through<br />
à Capacity addition<br />
à Pursue value accretive inorganic growth<br />
m High attrition remains a key challenge<br />
à Though an industry wide phenomenon<br />
44
Significant transformation in recent years<br />
De-merger of<br />
Cement business<br />
through a<br />
Group-wide<br />
Restructuring<br />
Acquisition of<br />
Madura<br />
Garments<br />
Insurance Joint<br />
Venture with Sun<br />
Life of Canada<br />
De-merger of<br />
Insulators into a<br />
JV with NGK of<br />
Japan<br />
Carbon Black<br />
Brownfield<br />
Expansion at<br />
Gummidipoondi<br />
1998 1999 2000 2001 2002 2003 2004<br />
Closure of<br />
unviable Sea<br />
Water Magnesia<br />
project<br />
Buy-back of<br />
equity shares<br />
Acquisition of<br />
PSI Data System<br />
From Group Bull<br />
SA, France<br />
Foray into the<br />
BPO sector<br />
through the<br />
acquisition of<br />
Transworks<br />
All-round<br />
growth/<br />
consolidation<br />
across diversified<br />
business<br />
Entry into new businesses with high growth-potential<br />
45
New business gaining growth<br />
New business revenues<br />
as % of aggregate Revenues<br />
Rs. Crores<br />
3,500<br />
3,000<br />
Traditional Businesses<br />
Insurance<br />
New businesses as % of total sales<br />
Garments<br />
Software/ BPO<br />
53%<br />
45%<br />
2,500<br />
2,000<br />
23%<br />
27%<br />
31%<br />
1,500<br />
5%<br />
1,000<br />
500<br />
0<br />
FY00 FY01 FY02 FY03 FY04 <strong>FY05</strong><br />
New business impact to be more prominent in coming years,<br />
helped by success of strategic efforts<br />
46
Capex and Investment Plan<br />
A<br />
Particulars Total Spending Plan<br />
Plan<br />
FY06-FY08 FY 2006 FY 2007 FY 2008<br />
Project Based<br />
Rs. Cr.<br />
VFY / Chemical 165.0 70.2 58.4 36.4<br />
Carbon Black 103.5 94.0 9.5<br />
Textiles 23.9 23.9<br />
Sub-Total A 292.4 188.1 67.9 36.4<br />
B Modernization<br />
VFY / Chemical 33.4 33.4<br />
Garments 119.9 50.0 36.1 33.8<br />
Carbon Black 20.3 16.2 4.1<br />
Textiles 13.5 12.1 1.4<br />
Others 0.5 0.5<br />
Sub-Total B 187.6 112.3 41.6 33.8<br />
C Total Capex at <strong>IRIL</strong> (A+B) 480.1 300.3 109.5 70.2<br />
D Investment in Insurance 155.4 88.8 66.6<br />
E Total Capital Outlay (C+D) 635.5 389.1 176.1 70.2<br />
F Major Capex in JV/ Subsidiaries/Satcos<br />
Insulators 16.0 16.0<br />
BPO 21.3 21.3<br />
Satcos 33.7 25.9 7.8 -<br />
Sub-Total F 71.0 63.2 7.8 -<br />
Grand Total (E+F) 706.4 452.3 183.9 70.2<br />
47
Growth Outlook<br />
Business<br />
Garments<br />
VFY<br />
Carbon Black<br />
Textiles<br />
Insulator-JV<br />
Life Insurance<br />
IT Services<br />
Outlook<br />
Positive<br />
Moderate<br />
Positive<br />
Positive<br />
Moderate<br />
Positive<br />
Moderate<br />
Growth drivers<br />
Growth driven by retail expansion, positive market sentiments and<br />
growth initiatives<br />
Thrust on quality, captive power plant and buoyant chlor-alkali segment<br />
should help in offsetting the present difficult market conditions<br />
Proposed expansion should push volumes, however, volatile CBFS<br />
prices remains cause of concern<br />
Focus on niche areas and positive textile environment post WTO<br />
JV should contribute with stabilization of new kiln and quality efforts<br />
Strong market position should help in achieving positive profits from<br />
FY 2007<br />
Reinforced leadership team and focus on marketing should help in<br />
breaking the growth barrier<br />
BPO<br />
Positive Further expansion and new clients should make business achieve<br />
targeted profitability<br />
Indian Rayon on a profitable growth trajectory<br />
48
In Sum…<br />
Profitable Growth<br />
with<br />
GARMENTS<br />
INSURANCE<br />
IT SERVICES<br />
IT SERVICES<br />
BPO BPO<br />
CARBON BLACK<br />
INSULATORS<br />
VFY<br />
TEXTILES<br />
Dedicated to deliver better results quarter after quarter<br />
49
Annexure
Profitability Snapshot – Indian Rayon Standalone<br />
Full Year<br />
Rs. Cr.<br />
2004-05 2003-04 2002-03<br />
Gross Turnover 1,987.8 1,717.6 1,593.4<br />
Net Turnover 1,860.6 1,577.4 1,442.4<br />
PBDIT 264.0 257.8 240.2<br />
PBDIT Margin (%) 14.2 16.3 16.7<br />
PBIDT (Rs. Crs.)<br />
300<br />
275<br />
250<br />
225<br />
200<br />
175<br />
150<br />
125<br />
100<br />
75<br />
50<br />
13.6<br />
192<br />
PBDIT PBDIT Margin (%)<br />
16.7<br />
16.4<br />
14.2<br />
240<br />
258 264<br />
25<br />
20<br />
15<br />
10<br />
5<br />
PBIDT Margin (%)<br />
Net Interest 18.6 14.8 21.7<br />
PBDT 245.4 243.0 218.5<br />
PAT before<br />
exceptional items 121.4 111.3 112.5<br />
25<br />
0<br />
75<br />
65<br />
FY2002 FY2003 FY2004 FY 2005<br />
Net Interest Interest Cover (x) (PBDIT/ Net Interest)<br />
17.4<br />
0<br />
20<br />
PAT 113.7 131.3 105.3<br />
55<br />
14.2<br />
15<br />
PAT Margin (%) 6.1 8.3 7.3<br />
EPS (Rs.) 19.0 21.9 17.6<br />
CEPS (Rs.) 32.1 36.5 33.8<br />
Dividend (%) 40.0% 40.0% 37.5%<br />
Interest Cover (x)<br />
(PBDIT/ Net Interest) 14.2 17.4 11.1<br />
Annexure I<br />
Net Interest (Rs. Crs.)<br />
45<br />
35<br />
25<br />
15<br />
5<br />
(5)<br />
11.1<br />
46<br />
4.2<br />
22<br />
19<br />
15<br />
FY2002 FY2003 FY2004 FY2005<br />
10<br />
5<br />
0<br />
Interest Cover (x)<br />
51
Balance Sheet Snapshot – Indian Rayon Standalone<br />
Full Year<br />
2004-05 2003-04 2002-03<br />
Equity 59.9 59.9 59.9<br />
Rs. Cr.<br />
Net Worth 1,354.1 1,267.7 1,170.8<br />
Net Worth Capital Employed Total Debt: Equity (x)<br />
Long Term Debt 240.9 180.1 175.2<br />
Short Term Debt 207.7 194.3 70.1<br />
Total Debts 448.6 374.3 245.3<br />
Capital Employed 1,802.7 1,642.0 1,416.1<br />
Net Block 810.3 740.4 691.0<br />
Net Working Capital 418.3 287.5 337.2<br />
Deferred Tax Liabilities (125.5) (127.5) (126.4)<br />
Strategic Investments 618.3 581.6 412.2<br />
Rs. Crores<br />
2,000<br />
1,800<br />
1,600<br />
1,400<br />
1,200<br />
1,000<br />
800<br />
600<br />
400<br />
200<br />
0.4<br />
1,533<br />
1,091<br />
1,416<br />
1,171<br />
0.2<br />
1,642<br />
1,268<br />
0.3<br />
1,803<br />
0.3<br />
1,354<br />
0.45<br />
0.4<br />
0.35<br />
0.3<br />
0.25<br />
0.2<br />
0.15<br />
0.1<br />
0.05<br />
Other Investments 81.3 160.0 102.1<br />
Total Investments 699.7 741.6 514.3<br />
0<br />
FY2002 FY2003 FY2004 FY2005<br />
0<br />
ROACE (at PBIT) (%) 14.2 11.5 11.4<br />
ROANW (at PAT) (%) 8.7 10.8 9.3<br />
Book Value (Rs.) 226.1 211.7 195.5<br />
Total Debt Equity (x) 0.33:1 0.3:1 0.21:1<br />
Annexure II<br />
Long Term Debt Equity (x) 0.18:1 0.14:1 0.15:1<br />
Market Capitalisation 2,390.7 1,131.4 450.9<br />
52
Segmental Performance – Indian Rayon Standalone<br />
4th Quarter<br />
Particulars<br />
Annexure III<br />
Rs. Cr.<br />
Revenue PBIT Average Capital Employed ROCE (%) (PBIT basis)<br />
2004-05 2003-04 2004-05 2003-04 2004-05 2003-04 2004-05 2003-04<br />
Garments 108.7 89.0 3.4 0.0 243.8 241.4 5.6 0.1<br />
VFY 91.2 84.9 15.9 19.0 299.7 265.3 21.3 28.7<br />
Carbon Black 123.7 89.9 16.2 15.1 356.3 309.0 18.2 19.6<br />
Textiles 124.7 107.1 6.4 3.2 197.1 156.4 12.9 8.1<br />
Insulators 35.3 21.7 7.9 6.6 19.7 18.3 160.9 144.6<br />
Others (Argon Gas, Trading) 3.4 7.5 1.9 1.4 13.3 19.0 56.8 28.4<br />
Total Operating Assets 487.0 400.2 51.8 45.3 1,129.9 1,009.5 18.3 18.0<br />
Corporate Assets - - (2.2) (1.3) 663.1 599.6 (1.3) (0.9)<br />
Total 487.0 400.2 49.6 44.0 1,793.0 1,609.1 11.1 10.9<br />
Full Year<br />
Particulars<br />
Revenue PBIT Average Capital Employed ROCE (%) (PBIT basis)<br />
2004-05 2003-04 2004-05 2003-04 2004-05 2003-04 2004-05 2003-04<br />
Garments 472.4 391.7 13.0 (1.8) 247.2 221.3 5.3 (0.8)<br />
VFY 352.0 335.2 66.3 77.9 291.5 262.7 22.7 29.7<br />
Carbon Black 467.2 340.3 60.3 64.7 352.4 300.9 17.1 21.5<br />
Textiles 456.1 397.0 19.8 6.6 182.4 164.1 10.9 4.0<br />
Insulators 100.1 72.5 21.6 21.4 20.5 12.0 105.6 178.7<br />
Others (Argon Gas, Trading) 12.7 40.7 6.2 4.5 15.0 19.4 41.3 23.3<br />
Total Operating Assets 1,860.6 1,577.4 187.3 173.3 1,109.0 980.3 16.9 17.7<br />
Corporate Assets - - (3.9) 3.0 627.0 548.7 (0.6) 0.6<br />
Total 1,860.6 1,577.4 183.3 176.3 1,736.0 1,529.1 10.6 11.5<br />
53
Consolidated Financials<br />
Growth in consolidated revenue<br />
Rs. Cr.<br />
Particulars<br />
Revenue Net Profit<br />
Investment 2004-05 2003-04 2004-05 2003-04<br />
A <strong>IRIL</strong> 1,861 1,577 114 131<br />
Subsidiaries :<br />
IT Services 100 82 86 (3) (21)<br />
Insurance 261 956 545 (61) (78)<br />
BPO 69 108 57 1 (2)<br />
Overseas Subsidiary/Investment Company 15 1 1 1 (0)<br />
Total Subsidiaries 444 1,147 690 (61) (101)<br />
Less : Minority Interest (16) (20)<br />
B <strong>IRIL</strong> Share in Subsidiaries 444 1,147 690 (46) (81)<br />
Joint Venture :<br />
Insulators 12 84 82 (13) (7)<br />
Telecom 97 97 56 3 (10)<br />
C Share in Joint Venture 109 182 137 (9) (17)<br />
D Consolidated for <strong>IRIL</strong> Group (A+B+C) 554 3,189 2,404 59 33<br />
54
Financial snapshot: Indian Rayon Consolidated<br />
Profitability Snapshot<br />
Balance Sheet Snapshot<br />
Particulars<br />
Full Year<br />
2004-05 2003-04 2002-03<br />
Gross Turnover 3,325.6 2,551.9 1,927.3<br />
Net Turnover 3,189.3 2,404.3 1,772.0<br />
PBDIT 279.4 204.2 198.5<br />
PBDIT Margin (%) 8.8 8.5 11.2<br />
Net Interest 37.1 32.4 40.8<br />
PBDT 242.3 171.8 157.8<br />
Net Profit 58.6 33.1 36.7<br />
Net Profit Margin (%) 1.8 1.4 2.1<br />
EPS (Rs.) 9.8 5.5 6.1<br />
CEPS (Rs.) 31.2 27.4 28.8<br />
Dividend (%) 40.0% 40.0% 37.5%<br />
Interest Cover (x) (PBDIT/ Net<br />
Interest) 7.53 6.31 4.87<br />
Particulars<br />
Full Year<br />
2004-05 2003-04 2002-03<br />
Equity 59.9 59.9 59.9<br />
Net Worth 1,093.9 1,062.6 1,059.4<br />
Preference Share Capital 20.7 20.7 16.1<br />
Advance against equity - - 4.8<br />
Minority Interest 27.6 27.8 19.4<br />
Total Debts 717.0 556.8 412.9<br />
Capital Employed 1,859.3 1,668.0 1,512.5<br />
Policyholders and other funds 1,212.3 539.1 110.1<br />
Total Liabilities 3,071.5 2,207.1 1,622.7<br />
Goodwill on consolidation 185.2 153.8 104.9<br />
Net Block 1,110.1 993.6 949.1<br />
Net Working Capital 433.3 307.8 346.2<br />
Deferred Tax Liabilities (125.7) (127.6) (128.4)<br />
Investments 1,468.6 876.3 342.5<br />
Life Insurance Investments 1,333.0 639.9 174.2<br />
Other Investments 135.6 236.4 168.4<br />
Miscelleneous Expenditure - 3.0 8.4<br />
ROCE (at PBIT) (%) 7.1 4.6 6.0<br />
RONW (at PAT) (%) 5.4 3.1 3.5<br />
Book Value (Rs.) 183 177 177<br />
Total Debt Equity (x) 0.66:1 0.52:1 0.39:1<br />
55
Production: <strong>Q4</strong> FY 2005<br />
Particulars<br />
Units<br />
4th Quarter: 2004-05 4th Quarter: 2003-04<br />
* *<br />
Capacity Production % Capacity Production %<br />
VFY Tons 4,000 4,147 104% 3,750 4,031 107%<br />
Carbon Black Tons 41,500 41,138 99% 33,333 31,169 94%<br />
YARNS Spdl/MT MT Spdl/MT MT<br />
Worsted<br />
Flax<br />
Synthetic<br />
Total<br />
Tons<br />
Tons<br />
Tons<br />
Tons<br />
5,284 1,154 5,284 1,150<br />
1,484 294 1,484 311<br />
12,577 2,925 12,577 2,614<br />
19,345 4,373 19,345 4,075<br />
* Effective Capacity<br />
56<br />
Annexure IV
Production: FY 2005<br />
Particulars<br />
Units<br />
*<br />
Full Year: 2004-05 Full Year: 2003-04<br />
Capacity Production % Capacity Production %<br />
*<br />
VFY Tons 15,500 16,420 106% 15,000 16,060 107%<br />
Carbon Black* Tons 161,500 164,025 102% 118,333 118,707 100%<br />
YARNS Spdl/MT MT Spdl/MT MT<br />
Worsted<br />
Flax<br />
Synthetic<br />
Total<br />
Tons<br />
Tons<br />
Tons<br />
Tons<br />
21,136 4,362<br />
21,136<br />
4,284<br />
5,936 1,624<br />
5,936<br />
1,046<br />
50,308 11,441<br />
50,308<br />
10,336<br />
77,380 17,427 77,380 15,665<br />
* Effective Capacity<br />
57<br />
Annexure V
Sales Volume and Realization: <strong>Q4</strong> FY 2005<br />
Volume<br />
Particulars Units 4th Quarter<br />
Units<br />
Realisation<br />
4th Quarter<br />
2004-05 2003-04 2004-05 2003-04<br />
VFY Tons 4,085 4,024 Rs./Kg. 151 160<br />
Garments Lac Pcs. 22.8 18.4 -<br />
Carbon Black Tons 41,528 33,249 Rs./MT 29,798 27,038<br />
YARNS<br />
Worsted Tons 1,192 1,152 Rs./Kg. 458 405<br />
Flax Tons 320 291 Rs./Kg. 358 389<br />
Synthetic Tons 3,087 2,842 Rs./Kg. 122 127<br />
Total Yarn Tons 4,599 4,285 Rs./Kg. - -<br />
Fabric 000 Mtrs 973 667 Rs./Mtr 215 194<br />
58<br />
Annexure VI
Sales Volume and Realization: FY 2005<br />
Volume<br />
Volume<br />
Realisation<br />
Particulars Units Full Year<br />
Units<br />
Full Year<br />
2004-05 2003-04 2004-05 2003-04<br />
VFY Tons 16,445 15,694 Rs./Kg. 152 167<br />
Garments Lac Pcs. 83.3 75.5 -<br />
Carbon Black Tons 165,095 118,182 Rs./MT 28,302 28,795<br />
YARNS<br />
Worsted Tons 4,381 4,302 Rs./Kg. 421 419<br />
Flax Tons 1,623 1,041 Rs./Kg. 366 381<br />
Synthetic Tons 11,425 10,676 Rs./Kg. 121 117<br />
Total Yarn Tons 17,429 16,019 Rs./Kg. - -<br />
Fabric 000 Mtrs 3,593 2,798 Rs./Mtr 207 185<br />
59<br />
Annexure VII
Cautionary Statement<br />
Statements in this “Presentation” describing the Company’s objectives, projections, estimates, expectations or predictions may be “forward<br />
looking statements” within the meaning of applicable securities laws and regulations. Actual results could differ materially from those<br />
expressed or implied. Important factors that could make a difference to the Company’s operations include global and Indian demand supply<br />
conditions, finished goods prices, feed stock availability and prices, cyclical demand and pricing in the Company’s principal markets,<br />
changes in Government regulations, tax regimes, economic developments within India and the countries within which the company<br />
conducts business and other factors such as litigation and labour negotiations. The Company assume no responsibility to publicly amend,<br />
modify or revise any forward looking statement, on the basis of any subsequent development, information or events, or otherwise.<br />
Indian Rayon And Industries Limited<br />
Regd. Office: Junagadh-Veraval Road, Veraval – 366 266 (Gujarat)<br />
Corporate Office: 4th Floor ‘A’ Wing, <strong>Aditya</strong> <strong>Birla</strong> Center, S.K. Ahire Marg, Worli, Mumbai – 400 030<br />
Website: www.adityabirla.com or www.indianrayon.com<br />
Email: Irilcfd@adityabirla.com<br />
60
PRESS RELEASE Mumbai, 27 th April 2005<br />
AN ADITYA BIRLA GROUP COMPANY<br />
INDIAN RAYON AND INDUSTRIES LIMITED<br />
REPORTS PERFORMANCE<br />
FOR THE FOURTH QUARTER AND THE YEAR ENDED 31 st MARCH 2005<br />
Full Year<br />
4 th Quarter<br />
Net Sales Rs. 1860.62 Cr Rs. 486.95 Cr<br />
18% 22%<br />
Net Profit before Exceptional items Rs. 117.88 Cr 6% Rs. 40.21 Cr<br />
46%<br />
Particulars<br />
Rs. Crores<br />
Three Months ended 31st March Year ended 31st March<br />
2005 2004 Growth 2005 2004 Growth<br />
% Audited Audited %<br />
Net Income from Operations 486.95 400.18 21.7 1,860.62 1,577.38 18.0<br />
Profit before Depreciation & Tax 64.67 60.80 6.4 245.42 243.00 1.0<br />
Profit Before Tax and Exceptional Items 44.04 40.51 8.7 164.73 161.48 2.0<br />
Exceptional Item: VRS / Gain/ (Loss) on long term<br />
strategic investments/ transfer of business (net) (0.89) - - (7.65) 19.95 (138.3)<br />
Profit Before Tax 43.15 40.51 6.5 157.08 181.43 (13.4)<br />
Provision for Tax 3.62 12.94 72.0 43.36 50.15 13.5<br />
Net Profit 39.53 27.57 43.4 113.72 131.28 (13.4)<br />
Less: Exceptional Items (0.89) - (7.65) 19.95<br />
Tax thereon (0.21) - (3.49)<br />
Net Profit before Exceptional Items 40.21 27.57 45.8 117.88 111.33 5.9<br />
Indian Rayon, a major <strong>Aditya</strong> <strong>Birla</strong> Group Company, has reported a turnover of Rs. 1860.62 Crores for<br />
the year ended 31 st March 2005, a growth of 18.0% over the previous year’s turnover of Rs. 1577.38<br />
Crores.<br />
The Garments and Textiles business grew in revenues with a richer product mix, while Carbon Black<br />
witnessed volume growth.<br />
Profit before Tax and exceptional items at Rs.164.73 Crores is higher by 2.0%. The performance of<br />
Garments and Textile Division was partly offset by lower contribution from VFY and Carbon Black.<br />
Exceptional items – VRS at Rayon division Rs.9.54 Crores and gain on sale of investments/business<br />
Rs.1.89 Crores against profit of Rs. 19.95 Crores in the previous year have affected the net profit<br />
Net profit for the year is Rs.113.72 Crores against Rs. 131.28 Crores in the previous year.<br />
Dividend<br />
The Board of Directors has recommended a dividend of 40% for the current year same as that of last<br />
year. The company will also pay a dividend tax of 14.02 %.The dividend outgo will therefore be Rs.<br />
27.31 Crores.<br />
1
Divisional Performance<br />
Particulars<br />
Sales Volume<br />
Net Sales (Rs. Crores.)<br />
Unit Year ended 31st March<br />
Year ended 31st March<br />
2005 2004 2005 2004<br />
Garments Lac Pcs. 83.3 75.5 472.40 391.68<br />
Viscose Filament Yarn Tons 16,445 15,694 352.00 335.17<br />
Carbon Black Tons 165,095 118,182 467.25 340.30<br />
Textiles 456.12 397.00<br />
Madura Garments<br />
The Garments Division has maintained its market leadership. Revenues have grown by 20.6% to Rs.<br />
472.40 Crores vis-à-vis Rs. 391.68 Crores recorded in the previous year with the divisional operating<br />
profit growing by 70.5% to Rs. 39.20 Crores against Rs. 22.98 Crores last year. Two of the power<br />
brands – Louis Philippe in the fashion segment and Peter England in the popular segment have<br />
crossed the Rs. 100 Crores mark in revenues. Improved sales of higher price point products have<br />
boosted realisations and top line growth. Suits, Blazers and jackets have performed well and have<br />
contributed towards a richer product mix.<br />
The opening of 21 stores during the year has bolstered retail presence and the division has an<br />
aggressive retail expansion plan for the future both in malls and in High streets. Consistent brand<br />
building efforts, development of innovative merchandise and aggressive campaigns for each of the<br />
brands, have accelerated brand growth and equity with consumers.<br />
Madura Garments received the ‘Best Apparel Company of the Year’ award at the Images Fashion<br />
Awards 2004 for the second consecutive year and at CMAI. The other accolades showered on it<br />
include “Allen Solly – Best Trouser Brand of the Year”, “Allen Solly Women’s Wear – Most Admired<br />
Women’s Wear Brand of the Year”, Louis Philippe and Allen Solly amongst top 100 Superbrands.<br />
Madura Garment will continue to be an industry leader. Its focus will be on building further on consumer<br />
equity and market share in a competitive market. Delivering international standard retail experience at<br />
the new stores being opened will be a thrust area.<br />
Rayon Division<br />
The Rayon Division’s revenues at Rs. 352.00 Crores are higher by 5.0% compared to Rs. 335.17<br />
Crores in the previous year. VFY realisations were effected with high industry stock and increased<br />
import from China. Despite this, sales volume rose by 4.8% to 16,445 tonnes on the back of<br />
stabilization of the 1,000 tonnes Continuous Spinning Yarn (CSY) capacity and 105.9% utilisation of the<br />
expanded capacity.<br />
The chlor-alkali segment has been buoyant. The chemical plants were operating at 108.3% of capacity.<br />
Better ECU realization also complemented the revenues.<br />
To insulate itself from the present difficult market conditions, the company has embarked upon an<br />
ambitious program of quality improvement and cost reduction. The company has successfully<br />
implemented the revised work norms pursuant to long-term settlement with workers, which shall result<br />
in improvement in productivity by 35%. Capex initiatives include raising Caustic Soda capacity by 85<br />
tonnes per day through de-bottlenecking and setting up a captive power plant of 20 MW.<br />
Carbon Black Division<br />
Carbon Black Division’s revenues at Rs. 467.25 Crores are up by 37.3% vis-à-vis Rs. 340.30 Crores<br />
attained in the previous year. Sales volume grew by 39.7% to 165,095 tonnes, benefiting from the<br />
40,000 tonnes brownfield expansion, completed in March-04 and 10,000 tonnes added through debottlenecking.<br />
The Plant operated at 101.6% of the expanded capacity. Even as increased demand in<br />
the domestic market is being catered to, export volumes rose to augment sales.<br />
2
Volatile crude oil prices remain a cause of concern. Realisation has improved with the pass on of the<br />
high CBFS cost to the customers. The Division’s emphasis will be on maximising realization through<br />
passing on the increase in feedstock cost and proactively managing its procurement.<br />
The Company has initiated work on the 50,000 tonnes brown-field expansion at Chennai at a capex of<br />
Rs. 105 Crores.<br />
Textiles Division<br />
The Textiles Division’s revenues have gone up 14.9% to Rs. 456.12 Crores as against Rs. 397.00<br />
Crores in the previous year. Profits improved across all the product ranges. Exports constituted about<br />
46% of the Division’s revenues. The Worsted segment has gained from value added yarns and stable<br />
wool prices. Flax yarn performance has bettered with the modernisation of the plant. The Linen fabric<br />
has profited from retailing initiatives and the addition of 20 looms (1,15,000 mtrs per month). Expansion<br />
of Wool combing facility by 4,000 TPA is operational with the installation of first card, the balance two<br />
cards will be installed in the next 2 months. A capex of Rs 22.5 Crores has been planned for the<br />
expansion and modernisation of Flax yarn and Linen Fabric facilities.<br />
Insulators Domestic Marketing<br />
The Division’s revenues stood at Rs. 100.12 Crores. The outlook for the insulator business is promising<br />
given the power sector reforms, which will hike demand in the transmission and distribution segment.<br />
Consolidated Performance<br />
The Company’s Consolidated revenues jumped 33.0% from Rs. 2404.25 Crores to Rs. 3189.26 Crores.<br />
With the growth of new businesses, Indian Rayon’s JVs and Subsidiaries have contributed 42% to the<br />
consolidated revenue, led by the life Insurance business.<br />
The Consolidated net profit surged 77.2% at Rs. 58.64 Crores. BPO business has turned positive for<br />
the whole year. IT business losses have come down drastically. In Life insurance business losses have<br />
been pruned with the benefit of higher renewal business. A poor export market and higher input cost<br />
has adversely impacted the Company’s Insulator JV.<br />
Joint Ventures and Subsidiaries<br />
The Company’s joint ventures and subsidiaries are on track.<br />
BIRLA NGK Insulators Private Limited has posted marginal growth in turnover to Rs. 168.83 Crores. Its<br />
brown-field expansion of 8,000 tonnes has been commissioned in Dec-04, which will enhance volumes.<br />
Guided by NGK experts, yield improvement efforts are being pursued.<br />
<strong>Birla</strong> Sun Life Insurance Company has recorded a jump of 31.3% in annualised premium income from<br />
new business to Rs. 607.42 Crores. The total premium income has grown by 70.3% to Rs. 915.47<br />
Crores. The business continues to retain the number 2 position amongst private life insurance<br />
Companies with 10% credit to single premium policy in line with international practice. The Company is<br />
a front-runner in unit-linked products and alternate channel distribution. The Company is focusing on<br />
increasing the distribution network by opening 11 new branches by June-05. It currently has a presence<br />
in 33 cities across the country with 44 branches.<br />
The IT Services business has reversed the downward trend in performance and has turned EBITDA<br />
positive for the year. Revenues stood at Rs. 82.13 Crores. The company has increased its focus on<br />
Banking, Financial and Insurance (BFI) verticals and the Independent Software Vendor (ISV) segment,<br />
with greater thrust on high margin business.<br />
The BPO business revenues have grown significantly from Rs. 69.43 Crores in the previous year to Rs.<br />
108.23 Crores, while seat capacity has increased to 1,656 and headcount to 3,235. The Company is<br />
striving to further augment its client base and improve its seat utilization.<br />
3
Growth outlook<br />
The sector wise outlook for the company is promising<br />
• Madura Garment’s growth will be driven by retail expansion, positive market sentiments and<br />
growth initiatives<br />
• VFY will gain from thrust on quality, captive power plant and a buoyant chlor-alkali segment<br />
• Carbon Black will grow with volumes aided by proposed expansion, though volatile CBFS<br />
prices may remain a cause of concern<br />
• Textiles will benefit from its focus on niche areas and a positive textile environment post WTO<br />
• The Insulator- JV should contribute positively with the stabilisation of its new kiln and quality<br />
efforts<br />
• Life insurance will yield profits from FY 2007 inline with the plan<br />
• IT Services – reinforcement of its leadership team and focus on marketing will fuel growth.<br />
• BPO – is geared to enhance performance by further expansion and new clients addition<br />
Conclusion<br />
Overall, the outlook for the Company is optimistic given the strategic thrust, growth and the capex<br />
initiatives taken in each of the businesses.<br />
Mr. Sanjeev Aga appointed as Managing Director<br />
Mr. Sanjeev Aga has been named the Managing Director of Indian Rayon by the Board, from the 1st of<br />
May, 2005 and will report to the Chairman.<br />
Indian Rayon has emerged as the <strong>Aditya</strong> <strong>Birla</strong> Group’s vehicle for investment into new businesses such<br />
as garments, insurance, IT/ITES, and others, and has several JVs, e.g., with Sun Life Financial Inc.,<br />
Canada, and NGK Insulators, Japan.<br />
Given the diversity of businesses, the ambitious future plans of the company, and to sharpen<br />
governance practices, Mr. Aga will provide leadership for critical aspects of its business processes such<br />
as capital allocation, performance monitoring, and strengthening the strategy for each business within<br />
the overall strategic framework of Indian Rayon. While these roles are effectively played by the<br />
respective Heads of Business for their own business, for the company as a whole, Mr. Aga would serve<br />
as the nodal point - synergising and driving a coordinated approach into the future.<br />
Mr. Aga, 53, joined as a Director on the Board of the <strong>Aditya</strong> <strong>Birla</strong> Management Corporation in April<br />
2002, and has since been overseeing Indian Rayon’s IT, ITES and Insulators businesses. He was<br />
earlier the Chief Executive of the Group’s telecom JV, Idea Cellular. Beginning his career with Asian<br />
Paints, Mr. Aga rose to occupy senior positions in industry. Prior to joining <strong>Birla</strong> AT&T, he was<br />
Managing Director of Blow Plast.<br />
Mr. Aga is an Honours graduate in Physics from St. Stephen’s College, Delhi, and post graduated from<br />
IIM Kolkata.<br />
Mr. G.P. Gupta – appointed Director of the Company<br />
The board has also co-opted Mr. Gupta as a director of the company. He is a director on the board of<br />
various companies. He was earlier the Chairman of IDBI and UTI.<br />
Dt : 27th April, 2005<br />
Indian Rayon And Industries Limited<br />
Regd. Office: Junagadh-Veraval Road, Veraval – 366 266 (Gujarat)<br />
Corporate Office: 4 th Floor ‘A’ Wing, <strong>Aditya</strong> <strong>Birla</strong> Center, S.K. Ahire Marg, Worli, Mumbai – 400 030<br />
www.adityabirla.com or www.indianrayon.com<br />
4
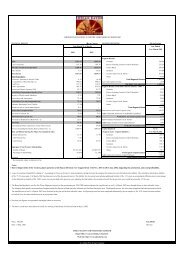
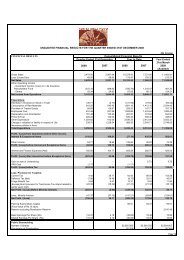
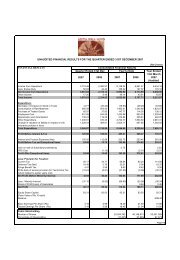
AUDITED FINANCIAL RESULTS FOR THE YEAR ENDED 31 ST MARCH 2005<br />
(Rs in Crores)<br />
Consolidated Financial <strong>Results</strong> FINANCIAL RESULTS<br />
Nine Months Quarter Ended 31 st March Year Ended<br />
Year Ended Year Ended Ended 31 st March 31 st March<br />
31 st March, 05 31 st March, 04 31 st Dec, 04 2005 2004 2005 2004<br />
3,325.62 2,551.88 Income from Operations 1,471.78 516.04 434.82 1,987.82 1,717.61<br />
136.36 147.64 Less: Excise Duty 98.10 29.10 34.64 127.20 140.22<br />
3,189.26 2,404.24 Net Income from Operations 1,373.68 486.94 400.18 1,860.62 1,577.39<br />
19.43 19.88 Other Income 7.42 2.65 3.24 10.07 14.23<br />
3,208.69 2,424.12 Total Income 1,381.10 489.59 403.42 1,870.69 1,591.62<br />
Total Expenditure:<br />
(14.41) (19.80) Decrease / (Increase) in Stock in Trade (10.89) (0.27) (24.83) (11.16) (21.01)<br />
1,040.68 861.48 Consumption of Raw Materials 731.71 264.03 233.73 995.74 816.30<br />
319.73 261.78 Staff Cost 92.14 33.02 29.93 125.16 117.43<br />
917.19 719.08 Other Expenditure 374.31 122.62 100.26 496.93 415.62<br />
684.12 397.44 Change in valuation of liability in respect of life<br />
Insurance policies in force<br />
261.38 204.14 Profit Before Interest, Depreciation & Tax 193.83 70.19 64.33 264.02 263.28<br />
41.94 41.07 Interest and Finance Expenses 16.24 6.70 5.25 22.94 23.99<br />
4.85 8.72 Add: Interest Income 3.16 1.18 1.72 4.34 9.17<br />
224.29 171.79 Profit Before Depreciation, Royalty & Tax 180.75 64.67 60.80 245.42 248.46<br />
Royalty to Wholly-owned Subsidiary - - - - 5.46<br />
130.23 126.84 Depreciation and Amortisation 60.06 20.63 20.29 80.69 81.52<br />
94.06 44.95 Profit Before Tax and Exceptional Items 120.69 44.04 40.51 164.73 161.48<br />
1.89 19.95<br />
Gain/(Loss) on Long Term Strategic Investments/Transfer<br />
of business (Net) 2.21 (0.32) - 1.89 19.95<br />
(9.54) (2.69) VRS Cost at Rayon Division / Others (8.97) (0.57) - (9.54) -<br />
86.41 62.21 Profit After Exceptional Items 113.93 43.15 40.51 157.08 181.43<br />
45.78 45.28 Provision for Current Tax 36.52 8.83 12.07 45.35 44.25<br />
(1.94) 4.05 Deferred Tax (Net) 3.22 (5.21) 0.87 (1.99) 5.90<br />
(0.07) - Provision for Tax for earlier years written back<br />
42.64 12.88 Net Profit 74.19 39.53 27.57 113.72 131.28<br />
(15.76) (20.21) Less : Minority Interest<br />
(0.24) - Share of Loss of Associate written back<br />
58.64 33.09 Net Profit (After Minority Interest) 74.19 39.53 27.57 113.72 131.28<br />
59.88 59.88 Paid up Equity Share Capital (Face Value of Rs.10 59.88 59.88 59.88 59.88 59.88<br />
each)<br />
Reserve 1294.18 1207.80<br />
8.78 4.89 Basic and Diluted Earnings Per Share - Rs 12.39 6.60 4.60 18.98 21.91<br />
Aggregate of Non-Promoter Shareholding<br />
Number of Shares 42,747,570 42,776,227<br />
Percentage of Shareholding 71.38% 71.43%<br />
Dividend 40%# 40%<br />
# Recommended<br />
1. Status of Investor Complaints for the quarter ended 31st March 2005<br />
Opening Received Redressed Pending<br />
NIL 16 16 NIL<br />
2. Previous Year's/period's figures are regrouped/ rearranged wherever necessary.<br />
3. The above results, have been taken on record at a meeting of the Board of Directors held on 27th April, 2005.<br />
Contd. To Page 2
Contd. from Page 1<br />
(Rs in Crores)<br />
Consolidated Financial <strong>Results</strong> SEGMENT REPORTING<br />
Nine Months Quarter Ended 31 st March Year Ended<br />
Year Ended Year Ended Ended 31 st March 31 st March<br />
31 st March, 05 31 st March, 04 31 st Dec, 04 2005 2004 2005 2004<br />
Segment Revenue<br />
472.40 391.68 Garments 363.72 108.68 89.03 472.40 391.68<br />
352.00 335.17 Rayon Yarn (Including Caustic & Allied Chemicals) 260.85 91.15 84.90 352.00 335.17<br />
467.25 340.30 Carbon Black 343.51 123.74 89.90 467.25 340.30<br />
184.53 154.35 Insulators 64.78 35.34 21.69 100.12 72.52<br />
459.02 397.88 Other Textiles (Spun Yarn & Fabrics) 333.23 125.79 107.65 459.02 397.88<br />
956.19 545.26 Life Insurance<br />
82.13 86.01 Software<br />
108.23 57.28 BPO<br />
97.28 55.56 Telecom<br />
13.70 47.73 Others 9.36 3.38 7.52 12.74 40.71<br />
3,192.73 2,411.22 Total Segmental Revenue 1,375.45 488.07 400.68 1,863.52 1,578.27<br />
(3.47) (6.98) Less: Inter Segment Revenue (1.77) (1.13) (0.51) (2.90) (0.88)<br />
3,189.26 2,404.24 Net Income from Operations 1,373.68 486.94 400.17 1,860.62 1,577.39<br />
Segment <strong>Results</strong> (Profit before<br />
Interest and Tax - PBIT)<br />
13.03 (1.84) Garments 9.61 3.42 0.04 13.03 (1.84)<br />
66.32 77.93 Rayon Yarn (Including Caustic & Allied Chemicals) 50.39 15.93 19.01 66.32 77.93<br />
60.32 64.68 Carbon Black 44.08 16.24 15.14 60.32 64.68<br />
9.90 12.87 Insulators 13.67 7.94 6.63 21.61 21.43<br />
19.79 6.55 Other Textiles (Spun Yarn & Fabrics) 13.44 6.35 3.16 19.79 6.55<br />
(60.03) (77.63) Life Insurance<br />
(0.55) (15.07) Software<br />
2.47 (1.87) BPO<br />
16.90 2.72 Telecom<br />
6.93 5.95 Others 4.31 1.89 1.35 6.20 4.52<br />
135.07 74.28 Total Segment Result 135.50 51.75 45.33 187.25 173.27<br />
(37.09) (32.35) Less: Interest & Finance Expenses (Net) (13.08) (5.52) (3.53) (18.60) (14.82)<br />
(3.92) 3.03 Add: Net of Unallocable Income/(Expenditure) (1.73) (2.19) (1.29) (3.92) 3.03<br />
94.06 44.96 Profit Before Tax and Exceptional Items 120.69 44.04 40.51 164.73 161.48<br />
1.89 19.95<br />
Gain/(Loss) on Long Term Strategic Investments/Transfer<br />
of business (Net) 2.21 (0.32) - 1.89 19.95<br />
(9.54) (2.69) VRS Cost at Rayon Division/Others (8.97) (0.57) - (9.54) -<br />
86.41 62.22 Profit After Exceptional Items 113.93 43.15 40.51 157.08 181.43<br />
As on As on Capital Employed As on As on As on<br />
31 st March, 05 31 st March, 04 (Segment Assets - Segment Liabilities) 31 st Dec, 04 31 st March, 05 31 st March, 04<br />
252.21 242.24 Garments 235.41 252.21 242.24<br />
318.60 264.42 Rayon Yarn (Including Caustic & Allied Chemicals) 280.75 318.60 264.42<br />
371.87 332.98 Carbon Black 340.63 371.87 332.98<br />
110.53 96.33 Insulators 18.53 20.94 19.97<br />
211.34 153.39 Other Textiles (Spun Yarn & Fabrics) 182.83 211.34 153.39<br />
106.29 106.91 Life Insurance<br />
19.53 25.29 Software<br />
61.51 53.79 BPO<br />
197.62 137.86 Telecom<br />
32.25 35.36 Others 13.41 13.18 16.85<br />
1,681.75 1,448.57 Total Segment Capital Employed 1,071.56 1,188.14 1,029.85<br />
177.52 219.34 Add: Unallocated Corporate Assets 684.45 614.52 612.18<br />
1,859.27 1667.91 Total Capital Employed 1,756.01 1,802.66 1,642.03<br />
Place: Mumbai<br />
Date: April 27th, 2005<br />
INDIAN RAYON AND INDUSTRIES LIMITED<br />
Regd. Office: Veraval 362266, GUJARAT.<br />
Web Site: http://www.adityabirla.com<br />
An <strong>Aditya</strong> <strong>Birla</strong> Group Company<br />
B.L. SHAH<br />
Director