Appendix D Transportation Report - City of Oshawa
Appendix D Transportation Report - City of Oshawa
Appendix D Transportation Report - City of Oshawa

You also want an ePaper? Increase the reach of your titles
YUMPU automatically turns print PDFs into web optimized ePapers that Google loves.
<strong>Appendix</strong> D<br />
<strong>Transportation</strong> <strong>Report</strong>
Prepared for the <strong>City</strong> <strong>of</strong> <strong>Oshawa</strong> with planningAlliance<br />
Part II Plan for the Kedron Planning Area and Concept Plans for the<br />
North Kedron Industrial Area + East Windfields Industrial Area<br />
<strong>Transportation</strong>, Traffic and Transit Assessment <strong>Report</strong><br />
<strong>Transportation</strong>, Traffic, and Transit Assessment <strong>Report</strong><br />
April 2010
Prepared for the <strong>City</strong> <strong>of</strong> <strong>Oshawa</strong> with The Planning Alliance<br />
Kedron Planning Area<br />
Secondary Block Plan<br />
<strong>Transportation</strong>, Traffic, and Transit Assessment <strong>Report</strong><br />
Table <strong>of</strong> Content<br />
1. Introduction .................................................................................................................................... 1<br />
2. Land Use Plans ............................................................................................................................... 2<br />
3. Current Traffic Conditions ............................................................................................................. 7<br />
4. Future Background Traffic Flows .................................................................................................. 7<br />
5. Projected Site Traffic ................................................................................................................... 12<br />
6. Total Traffic and Levels <strong>of</strong> Service .............................................................................................. 18<br />
7. Transit Assessment ....................................................................................................................... 24<br />
7.1 Transit Cost ........................................................................................................................... 32<br />
8. Additional Considerations ............................................................................................................ 32<br />
9. Conclusions and Recommendations ............................................................................................. 38<br />
Poulos & Chung Ltd.<br />
08.217 Kedron Traffic <strong>Report</strong> 14April2010.docx
Prepared for the <strong>City</strong> <strong>of</strong> <strong>Oshawa</strong> with planningAlliance<br />
Part II Plan for the Kedron Planning Area and Concept Plans for the North<br />
Kedron Industrial Area + East Windfields Industrial Area<br />
<strong>Transportation</strong>, Traffic and Transit Assessment <strong>Report</strong><br />
1.0 Introduction<br />
A Part II Plan for the Kedron Planning Area and Concept Plans for the North Kedron Industrial<br />
Area and East Windfields (collectively referred to as ‘Kedron’ in this report) have been<br />
completed by planningAlliance. Poulos & Chung Limited as a member <strong>of</strong> the planning team<br />
assisted in the preparation <strong>of</strong> the plans and completed this supporting traffic, transportation and<br />
transit assessment report. The planning area is located in northern <strong>Oshawa</strong> and loosely bordered<br />
by Winchester Road, Townline Road, Conlin Road, and the <strong>Oshawa</strong> Creek valley. This report<br />
includes a summary <strong>of</strong> current conditions, a detailed analysis <strong>of</strong> the 2021 horizon year, and a<br />
general assessment <strong>of</strong> the 2031 conditions. In addition to the road network, general transit<br />
planning and a review <strong>of</strong> the site’s cycling and pedestrian network were also addressed. The<br />
background transportation assessment that was part <strong>of</strong> the Phase 1 report is included in appendix<br />
A at the end <strong>of</strong> this report.<br />
The preparation <strong>of</strong> this assessment report is based upon several key information inputs and<br />
analytical procedure steps. These include:<br />
• Obtaining from Durham Region EMME II forecast traffic flows on the boundary<br />
roads for horizon year 2021. Adjustments to base information were done to reflect<br />
forecast background traffic flows without any Kedron development (which refers to<br />
the Kedron Planning Area and the Concept plans for the North Kedron Industrial<br />
Area and East Windfields). The planned Kedron development traffic flows were then<br />
added back onto the forecast 2021 background traffic flows;<br />
• The 2031 forecast analysis was completed by using a growth factor to account for<br />
forecast 2031 background traffic flows and traffic flows resulting from the OPA 128<br />
lands;<br />
• The transit modal split associated with the Kedron lands was estimated to be in the 5 -<br />
7 percent range;<br />
• The future area transit network and service levels is based upon the Durham Region<br />
Transit Connecting Communities <strong>Report</strong>;<br />
Poulos & Chung Ltd.<br />
08.217 Kedron Traffic <strong>Report</strong> 14April2010.docx<br />
1
• The use <strong>of</strong> the “Synchro” s<strong>of</strong>tware program to assess and evaluate all critical Master<br />
Plan intersections.<br />
The information provided above and the analysis steps undertaken follow the typical<br />
methodology used in the completion <strong>of</strong> Environmental Assessment Study for roads and roadway<br />
networks. The methodology included an assessment <strong>of</strong> road and plan options for the Kedron<br />
Planning Area. The evaluation process permitted the formation <strong>of</strong> a preferred roadway structure<br />
and network plan providing sufficient connectivity and capacity for all key modes <strong>of</strong><br />
transportation.<br />
2.0 Land Use Plans<br />
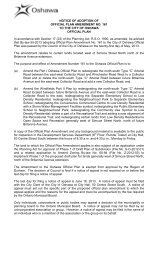
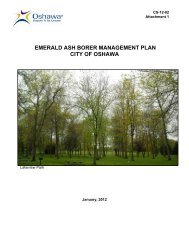
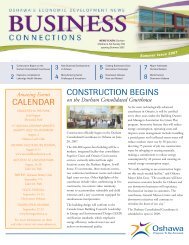
Three different land use and road network options were prepared in Phase 2 <strong>of</strong> the study. These<br />
three plans are presented in Figures 1 through 3. The road network is very similar across all three<br />
options. A preliminary traffic analysis was conducted on these options to determine the most<br />
favourable option from a roadway performance perspective. The analysis and evaluation <strong>of</strong><br />
these options showed little difference among the options from a transportation perspective.<br />
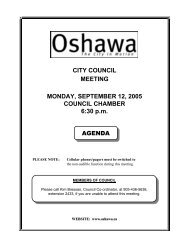
The preliminary analysis concluded that the collector roads shown in the options in the Part II<br />
Plan area that run parallel to Harmony Road should be extended south to Conlin Road. These<br />
extensions were recommended to alleviate the forecast high traffic flows on Harmony Road and<br />
to better distribute and balance vehicle flow demands to and from all parts <strong>of</strong> the planning area.<br />
The preliminary analysis also concluded that the North Kedron Industrial Areas should be<br />
serviced by additional collector roads. A final conclusion <strong>of</strong> the preliminary analysis was that the<br />
intersections along Townline road should be spaced to accommodate a potential Highway 407<br />
interchange.<br />
These analysis recommendations were incorporated in the design <strong>of</strong> the preferred plan which is<br />
presented in Figure 4. The analysis presented in this report is based on this preferred plan.<br />
The evaluation <strong>of</strong> these three preliminary options and the development <strong>of</strong> the preferred plan<br />
followed the methodology and analysis steps <strong>of</strong> a typical Environmental Assessment (EA) Study.<br />
As part <strong>of</strong> the EA study process a series <strong>of</strong> public meetings were conducted. A second part <strong>of</strong> the<br />
EA study process was a review by the planning team <strong>of</strong> the three options according to the<br />
evaluation matrices presented in the main report <strong>of</strong> the Part II Plan for the Kedron Planning Area<br />
and the Concept Plans for the North Kedron Industrial Area + East Windfields Industrial Area.<br />
Poulos & Chung Ltd.<br />
08.217 Kedron Traffic <strong>Report</strong> 14April2010.docx<br />
2
Kedron<br />
Traffic Assessment<br />
08.217 Base LU 03/29/10<br />
Image modified from the Planning Alliance (2009).<br />
Land Use Options - Option 1<br />
Figure 1<br />
3
Kedron<br />
Traffic Assessment<br />
08.217 Base LU 03/29/10<br />
Image modified from the Planning Alliance (2009).<br />
Land Use Options - Option 2<br />
Figure 2<br />
4
Kedron<br />
Traffic Assessment<br />
08.217 Base LU 03/29/10<br />
Image modified from the Planning Alliance (2009).<br />
Land Use Options - Option 3<br />
Figure 3<br />
5
Kedron<br />
Traffic Assessment<br />
08.217 Base LU 03/29/10<br />
Image modified from the Planning Alliance (2010).<br />
Land Use Options - Preferred Plan<br />
Figure 4<br />
6
During the initial formation <strong>of</strong> optional land use plans Poulos & Chung conducted an overview<br />
assessment <strong>of</strong> arterial / collector road intersection locations. Using available as built plans and<br />
vehicle stopping and tuning movement decision making criteria, each potential major<br />
intersection location along the existing boundary roads was examined. The analysis conducted<br />
indicated that all proposed intersection locations can achieve acceptable vehicle sight lines and<br />
appropriate vehicle decision making criteria. Some intersections could require minor shaving <strong>of</strong><br />
the existing centre line conditions. The detailed design <strong>of</strong> roads including precise geometric<br />
details will be determined during the development application process.<br />
3.0 Current Traffic Conditions<br />
Figure 5 shows the current road network in the area. The figure also displays the current<br />
intersection lane configurations, traffic control devices and levels <strong>of</strong> service. All intersections are<br />
currently performing satisfactorily with the exception <strong>of</strong> the intersection <strong>of</strong> Harmony Road /<br />
Winchester road. This intersection is nearing the limit <strong>of</strong> acceptable levels <strong>of</strong> service.<br />
4.0 Future Background Traffic Flows<br />
Several critical analysis steps were conducted to formulate forecast background traffic flows in<br />
horizon year 2021. The basis <strong>of</strong> the forecast traffic flows was the EMME II outputs provide by<br />
Durham Region for horizon year 2021. These outputs had to be adjusted because the assumed<br />
population and employment used by the model had to be extracted out to get the base forecast<br />
background traffic flows without any proposed Kedron development. These analysis steps are<br />
summarized in the following paragraphs.<br />
A screenline analysis was used to verify:<br />
• The model forecast outputs against a growth factor applied to existing traffic flows;<br />
• The complete balancing <strong>of</strong> total background vehicle demands due to not only<br />
adjusting the Kedron traffic planning zones but also the influence <strong>of</strong> the Proposed<br />
Highway 407 East Technically Preferred Route on background traffic flow patterns.<br />
Figure 6 shows the approximate locations <strong>of</strong> the screenlines used for the analysis. Screenlines A,<br />
B, C, and F were used to examine the (existing and forecast background) traffic entering and<br />
exiting the site via the boundary roads. Screenlines D and E were used to examine the traffic<br />
entering and exiting the site using the Proposed Highway 407 East Technically Preferred Route.<br />
Figures 7 and 8 show the inbound and outbound traffic flows respectively. The analysis is<br />
presented in the tables in three parts.<br />
Poulos & Chung Ltd.<br />
08.217 Kedron Traffic <strong>Report</strong> 14April2010.docx<br />
7
N<br />
80 km/h<br />
Grandview St. N.<br />
50 km/h<br />
50 km/h<br />
80 km/h 80 km/h<br />
50 km/h<br />
60 km/h<br />
Winchester Rd. E.<br />
Consession Rd. 7<br />
LOS: A<br />
LOS: D<br />
80 km/h<br />
80 km/h<br />
Harmony Rd. N.<br />
Townline Rd. N.<br />
LOS: B<br />
LOS: C<br />
50 km/h<br />
Ritson Rd. N.<br />
50 km/h 50 km/h<br />
50 km/h<br />
70 km/h<br />
Conlin Rd. E.<br />
60 km/h<br />
Kedron<br />
Traffic Assessment<br />
Current Traffic Conditions<br />
Figure 5<br />
LOS: B Intersection Level <strong>of</strong> Service<br />
Stop Sign<br />
Legend<br />
Traffic Light<br />
Speed Limit<br />
08.217 Base AB 03/29/10<br />
80 km/h<br />
8
308<br />
Kedron<br />
Traffic Assessment<br />
7<br />
644<br />
158<br />
4<br />
6<br />
25<br />
654<br />
527 549<br />
31<br />
12<br />
37<br />
458<br />
38<br />
18<br />
13<br />
1<br />
12<br />
8<br />
15<br />
73 14<br />
16<br />
37<br />
565<br />
636<br />
173<br />
495<br />
632<br />
308<br />
9<br />
447<br />
231<br />
387<br />
231<br />
28<br />
17<br />
585<br />
36<br />
237<br />
478<br />
58<br />
2<br />
635<br />
479<br />
665<br />
635<br />
233<br />
171<br />
233<br />
270<br />
569<br />
492<br />
620<br />
60<br />
373<br />
1017<br />
814<br />
764<br />
729<br />
739<br />
492<br />
505<br />
640<br />
330<br />
218<br />
491<br />
436<br />
719<br />
714<br />
974<br />
554<br />
816<br />
469<br />
341<br />
346<br />
509<br />
341<br />
415<br />
57<br />
616<br />
432<br />
280<br />
329<br />
101<br />
344<br />
961<br />
613<br />
111<br />
808<br />
637<br />
478<br />
262<br />
702<br />
681<br />
360<br />
526<br />
806<br />
717<br />
559<br />
967<br />
277<br />
933<br />
1073<br />
598<br />
452<br />
164<br />
263<br />
640<br />
784<br />
845<br />
886<br />
585<br />
701<br />
2<br />
1030<br />
878<br />
774<br />
83<br />
1266<br />
1223 1182<br />
512<br />
570<br />
1204<br />
845<br />
240<br />
941<br />
997<br />
249<br />
358<br />
454<br />
825<br />
933<br />
1073<br />
501<br />
831<br />
640<br />
25<br />
281<br />
117<br />
9<br />
9<br />
9<br />
23<br />
535<br />
455<br />
9<br />
18<br />
32<br />
644<br />
160<br />
78<br />
13<br />
12<br />
37<br />
25<br />
16<br />
387<br />
244<br />
671<br />
171<br />
391<br />
288<br />
4<br />
594<br />
389<br />
1139<br />
517<br />
517<br />
1139<br />
1131<br />
2182<br />
479<br />
635<br />
1346<br />
2435<br />
947<br />
578<br />
997<br />
517<br />
1139<br />
1131<br />
2182<br />
1131<br />
2182<br />
517<br />
1139<br />
1346<br />
2435<br />
455<br />
589<br />
6<br />
541<br />
233<br />
213<br />
1008<br />
687<br />
1346<br />
2435<br />
225<br />
107<br />
107<br />
225<br />
163<br />
113<br />
430<br />
1346<br />
2435<br />
44<br />
24<br />
3<br />
3<br />
03<br />
5<br />
149<br />
12<br />
20<br />
85<br />
180<br />
1242<br />
1<br />
221<br />
942<br />
837<br />
148<br />
117<br />
154<br />
986<br />
123<br />
349<br />
917<br />
295<br />
195<br />
226<br />
397<br />
981<br />
303<br />
183<br />
263<br />
917<br />
828<br />
1058<br />
743<br />
853<br />
53<br />
171<br />
72<br />
227<br />
367<br />
1223<br />
858<br />
832<br />
1416<br />
427 469<br />
418<br />
512<br />
395<br />
589 562<br />
395<br />
ncester Rd<br />
912<br />
506<br />
504490<br />
299<br />
710<br />
677<br />
654<br />
714<br />
974<br />
149<br />
262 261<br />
435<br />
886<br />
1026<br />
903<br />
hickson Rd N<br />
Simcoe St<br />
Taunton Rd E<br />
213<br />
1163<br />
795<br />
380<br />
127<br />
556<br />
584<br />
433<br />
100<br />
1321<br />
190<br />
308<br />
822<br />
320<br />
53<br />
277<br />
461<br />
481<br />
d.<br />
7<br />
417<br />
N<br />
ard Rd.<br />
Ritson Rd N<br />
Harmony Rd<br />
Enfield Rd.<br />
3<br />
3<br />
A<br />
C<br />
2021 PM Peak Hour Auto Link Volume<br />
Conlin Rd.<br />
F<br />
D<br />
E<br />
B<br />
No. <strong>of</strong> Lanes - One Way<br />
1 Lane<br />
1116<br />
59<br />
2 Lanes<br />
3 Lanes<br />
9<br />
4<br />
2<br />
102<br />
8<br />
913<br />
924<br />
495<br />
1<br />
08.217 Base K 01/22/10<br />
Legend:<br />
Study Area Boundary<br />
Screenline<br />
Note to Scale<br />
Note: Data from Durham Region EMME2 output<br />
Screenline Analysis<br />
Figure 6<br />
9
Kedron<br />
Traffic Assessment<br />
Inbound<br />
Direction 2006 Field Counts<br />
EMME II Validation Kedron Zone Model Adjustments Rationalization <strong>of</strong> Flows Due to Hwy 407<br />
EMME II<br />
2006<br />
2021 (with 407<br />
Extension)<br />
Estimated<br />
Kedrons Traffic<br />
from EMME2<br />
2021 (with 407<br />
Extension/ Excluded<br />
Kedrons Traffic)<br />
Increase<br />
Traffic Due<br />
to 407<br />
2006 Field Count<br />
increased by 0.5%<br />
Compounded Annaul<br />
rate<br />
Total Future<br />
background<br />
traffic in the<br />
Analysis<br />
Screenline A Winchester Rd. E 674 701 635 111 524 -150 726 576<br />
Colin Rd. E 400 267 452 230 222 431 431<br />
Hwy 407 E 0 2435 0 2435 2435 2435<br />
Screenline B Winchester Rd. W 58 7 12 52 -40 80 63 143<br />
Colin Rd. W 98 110 171 57 114 106 106<br />
Hwy 407 E 1139 1139 517 0 517<br />
Screenline C Ritson Rd. S 47 12 16 56 -40 51 51<br />
Harmony Rd. S 38 14 12 51 -39 200 41 241<br />
Grandview St N S 45 97 158 158 48 48<br />
Screenline D Ritson Rd. S 215 249 569 359 210 232 232<br />
Harmony Rd. S 321 333 447 245 202 200 346 546<br />
Screenline E Ritson Rd. S 215 309 569 657 -88 232 232<br />
Harmony Rd. S 321 378 947 412 535 200 346 546<br />
Screenline F Ritson Rd. N 355 198 479 392 87 383 383<br />
Harmony Rd. N 356 260 677 236 441 200 384 584<br />
Grandview St N N 73 155 344 344 79 79<br />
Total 3216 3090 9062 6204 7148<br />
Net Increase (2006 to 2021) incl . Kedrons 5972<br />
Annual Increase from 2006 to 2021) incl . Kedrons 7%<br />
Net Increase (2006 to 2021) Excl. Kedrons 3114 3932<br />
Annual Increase from 2006 to 2021) Excl. Kedrons 5% 5%<br />
Screenline Analysis - Inbound<br />
Figure 7<br />
08.217 Base X 01/22/10<br />
10
Kedron<br />
Traffic Assessment<br />
Outbound<br />
Direction 2006 Field Counts<br />
EMME II Validation Kedron Zone Model Adjustments Rationalization <strong>of</strong> Flows Due to Hwy 407<br />
EMME II<br />
2006<br />
2021 (with 407<br />
Extension)<br />
Estimated<br />
Kedrons Traffic<br />
from EMME2<br />
2021 (with 407<br />
Extension/ Excluded<br />
Kedrons Traffic)<br />
Increase<br />
Traffic Due<br />
to 407<br />
2006 Field Count<br />
increased by 0.5%<br />
Compounded Annaul<br />
rate<br />
Total Future<br />
background<br />
traffic in the<br />
Analysis<br />
Screenline A Winchester Rd. W 292 441 479 159 320 -150 315 165<br />
Colin Rd. W 252 76 262 445 -183 272 272<br />
Hwy 407 W 0 1346 0 1346 1246 1246<br />
Screenline B Winchester Rd. E 139 26 37 56 -19 80 150 230<br />
Colin Rd. E 213 255 233 178 55 230 230<br />
Hwy 407 W 511 511 1139 0 1139<br />
Screenline C Ritson Rd. N 69 9 18 55 -37 74 74<br />
Harmony Rd. N 50 15 25 65 -40 200 54 254<br />
Grandview St N N 147 283 455 455 158 158<br />
Screenline D Ritson Rd. N 136 182 270 145 125 147 147<br />
Harmony Rd. N 245 352 594 207 387 200 264 464<br />
Screenline E Ritson Rd. N 136 193 270 291 -21 147 147<br />
Harmony Rd. N 245 366 665 507 158 200 264 464<br />
Screenline F Ritson Rd. S 458 272 703 701 2 494 494<br />
Harmony Rd. S 403 306 961 497 464 200 434 634<br />
Grandview St N N 155 200 218 218 167 167<br />
Total 2940 2976 7047 3741 6283<br />
Net Increase (2006 to 2021) incl . Kedrons 3957<br />
Annual Increase from 2006 to 2021) incl . Kedrons 6%<br />
Net Increase (2006 to 2021) Excl. Kedrons 651 3343<br />
Annual Increase from 2006 to 2021) Excl. Kedrons 1% 5%<br />
Screenline Analysis - Outbound<br />
Figure 8<br />
08.217 Base X 01/22/10<br />
11
The first part <strong>of</strong> each table shows a comparison between the model outputs and actual traffic<br />
counts, validating the EMME2 model calibration process. It can be seen that the model outputs<br />
for year 2006 very accurately compare to the existing traffic flows. The second part <strong>of</strong> each table<br />
estimates what portion <strong>of</strong> the projected traffic is external (i.e. non-Kedron site traffic). This was<br />
determined by subtracting out the Kedron traffic flows contained in the model. The third part <strong>of</strong><br />
each table uses the 2006 traffic counts (multiplied by 0.5% per year, compounded) to forecast<br />
2021 traffic flows incorporating all adjustments. The adjustments include the estimated change<br />
in traffic flows on background traffic flow patterns due to the completion <strong>of</strong> the Proposed<br />
Highway 407 East Technically Preferred Route. Figure 9 shows the changes in background<br />
traffic volumes due to the completion <strong>of</strong> the Proposed Highway 407 East Technically Preferred<br />
Route. These numbers represent the change in 2021 background traffic volumes from what they<br />
would be if the Proposed Highway 407 East Technically Preferred Route is not built.<br />
These total background traffic flow projections were used as the basis upon which Kedron<br />
generated traffic was added to. The addition <strong>of</strong> Kedron traffic also included the North Kedron<br />
Industrial Area and East Windfields (within the 2021 horizon year urban boundary).<br />
5.0 Projected Site Traffic<br />
The computation <strong>of</strong> site trips was based on the standard 3-step method <strong>of</strong>:<br />
1) Trip Generation<br />
2) Trip Distribution<br />
3) Trip Assignment<br />
Site trip generation was based on the land use information provided by planningAlliance for the<br />
preferred plan (within the 2021 urban boundary). This land use information included items such<br />
as land use type, unit densities, number <strong>of</strong> schools, population, and employment numbers. The<br />
trip generation rates for each land use type were determined using rates from the Institute <strong>of</strong><br />
<strong>Transportation</strong> Engineers (ITE). The applicable land use types and their associated vehicle trip<br />
generation rates are presented in Figure 10.<br />
Figure 11 shows the trip reduction factors that were applied for the analysis. To account for<br />
Traffic Demand Management (TDM) measures, all residential trips were reduced by 7% and all<br />
employment trips were reduced by 5%. Both school trips and mixed use commercial trips were<br />
reduced by 50% to account for the residential pass-by trips. Residential trips were also reduced<br />
by an additional 15% to account for internal site trips (representing a live-work scenario). The<br />
internal trips were then subtracted from the employment trips (again due to a live-work or live<br />
within community scenario). The internal trips were dispersed among the employment zones<br />
relative to the amount <strong>of</strong> trips generated by each zone. This means that if a zone generated 20%<br />
<strong>of</strong> the employment trips then 20% <strong>of</strong> the internal trips were subtracted from the total<br />
Poulos & Chung Ltd.<br />
08.217 Kedron Traffic <strong>Report</strong> 14April2010.docx<br />
12
200<br />
200 (200)<br />
200 (200)<br />
350 (200)<br />
200 (350)<br />
0 (80)<br />
-150 (-150)<br />
N<br />
517<br />
Townline Rd. N.<br />
Harmony Rd. N.<br />
Ritson Rd. N.<br />
Kedron<br />
Traffic Assessment<br />
Winchester Rd. E.<br />
Conlin Rd. E.<br />
Grandview St.N.<br />
-150 (-150)<br />
0 (10)<br />
200 (340)<br />
Background Traffic Reassignment<br />
due to Highway 407<br />
Figure 9<br />
-150 (-150)<br />
Legend:<br />
XX (YY): AM (PM) Peak Hour Volumes<br />
Highway 407<br />
80 (80)<br />
-150 (-150)<br />
0 (10)<br />
80 (90)<br />
1139<br />
80 (80)<br />
0 (80)<br />
340 (200)<br />
90 (80)<br />
10 (0)<br />
08.217 Base L 01/22/10<br />
1346<br />
2435<br />
10 (0)<br />
13
Kedron<br />
Traffic Assessment<br />
Trip Generation Rates (veh/unit.)<br />
Weekday Weekday Daily Weekday<br />
Land use Units ITE Code AM Peak Hour PM Peak Hour Peak Hour<br />
In Out Total In Out Total In Out Total<br />
Low Density Residential Units 210 0.19 0.56 0.75 0.65 0.36 1.01 4.79 4.79 9.57<br />
Medium Density Residential Units 230 0.08 0.36 0.44 0.33 0.19 0.52 2.91 2.91 5.81<br />
High Density Residential (7th ed) Units 232 0.06 0.28 0.34 0.24 0.14 0.38 2.09 2.09 4.18<br />
Mixed Use - Medium Residential Units 230 0.08 0.36 0.44 0.33 0.19 0.52 2.91 2.91 5.81<br />
Mixed Used -High Residential Units 232 0.06 0.28 0.34 0.24 0.14 0.38 2.09 2.09 4.18<br />
Retail Commercial in Mixed Uses Area 820 0.76 0.48 1.24 0.86 0.85 1.71 6.20 6.20 12.4<br />
Specialty Retail Centre Area 814 0.76 0.48 1.24 1.19 1.52 2.71 22.16 22.16 44.32<br />
General Office (Prestige) Emp 710 0.42 0.06 0.48 0.08 0.38 0.46 1.66 1.66 3.32<br />
Industrial Park (General) Emp 130 0.40 0.07 0.47 0.09 0.37 0.46 1.67 1.67 3.34<br />
Warehouses(Select) Emp 150 0.37 0.14 0.51 0.21 0.38 0.59 1.95 1.95 3.89<br />
Elementary School Students 520 0.25 0.20 0.45 0.07 0.08 0.15 0.65 0.65 1.29<br />
High School Students 530 0.29 0.13 0.42 0.06 0.07 0.13 0.86 0.86 1.71<br />
Community Centre Area 495 0.99 0.63 1.62 0.54 0.91 1.45 0.00 0.00 0.00<br />
Total Trips<br />
Generated using<br />
ITE rates<br />
Total Trips<br />
Generated after<br />
TDM measures<br />
AM Trips 14234 10692<br />
PM Trips 13401 10733<br />
Trip Generation Rates<br />
Figure 10<br />
08.217 Base N 03/19/10<br />
14
Kedron<br />
Traffic Assessment<br />
Weekday Weekday Daily Weekday<br />
AM Peak Hour PM Peak Hour All Day<br />
In Out Total In Out Total In Out Total<br />
Preferred Plan (Raw Numberrs) 7072 7162 14234 6657 6745 13401 61533 61533 123065<br />
Residential 1489 4930 6418 4974 2917 7890 39164 39164 78328<br />
7% Transit, TDM -104 -345 -449 -348 -204 -552 -2741 -2741 -5483<br />
Net Residential Trips 1384 4585 5969 4626 2712 7338 36422 36422 72845<br />
Mixed Use Commercial Trips 155 98 253 201 225 426 2507 2507 5014<br />
50% from Residential -77 -49 -126 -100 -113 -213 -1254 -1254 -2507<br />
Net CommercialTrips 77 49 126 100 113 213 1254 1254 2507<br />
School 2266 1496 3762 587 631 1218 6303 6303 12606<br />
50% Trips - Drop-<strong>of</strong>f Trips 50% -1133 -748 -1881 -294 -315 -609 -3152 -3152 -6303<br />
Net School Trips 1133 748 1881 294 315 609 3152 3152 6303<br />
Employment 3163 638 3801 895 2972 3867 13558 13558 27117<br />
5% Transit, TDM 5% -158 -32 -190 -45 -149 -193 -678 -678 -1356<br />
15% <strong>of</strong> trip from Adjacent Residential 15% -688 -208 -895 -407 -694 -1101 -5463 -5463 -10927<br />
Net Employment Trips 2475 430 2905 488 2278 2766 8095 8095 16190<br />
Total (ITE Rates) 7072 7162 14234 6657 6745 13401 61533 61533 123065<br />
Reduction -2160 -1382 -3542 -1194 -1475 -2669 -13288 -13288 -26576<br />
Net total 4912 5780 10692 5463 5270 10733 48245 48245 96489<br />
Reduction in percentage 31% 19% 25% 18% 22% 20% 22% 22% 22%<br />
08.217 Base Z 03/25/10<br />
Total Trips Generated with Reduction<br />
Factors<br />
Figure 11<br />
15
employment trips for that zone. Figure 12 shows the final number <strong>of</strong> trips generated by each<br />
zone after the application <strong>of</strong> the reduction factors.<br />
After the number <strong>of</strong> trips generated was determined, a proper trip distribution was formulated.<br />
The <strong>Transportation</strong> Tomorrow Survey (TTS) was used to determine the distribution <strong>of</strong> the trips.<br />
The TTS is a joint program with the Ministry <strong>of</strong> <strong>Transportation</strong> and municipalities in the GTHA<br />
and is run by the Data Management Group at the University <strong>of</strong> Toronto. Its responsibility is to<br />
compile and make available travel and transportation information throughout Southern Ontario.<br />
Due to the fact that there is currently little development in the Kedron area, central <strong>Oshawa</strong> was<br />
used to model the trip distribution. The area being referred to as central <strong>Oshawa</strong> is bordered by<br />
the Whitby-<strong>Oshawa</strong> border to the west, Rossland road to the south, the <strong>Oshawa</strong>-Clarington<br />
border to the east, and Conlin road to the north. Figure 13 shows the results <strong>of</strong> the TTS data for<br />
both traffic entering (left table) and exiting (right table) the site during the AM peak hour. At the<br />
bottom <strong>of</strong> both tables is a detailed breakdown <strong>of</strong> where the trips within <strong>Oshawa</strong> originate or<br />
terminate. Figures 14 and 15 illustrate graphically the vehicle trip distribution pattern for traffic<br />
exiting and entering the site respectively. The PM trip distribution was determined by reversing<br />
the AM trip distribution.<br />
Using the trip distributions, trip assignments were completed for each zone for each type <strong>of</strong> trip<br />
(residential, employment, and internal). The trip assignments were then superimposed and site<br />
trip volumes were created. The resulting total volumes for site trips are presented in Figure 16.<br />
6.0 Total Traffic and Levels <strong>of</strong> Service<br />
Figure 17 shows the total traffic flow volumes in horizon year 2021. These numbers are the<br />
result <strong>of</strong> superimposing the Kedron forecast total traffic flows based on the Preferred Plan onto<br />
the total forecast 2021 background traffic flows.<br />
This total vehicle demand flow was considered to be a vehicle design flow demand from which<br />
the pavement, right-<strong>of</strong>-way and ultimately the classification <strong>of</strong> each major site road could be<br />
determined. Using the vehicle demand flows, several critical roadway network and operating<br />
features could be concluded. These include:<br />
• Figure 18 shows the roadway designations and recommended number <strong>of</strong> lanes by<br />
direction for each major community road. The designations are based upon being able<br />
to provide sufficient vehicle capacity to satisfactorily serve the projected total vehicle<br />
design demand. These are considered mid-block conditions and do not contain the<br />
lane configuration requirements at intersection locations. The spacing <strong>of</strong> primary<br />
intersections is also shown;<br />
Poulos & Chung Ltd.<br />
08.217 Kedron Traffic <strong>Report</strong> 14April2010.docx<br />
16
N<br />
Grandview Rd. N.<br />
Townline Rd. N.<br />
Kedron<br />
Traffic Assessment<br />
Winchester Rd. E.<br />
Conlin Rd. E.<br />
08.217 Base M 03/26/10<br />
Trip Generation by Block<br />
Figure 12<br />
Ritson Rd. N.<br />
Wilson Rd. N.<br />
Harmony Rd. N.<br />
Hwy 407<br />
Zone 17<br />
AM: 661<br />
PM: 677<br />
Zone 1<br />
AM: 442<br />
PM: 560<br />
Zone 16<br />
AM: 0<br />
PM: 0<br />
Zone 14<br />
AM: 326<br />
PM: 383<br />
Zone 12<br />
AM: 516<br />
PM: 503<br />
Zone 13<br />
AM: 994<br />
PM: 1050<br />
Zone 2<br />
AM: 1003<br />
PM: 847<br />
Zone 4<br />
AM: 452<br />
PM: 549<br />
Zone 6<br />
AM: 299<br />
PM: 349<br />
Zone 7<br />
AM: 348<br />
PM: 323<br />
Zone 3<br />
AM: 894<br />
PM: 1066<br />
Zone 5<br />
AM: 1028<br />
PM: 1118<br />
Zone 9<br />
AM: 960<br />
PM: 840<br />
Values shown are number <strong>of</strong> trips generated by each zone during<br />
peak hours taking into account trip reduction factors.<br />
Zone 15<br />
AM: 447<br />
PM: 404<br />
Zone 8<br />
AM: 605<br />
PM: 658<br />
Zone 10<br />
AM: 574<br />
PM: 501<br />
Zone 11<br />
AM: 861<br />
PM: 969<br />
17
Kedron<br />
Traffic Assessment<br />
2006 TTS Trip Distribution (AM Peak Hour)<br />
Central <strong>Oshawa</strong> to PD Region<br />
Toronto 9.2%<br />
Downtown (PD1, PD2) 3%<br />
North York + York (PD 3-5,10-12) 3%<br />
East York (PD6) 0%<br />
Scarborough ( Pd 13-16) 3%<br />
Etobikoe (7-9) 0%<br />
Durham 86.0%<br />
Brok+Uxbridge+Scugog 1%<br />
Pickering 3%<br />
Ajax 3%<br />
Whitby 10%<br />
<strong>Oshawa</strong> 68%<br />
Clarington 2%<br />
York Region 3.2%<br />
East Gwillimbury<br />
Georgina 0%<br />
Newmarket 0%<br />
Aurora 1%<br />
Richmond Hill 0%<br />
Whitchurch-Sto 0%<br />
Markham 2%<br />
King 0%<br />
Vaughan 1%<br />
Simcoe County 0.1%<br />
Barrie 0%<br />
Rest <strong>of</strong> Simcoe 0%<br />
Peel 0% 0.2%<br />
Halton 0% 0.2%<br />
Cambridge/Kichener/Waterloo 0% 0.0%<br />
Peterbrgh/Northmbrlnd/Halibrtn 1% 1.0%<br />
Total 100% 100%<br />
<strong>Oshawa</strong> AM Peak Hour Internal Trips (Accounting for 68%)<br />
North (<strong>of</strong> 407) 0.9%<br />
South <strong>of</strong> 407 / North <strong>of</strong> Tauton ( East) 3.4%<br />
South <strong>of</strong> 407 / North <strong>of</strong> Tauton ( west) 4.2%<br />
South <strong>of</strong> Tauton / North <strong>of</strong> Hwy 2(East) 27.7%<br />
South <strong>of</strong> Tauton / North <strong>of</strong> Hwy 2(East) 22.2%<br />
South <strong>of</strong> Hwy 2 9.7%<br />
Total Outbound Trips 68.0%<br />
08.217 Base AA 03/28/10<br />
2006 TTS Trip Distribution (AM Peak Hour)<br />
PD to Central <strong>Oshawa</strong> Region<br />
Toronto 3.9%<br />
Downtown (PD1, PD2) 0%<br />
North York + York (PD 3-5,10-12) 1%<br />
East York (PD6) 1%<br />
Scarborough ( Pd 13-16) 2%<br />
Etobikoe (7-9) 0%<br />
Durham 91.4%<br />
Brok+Uxbridge+Scugog 2%<br />
Pickering 4%<br />
Ajax 3%<br />
Whitby 11%<br />
<strong>Oshawa</strong> 61%<br />
Clarington 10%<br />
York Region 2.0%<br />
East Gwillimbury<br />
Georgina 0%<br />
Newmarket 0%<br />
Aurora 0%<br />
Richmond Hill 0%<br />
Whitchurch-Sto 0%<br />
Markham 1%<br />
King 0%<br />
Vaughan 0%<br />
Simcoe County 0.2%<br />
Barrie 0%<br />
Rest <strong>of</strong> Simcoe 0%<br />
Peel 1% 0.8%<br />
Halton 0% 0.0%<br />
Cambridge/Kichener/Waterloo 0% 0.1%<br />
Peterbrgh/Northmbrlnd/Halibrtn 1% 1.2%<br />
Total 100% 100%<br />
<strong>Oshawa</strong> AM Peak Hour Internal Trips (Accounting for 61%)<br />
North (<strong>of</strong> 407) 0.8%<br />
South <strong>of</strong> 407 / North <strong>of</strong> Tauton ( East) 3.0%<br />
South <strong>of</strong> 407 / North <strong>of</strong> Tauton ( west) 3.8%<br />
South <strong>of</strong> Tauton / North <strong>of</strong> Hwy 2(East) 24.9%<br />
South <strong>of</strong> Tauton / North <strong>of</strong> Hwy 2(East) 19.9%<br />
South <strong>of</strong> Hwy 2 8.6%<br />
Total Outbound Trips 61.0%<br />
Trip Distribution - TTS Data<br />
Figure 13<br />
18
N<br />
Kedron<br />
Traffic Assessment<br />
1% (Uxbridge & Scugog)<br />
9% (Toronto)<br />
3% (Pickering)<br />
3% (Ajax)<br />
3% (York Region)<br />
Site<br />
10% (Whitby)<br />
68% (<strong>Oshawa</strong>)<br />
Legend:<br />
XX %: Percentage <strong>of</strong> Site Traffic with Respective Destination<br />
08.217 Base V 03/09/10<br />
1% (Peterborough)<br />
2% (Clarington)<br />
Trip Distribution - Kedron to other Sites<br />
Figure 14<br />
19
N<br />
Kedron<br />
Traffic Assessment<br />
2% (Uxbridge & Scugog)<br />
4% (Toronto)<br />
4% (Pickering)<br />
3% (Ajax)<br />
2% (York Region)<br />
1% (Peel)<br />
Site<br />
11% (Whitby)<br />
62% (<strong>Oshawa</strong>)<br />
Legend:<br />
XX %: Percentage <strong>of</strong> Site Traffic with Respective Origin<br />
08.217 Base V 03/09/10<br />
1% (Peterborough)<br />
10% (Clarington)<br />
Trip Distribution - Other Sites to Kedron<br />
Figure 15<br />
20
N<br />
15 (10)<br />
Kedron<br />
Traffic Assessment<br />
08.217 Base O 03/26/10<br />
(512) 271<br />
199 (180)<br />
161 (125)<br />
(220) 149<br />
162 (468)<br />
(209) 375<br />
174 (386)<br />
(126) 143<br />
Legend:<br />
XX (YY): AM (PM) Peak Hour Volumes<br />
174 (294)<br />
540 (537)<br />
(353) 556<br />
(255) 139<br />
(142) 167<br />
30 (49)<br />
(46) 24<br />
(141) 134<br />
(30) 48<br />
110 (144)<br />
170 (229)<br />
(211) 206 (298) 190<br />
255 (254)<br />
(291) 239<br />
348 (505)<br />
(307) 389<br />
222 (306)<br />
96 (113)<br />
144 (342)<br />
(325) 221<br />
(45) 114<br />
397 (598)<br />
(227) 523<br />
323 (853)<br />
(429) 1111<br />
(252) 522<br />
(283) 517<br />
(71) 150<br />
530 (583)<br />
426 (576)<br />
165 (101)<br />
125 (91)<br />
(81) 88 (115) 117<br />
135 (230)<br />
(172) 230<br />
337 (220)<br />
(260) 161<br />
260 (184)<br />
223 (170)<br />
(132) 146<br />
715 (753)<br />
(556) 709<br />
170 (154)<br />
424 (1021)<br />
(718) 1068<br />
190 (185)<br />
(953) 828<br />
786 (779)<br />
748 (685)<br />
(800) 742 (574) 562<br />
730 (559)<br />
(411) 348<br />
758 (1001)<br />
(855) 895<br />
521 (578)<br />
(627) 625<br />
(427) 351<br />
360 (301)<br />
(276) 230<br />
163 (123)<br />
(478) 533<br />
(263) 143<br />
292 (199)<br />
(195) 139<br />
90 (81)<br />
268 (239)<br />
(80) 119<br />
Grandview Rd. N.<br />
Townline Rd. N.<br />
2021 Site Traffic Flows<br />
Figure 16<br />
(146) 155<br />
17 (109)<br />
196 (167)<br />
Harmony Rd. N.<br />
913 (791)<br />
(673) 586<br />
630 (594)<br />
(459) 515<br />
166 (158)<br />
(105) 116<br />
Ritson Rd. N.<br />
(599) 426<br />
Wilson Rd. N.<br />
(619) 453<br />
Hwy 407<br />
Winchester Rd. E.<br />
Conlin Rd. E.<br />
21
N<br />
Grandview Rd. N.<br />
Townline Rd. N.<br />
Harmony Rd. N.<br />
73 (61)<br />
Ritson Rd. N.<br />
Wilson Rd. N.<br />
Kedron<br />
Traffic Assessment<br />
Hwy 407<br />
Winchester Rd. E.<br />
(1074) 433<br />
Conlin Rd. E.<br />
08.217 Base O 03/26/10<br />
650 (282)<br />
554 (211)<br />
(307) 194<br />
311 (698)<br />
(355) 582<br />
174 (386)<br />
(126) 143<br />
Legend:<br />
XX (YY): AM (PM) Peak Hour Volumes<br />
660 (501)<br />
642 (1008)<br />
(655) 1052<br />
(672) 233<br />
(369) 280<br />
238 (190)<br />
(188) 233<br />
113 (229)<br />
(141) 134<br />
(30) 48<br />
110 (144)<br />
170 (229)<br />
(211) 206 (298) 190<br />
255 (254)<br />
348 (505)<br />
701 (1397)<br />
(891) 1618<br />
(291) 239<br />
(307) 389<br />
222 (306)<br />
96 (113)<br />
144 (342)<br />
(325) 221<br />
(45) 114<br />
397 (598)<br />
(227) 523<br />
(398) 729<br />
(283) 517<br />
(71) 150<br />
758 (896)<br />
426 (576)<br />
165 (101)<br />
125 (91)<br />
(81) 88 (115) 117<br />
135 (230)<br />
337 (220)<br />
829 (1638)<br />
(1175) 1590<br />
(172) 230<br />
260 (184)<br />
223 (170)<br />
(132) 146<br />
715 (753)<br />
(556) 709<br />
170 (154)<br />
(260) 161<br />
190 (185)<br />
1141 (1104)<br />
(919) 836<br />
630 (594)<br />
(459) 515<br />
(1382) 1038<br />
1176 (956)<br />
1074 (876)<br />
(1069) 864 (793) 779<br />
990 (684)<br />
(695) 446<br />
1163 (1617)<br />
(1437) 1441<br />
(872) 732<br />
(749) 439<br />
679 (439)<br />
(644) 315<br />
412 (228)<br />
(478) 533<br />
(341) 313<br />
292 (199)<br />
(195) 139<br />
90 (81)<br />
(80) 119<br />
(146) 155<br />
713 (775)<br />
559 (371)<br />
2021 Total Traffic Flows<br />
Figure 17<br />
17 (109)<br />
196 (167)<br />
166 (153)<br />
(105) 116<br />
(980) 843<br />
(619) 453<br />
22
N<br />
(2) Lanes<br />
(1) Lane<br />
Ritson Rd. N.<br />
Wilson Rd. N.<br />
Harmony Rd. N.<br />
Grandview Rd. N.<br />
Townline Rd. N.<br />
Kedron<br />
Traffic Assessment<br />
Hwy 407<br />
Winchester Rd. E.<br />
Conlin Rd. E.<br />
08.217 Base Q 03/25/10<br />
Proposed IC<br />
(1) Lane<br />
800 500 300 650 1000<br />
(1) Lane<br />
}<br />
}<br />
}<br />
}<br />
}<br />
} }<br />
}<br />
}<br />
}<br />
800<br />
(2) Lanes (Parking <strong>of</strong>f-peak)<br />
(2) Lanes<br />
(1) Lanes<br />
(2) Lanes<br />
(1) Lanes<br />
(1) Lanes<br />
1000<br />
800<br />
800<br />
1500<br />
(1) Lane<br />
}<br />
} }<br />
500<br />
800 500 400 500 300 800<br />
700<br />
800<br />
}<br />
}}<br />
}<br />
}<br />
}<br />
Legend:<br />
Type A Arterial<br />
Type B Arterial<br />
Type C Arterial<br />
Collector Road<br />
(#) No. <strong>of</strong> lanes in each direction<br />
800 Distance between Intersections (metres)<br />
(2) Lanes (1) Lane<br />
Road Network Classification and<br />
Intersection Spacing<br />
Figure 18<br />
23
• Figure 19 shows the recommended intersection configurations. Also shown are the<br />
intersections where traffic signals should be installed to provide the most efficient<br />
intersection operating conditions. All other intersections could be controlled by stop<br />
sign traffic control devices with the primary direction <strong>of</strong> flow having precedence;<br />
• The roadway configuration presented in Figures 18 and 19 was analyzed using<br />
Synchro s<strong>of</strong>tware by Trafficware corp. Figure 20 shows the worst overall intersection<br />
levels <strong>of</strong> service (LOS) and volume over capacity (V/C) ratios computed by Synchro.<br />
Since the values in figure 20 are still acceptable for vehicle operation, it can be stated<br />
that the recommended roadway layout is sufficient for the total traffic demands <strong>of</strong> the<br />
site;<br />
• Figures 21 and 22 are detailed output from the Synchro analysis. Figure 21 shows the<br />
V/C ratios for individual intersection lanes during the roadway p. m. peak hour.<br />
Figure 22 shows the turning movement counts for individual intersections during the<br />
roadway p. m. peak hour. Again individual intersection lane approaches operate at<br />
acceptable conditions.<br />
In addition to horizon year 2021, the potential conditions for the year 2031 were also analyzed.<br />
The analysis for horizon year 2031 is based upon a compound growth factor. The growth factor<br />
selected was verified in the Section 4 analysis. The analysis used a simple growth factor <strong>of</strong> 1%<br />
per year, not compounded. This translates to a 10% increase in traffic over 10 years (2021 to<br />
2031). The growth factor accounts for the development <strong>of</strong> Durham ROPA 128. The total vehicle<br />
flow demand volumes for the 2031 condition are presented in Figure 23. The notable or very<br />
poor LOS and V/C ratios for the 2031 condition are presented in Figure 24. From Figure 24 it is<br />
evident that the proposed road network identified for 2021 is still sufficient for the 2031<br />
condition since all values are within acceptable limits. At no point in this report have conditions<br />
beyond the year 2031 been considered.<br />
The analysis indicates that the classified road network and traffic control devices formulated for<br />
the Kedron Planning Area can provide satisfactory levels <strong>of</strong> service and operating conditions to<br />
serve the anticipated vehicle travel demands.<br />
7.0 Transit Assessment<br />
Poulos & Chung have proposed potential transit routes for the Kedron and East Windfields areas<br />
as shown in Figure 25. These routes incorporate the guidelines set for Durham Region Transit in<br />
the ‘Connecting Communities <strong>Report</strong>’ prepared by Entra Consultants (November 2005) where<br />
possible. The routes along Townline, Harmony and Conlin are part <strong>of</strong> the base grid <strong>of</strong> routes laid<br />
out in the Entra report. The route along Winchester is an addition to the base grid proposed by<br />
Poulos & Chung. The figure also shows two local routes that could service the Kedron area.<br />
These routes would likely be extensions <strong>of</strong> existing routes south <strong>of</strong> the Kedron area, extending<br />
into the Taunton Part II Plan area.<br />
Poulos & Chung Ltd.<br />
08.217 Kedron Traffic <strong>Report</strong> 14April2010.docx<br />
24
N<br />
Grandview Rd. N.<br />
Townline Rd. N.<br />
Kedron<br />
Traffic Assessment<br />
Winchester Rd. E.<br />
Conlin Rd. E.<br />
08.217 Base R 03/29/10<br />
Legend:<br />
Traffic Signal Required<br />
Intersection Configurations and<br />
Traffic Control Devices<br />
Figure 19<br />
Ritson Rd. N.<br />
Wilson Rd. N.<br />
Harmony Rd. N.<br />
Hwy 407<br />
Note: Some intersection configurations have been omitted for clarity.<br />
25
N<br />
Grandview Rd. N.<br />
Townline Rd. N.<br />
Kedron<br />
Traffic Assessment<br />
Winchester Rd. E.<br />
Conlin Rd. E.<br />
08.217 Base AB 03/29/10<br />
LOS: C<br />
V/C: 0.83<br />
LOS: B (C)<br />
V/C: 0.82 (0.88)<br />
Legend:<br />
LOS (HCM Intersection Level <strong>of</strong> Service): AM (PM)<br />
V/C (HCM Intersection Volume-to-Capacity Ratio): AM (PM)<br />
LOS: (B)<br />
V/C: (0.81)<br />
2021 Levels <strong>of</strong> Service and V/c ratios<br />
for AM/PM Peak Hours<br />
Figure 20<br />
Ritson Rd. N.<br />
Wilson Rd. N.<br />
Harmony Rd. N.<br />
Hwy 407<br />
26
0.08<br />
0.00<br />
0.31<br />
0.08<br />
Townline Rd.<br />
0.23<br />
0.12<br />
0.33<br />
0.33<br />
0.05<br />
0.22<br />
0.22<br />
0.05<br />
0.07<br />
to Capacity Ratios 4/5<br />
Kedron<br />
Traffic Assessment<br />
N<br />
Townline Rd.<br />
0.00<br />
0.05<br />
0.07<br />
Winchester Rd. E.<br />
Winchester Rd. E.<br />
Winchester Rd. E.<br />
0.43<br />
0.54<br />
0.37<br />
0.68<br />
0.32<br />
0.22<br />
0.03<br />
Winchester Rd. E.<br />
0.73<br />
0.00<br />
0.23<br />
0.12<br />
Winchester Rd. E.<br />
0.26<br />
0.16<br />
0.33<br />
0.65<br />
0.29<br />
0.15<br />
0.06<br />
0.00<br />
0.20<br />
0.07<br />
0.19<br />
0.01<br />
0.17<br />
0.16<br />
0.44<br />
0.01<br />
0.22<br />
0.26<br />
0.40<br />
0.01<br />
0.05<br />
0.13<br />
0.06<br />
0.50<br />
0.11<br />
0.02<br />
0.59<br />
0.51<br />
0.21<br />
0.21<br />
Harmony Rd.<br />
0.06<br />
0.01<br />
0.16<br />
0.04<br />
0.14<br />
0.04<br />
0.12<br />
0.02<br />
0.13<br />
0.01<br />
Ritson Rd.<br />
Townline Rd.<br />
Street A<br />
0.61<br />
0.42<br />
Grandview Rd. 0.04<br />
0.02 Grandview<br />
0.41<br />
0.79<br />
0.07<br />
0.05<br />
Street A<br />
0.18<br />
0.68<br />
0.19<br />
0.20<br />
Harmony Rd.<br />
0.38<br />
0.45<br />
Wilson Rd. 0.11<br />
0.05 Wilson<br />
Street A<br />
0.05<br />
0.15<br />
0.15<br />
0.44<br />
0.21<br />
0.21<br />
0.06<br />
0.21<br />
0.15<br />
0.19<br />
0.23<br />
0.21<br />
0.02<br />
0.27<br />
0.32<br />
0.43<br />
0.19<br />
0.20<br />
0.14<br />
0.27<br />
0.24<br />
0.17<br />
Ritson Rd.<br />
27<br />
0.11<br />
0.30<br />
0.99<br />
0.10<br />
0.56<br />
0.14<br />
0.14<br />
0.04<br />
0.07<br />
0.14<br />
0.21<br />
0.27<br />
0.27<br />
0.06<br />
0.22<br />
0.35<br />
0.35<br />
0.35<br />
0.02<br />
0.09<br />
0.04<br />
0.02<br />
0.16<br />
0.00<br />
0.08<br />
0.05<br />
0.14<br />
0.02<br />
0.21<br />
0.03<br />
0.08<br />
0.00<br />
0.25<br />
0.40<br />
0.13<br />
0.20<br />
0.20<br />
0.06<br />
0.09<br />
0.36<br />
0.36<br />
0.63<br />
0.42<br />
0.18<br />
0.07<br />
0.13<br />
0.19<br />
0.18<br />
0.18<br />
0.01<br />
0.20<br />
0.20<br />
0.06<br />
0.32<br />
0.50<br />
0.17<br />
Harmony Rd.<br />
Ritson Rd.<br />
0.33<br />
0.42<br />
0.27<br />
Conlin Rd.<br />
0.23<br />
0.03<br />
0.03<br />
0.22<br />
0.16<br />
0.44<br />
0.23<br />
Conlin Rd.<br />
Conlin Rd.<br />
0.14<br />
0.47<br />
0.84<br />
0.57<br />
0.92<br />
0.23<br />
0.45<br />
0.10<br />
0.11<br />
0.18<br />
0.23<br />
Conlin<br />
0.44<br />
0.20<br />
Conlin Rd.<br />
0.17<br />
0.93<br />
0.31<br />
0.50<br />
0.77<br />
0.35<br />
0.42<br />
0.41<br />
0.35<br />
0.12<br />
0.60<br />
0.11<br />
0.38<br />
0.48<br />
0.32<br />
0.37<br />
0.33<br />
0.46<br />
0.49<br />
0.99<br />
0.63<br />
0.23<br />
0.84<br />
0.74<br />
0.33<br />
0.72<br />
0.56<br />
0.29<br />
0.38<br />
0.37<br />
0.32<br />
0.54<br />
0.59<br />
0.83<br />
Volume to Capacity Ratios<br />
(PM Peak Hour)<br />
Figure 21<br />
Legend:<br />
X.XX: PM Peak Hour Volume to Capacity Ratio for lane.<br />
Note: This figure is output from Synchro s<strong>of</strong>tware.<br />
inal Plan - PM Peak Hour Baseline S:\Yr 2008\08.217 Kedron\Synchro\march- revisions\08.217 PM- Mar2010<br />
name%<br />
08.217 Base AC 04/01/10
46<br />
0<br />
1<br />
0<br />
52<br />
26<br />
121<br />
Townline Rd.<br />
112<br />
84<br />
0<br />
31<br />
121<br />
2<br />
65<br />
120<br />
28<br />
17<br />
25<br />
46<br />
s 4/5/20<br />
Kedron<br />
Traffic Assessment<br />
N<br />
Townline Rd.<br />
0<br />
Winchester Rd. E.<br />
Winchester Rd. E.<br />
Winchester Rd. E.<br />
247<br />
129<br />
125<br />
131<br />
715<br />
162<br />
8<br />
229<br />
0<br />
0<br />
0<br />
0<br />
175<br />
15<br />
Winchester Rd. E.<br />
493<br />
3<br />
160<br />
51<br />
Winchester Rd. E.<br />
231<br />
43<br />
19<br />
38<br />
5<br />
30<br />
0<br />
0<br />
0<br />
142<br />
46<br />
27<br />
341<br />
307<br />
124<br />
327<br />
221<br />
87<br />
39<br />
209<br />
98<br />
134<br />
6<br />
251<br />
117<br />
7<br />
28<br />
288<br />
10<br />
227<br />
70<br />
58<br />
12<br />
539<br />
523<br />
137<br />
6<br />
Harmony Rd.<br />
43<br />
9<br />
0<br />
111<br />
26<br />
77<br />
25<br />
101<br />
0<br />
11<br />
91<br />
5<br />
Ritson Rd.<br />
Townline Rd.<br />
8<br />
Street A<br />
Grandview Rd. 18<br />
12 Grandview<br />
Street A<br />
101<br />
124<br />
280<br />
108<br />
1201<br />
88<br />
17<br />
120<br />
91<br />
Harmony Rd.<br />
Wilson Rd. 38<br />
27 Wilson<br />
339<br />
21<br />
86<br />
19<br />
275<br />
54<br />
0<br />
262<br />
44<br />
0<br />
109<br />
182<br />
71<br />
9<br />
89<br />
47<br />
Street A<br />
35<br />
109<br />
55<br />
644<br />
144<br />
31<br />
74<br />
220<br />
28<br />
218<br />
61<br />
38<br />
699<br />
155<br />
63<br />
102<br />
125<br />
224<br />
74<br />
11<br />
142<br />
70<br />
180<br />
33<br />
12<br />
118<br />
81<br />
330<br />
68<br />
89<br />
129<br />
9<br />
Ritson Rd.<br />
28<br />
81<br />
0<br />
16<br />
69<br />
85<br />
568<br />
12<br />
51<br />
52<br />
117<br />
76<br />
1525<br />
36<br />
26<br />
44<br />
21<br />
506<br />
31<br />
12<br />
0<br />
20<br />
876<br />
0<br />
20<br />
85<br />
25<br />
49<br />
2<br />
151<br />
105<br />
116<br />
9<br />
0<br />
80<br />
28<br />
96<br />
88<br />
0<br />
0<br />
0<br />
65<br />
383<br />
108<br />
8<br />
79<br />
45<br />
48<br />
30<br />
204<br />
8<br />
146<br />
856<br />
174<br />
21<br />
61<br />
90<br />
9<br />
89<br />
6<br />
0<br />
109<br />
6<br />
102<br />
39<br />
6<br />
17<br />
409<br />
33<br />
18<br />
53<br />
11<br />
0<br />
783<br />
136<br />
Harmony Rd.<br />
Ritson Rd.<br />
Conlin Rd.<br />
25<br />
193<br />
10<br />
Conlin Rd.<br />
106<br />
299<br />
34<br />
85<br />
492<br />
176<br />
Conlin Rd.<br />
12<br />
359<br />
20<br />
147<br />
72<br />
479<br />
133<br />
164<br />
1291<br />
162<br />
Conlin<br />
66<br />
709<br />
58<br />
101<br />
26<br />
806<br />
43<br />
27<br />
444<br />
123<br />
Conlin Rd.<br />
78<br />
838<br />
41<br />
115<br />
779<br />
210<br />
143<br />
176<br />
21<br />
73<br />
354<br />
217<br />
26<br />
397<br />
54<br />
186<br />
542<br />
22<br />
164<br />
531<br />
219<br />
996<br />
222<br />
143<br />
565<br />
164<br />
106<br />
687<br />
69<br />
487<br />
63<br />
124<br />
911<br />
34<br />
137<br />
799<br />
44<br />
286<br />
921<br />
175<br />
Turning Movement Counts<br />
(PM Peak Hour)<br />
Figure 22<br />
Legend:<br />
XX: PM Peak Hour Volumes<br />
Note: This figure is output from Synchro s<strong>of</strong>tware.<br />
inal Plan 08.217 - PM Base Peak AC 04/01/10 Hour Baseline S:\Yr 2008\08.217 Kedron\Synchro\march- revisions\08.217 PM- Mar2010.s<br />
name%
N<br />
81 (67)<br />
Kedron<br />
Traffic Assessment<br />
(1181) 476<br />
08.217 Base O 03/26/10<br />
715 (310)<br />
610 (233)<br />
(214) 338<br />
342 (768)<br />
(390) 640<br />
192 (425)<br />
(138) 157<br />
Legend:<br />
XX (YY): AM (PM) Peak Hour Volumes<br />
726 (551)<br />
706 (1108)<br />
(721) 1157<br />
(739) 256<br />
(405) 308<br />
262 (209)<br />
(207) 256<br />
125 (252)<br />
(155) 148<br />
(33) 53<br />
121 (158)<br />
187 (252)<br />
(232) 227 (328) 209<br />
280 (279)<br />
(320) 263<br />
382 (556)<br />
(337) 427<br />
244 (336)<br />
106 (124)<br />
158 (376)<br />
(358) 243<br />
(50) 126<br />
436 (658)<br />
(250) 575<br />
771 (1537)<br />
(981) 1780<br />
(438) 802<br />
(311) 568<br />
(78) 165<br />
833 (986)<br />
468 (633)<br />
181 (111)<br />
138 (100)<br />
(90) 97 (127) 129<br />
148 (253)<br />
(189) 253<br />
371 (242)<br />
(286) 177<br />
286 (202)<br />
245 (187)<br />
(145) 160<br />
787 (828)<br />
(612) 780<br />
187 (170)<br />
912 (1801)<br />
(1293) 1750<br />
209 (204)<br />
(1521) 1142<br />
1283 (1052)<br />
1181 (963)<br />
(1176) 951 (872) 856<br />
1089 (753)<br />
(765) 490<br />
1280 (1779)<br />
(1581) 1586<br />
784 (853)<br />
(960) 805<br />
(824) 483<br />
747 (483)<br />
(708) 346<br />
453 (251)<br />
(525) 586<br />
(375) 344<br />
321 (219)<br />
(215) 152<br />
99 (89)<br />
615 (408)<br />
(88) 131<br />
Grandview Rd. N.<br />
Townline Rd. N.<br />
2031 Total Traffic Flows<br />
Figure 23<br />
19 (120)<br />
216 (183)<br />
(161) 170<br />
Harmony Rd. N.<br />
1255 (1214)<br />
(1011) 919<br />
693 (654)<br />
(505) 566<br />
182 (174)<br />
(115) 128<br />
Ritson Rd. N.<br />
(1078) 927<br />
Wilson Rd. N.<br />
(681) 499<br />
Hwy 407<br />
Winchester Rd. E.<br />
Conlin Rd. E.<br />
29
N<br />
Grandview Rd. N.<br />
Townline Rd. N.<br />
Kedron<br />
Traffic Assessment<br />
Winchester Rd. E.<br />
Conlin Rd. E.<br />
08.217 Base AB 03/29/10<br />
LOS: C<br />
V/C: 0.90<br />
LOS: C (C)<br />
V/C: 0.97 (0.93)<br />
Legend:<br />
LOS (HCM Intersection Level <strong>of</strong> Service): AM (PM)<br />
V/C (HCM Intersection Volume-to-Capacity Ratio): AM (PM)<br />
LOS: C<br />
V/C: 0.90<br />
LOS: C (C)<br />
V/C: 0.93 (0.93)<br />
2031 Levels <strong>of</strong> Service and V/c ratios<br />
for AM/PM Peak Hour<br />
Figure 24<br />
Ritson Rd. N.<br />
Wilson Rd. N.<br />
Harmony Rd. N.<br />
Hwy 407<br />
30
Kedron<br />
Traffic Assessment<br />
OSHAWA<br />
MunicipalBoundary<br />
CLARINGTON<br />
PROPOSED 407 EAST<br />
TECHNICALLY PREFERRED ROUTE<br />
PROPOSED<br />
I.C.<br />
WINCHESTER RD E<br />
GreenbeltPlanArea<br />
Windfields<br />
PartIIPlan<br />
Np<br />
SamacSecondaryPlan<br />
S<br />
S<br />
TauntonPartIIPlan<br />
Cp<br />
POTENTIAL<br />
I.C.<br />
Np<br />
CONLIN RD E<br />
RITSON RD N<br />
WILSON RD N<br />
HARMONY RD N<br />
GRANDVIEW ST N<br />
TOWNLINE RD N<br />
Legend:<br />
Base Grid Transit Route (specified in Entra <strong>Report</strong>)<br />
Base Grid Transit Route (recommended by Poulos & Chung)<br />
Local Transit Route (recommended by Poulos & Chung)<br />
Potential Transit Routing<br />
Figure 25<br />
08.217 Base AE 03/26/10<br />
31
7.1 Transit Cost<br />
As part <strong>of</strong> this report a rudimentary cost estimate for transit to serve the Kedron area was<br />
completed. Figure 26 shows an estimated cost breakdown. The 2005 Entra report specifies<br />
operating hours and service frequencies for the different route types, dependant upon the time<br />
and day. These specifications were taken into account when computing the annual cost <strong>of</strong><br />
running transit. The estimated annual cost <strong>of</strong> running transit in the Kedron area is $2,260,730.00.<br />
The annual costs estimate is based on the following assumptions:<br />
• The local routes operate during the same hours as the base grid routes.<br />
• That the Kedron Part II Plan area is responsible for 20% <strong>of</strong> the costs associated with<br />
running these routes. This represents the fact that these routes will be serving other areas<br />
in <strong>Oshawa</strong> and Durham Region besides Kedron.<br />
The computation <strong>of</strong> the capital costs (which includes equipment costs) used general cost<br />
estimates provided by Durham Region supplemented by general information available in the<br />
Greater Toronto Area. The estimated capital cost <strong>of</strong> implementing transit in the Kedron area is<br />
$6,414,550.00. The capital costs estimate uses the following assumptions:<br />
• There will be a bus stop located every 400 metres (general value used by DRT).<br />
• That the Kedron site is responsible for 20% <strong>of</strong> the costs associated with the construction<br />
<strong>of</strong> the new <strong>Oshawa</strong> bus garage.<br />
• That the Kedron site is responsible for 20% <strong>of</strong> the cost <strong>of</strong> new vehicles required to<br />
service the area.<br />
The above transit capital and operating cost estimates require verification by Durham Region<br />
Transit.<br />
8.0 Additional Considerations<br />
Bicycling<br />
The bike network presented in the land use plan is congruent with the city’s proposed bike and<br />
trail network. Figure 27 shows a section <strong>of</strong> <strong>Oshawa</strong>’s cycle plan with the Kedron Part II Plan and<br />
North Kedron Concept Plan and East Windfields Concept Plans overlaid. From the figure it can<br />
be seen that the city’s plan flows into the site plan without interruption. The plan continues all<br />
proposed north-south paths and provides sufficient connection westward to the regional cycling<br />
Poulos & Chung Ltd.<br />
08.217 Kedron Traffic <strong>Report</strong> 14April2010.docx<br />
32
Kedron<br />
Traffic Assessment<br />
Annual Costs<br />
Route Type<br />
Time Period<br />
Hours Per<br />
Day<br />
Buses Per Hour<br />
(both Directions)<br />
Cost per Bus<br />
per Hour<br />
Number <strong>of</strong> Days<br />
per Week Cost<br />
Number <strong>of</strong><br />
Routes<br />
Total per<br />
week Total per year<br />
%<strong>of</strong>Routecost<br />
borne by Kedron<br />
Total per year<br />
for Kedron<br />
Base Grid M-F (all day) 18 4 92.58 5 $ 33,328.80<br />
Sat (all day) 18 2 92.58 1 $ 3,332.88<br />
Sun (all day) 16 2 92.58 1 $ 2,962.56<br />
Weekly Total $ 39,624.24 4 $ 158,496.96 $ 8,241,841.92 20% $ 1,648,368.38<br />
Local Routes M-F (peak) 7 4 92.58 5 $ 12,961.20<br />
M-F (<strong>of</strong>fpeak) 11 2 92.58 5 $ 10,183.80<br />
Sat (all day) 18 2 92.58 1 $ 3,332.88<br />
Sun (all day) 16 2 92.58 1 $ 2,962.56<br />
Weekly Total $ 29,440.44 2 $ 58,880.88 $ 3,061,805.76 20% $ 612,361.15<br />
Grand Total (per Year) $ 2,260,729.54<br />
Capital Costs Equipment Costs<br />
Total length <strong>of</strong> routes in planning area (m) 20000 Peak Hour Bus Requirements<br />
Spacing <strong>of</strong> bus Stops (m) 400 Base Grid 16<br />
Cost per bus stop $ 1,200.00<br />
Local Routes 8<br />
Total Cost $ 60,000.00<br />
Spare Buses 2<br />
Total Buses required 26<br />
Additional Costs Cost per Bus $ 460,000.00<br />
10%-15% <strong>of</strong> new garage $ 3,962,550.00<br />
% Kedron responsible for 20%<br />
Total $ 4,022,550.00<br />
Total $ 2,392,000.00<br />
Grand Total (Capital and Equipment costs) $ 6,414,550.00<br />
Transit Cost Estimate<br />
Figure 26<br />
08.217 Base AH 03/29/10<br />
33
Kedron<br />
<strong>Transportation</strong> Assessment<br />
N<br />
08.217 Base CP 03/31/10<br />
Note: Image has been modified from <strong>City</strong> <strong>of</strong> <strong>Oshawa</strong>,<br />
Corporate Services Department (2010).<br />
34<br />
Proposed <strong>Oshawa</strong> Trail Network<br />
Figure 27
spine along Simcoe Road that travels north towards Port Perry. Figure 28 shows Kedron’s<br />
location in the regional cycling plan.<br />
Highway 407<br />
The development’s utilization <strong>of</strong> the Proposed Highway 407 East Technically Preferred Route is<br />
presented in Figure 29. The figure shows the estimated amount <strong>of</strong> traffic utilizing the proposed<br />
interchanges at Simcoe Road and Harmony Road due to the development in the plan area by<br />
horizon year 2021.<br />
It is evident that the total site traffic flow demands can easily be accommodated by the on and <strong>of</strong>f<br />
ramps contained within the two Proposed Highway 407 East Technically Preferred Route<br />
interchanges.<br />
However, to protect for the complete flexibility <strong>of</strong> access to and from the Proposed Highway 407<br />
East Technically Preferred Route the road network in the preferred plan protects for an<br />
interchange opportunity with Highway 407 at Townline Road.<br />
The Type C Arterial Road which exits Kedron and intersects with Townline Road is situated<br />
over 500 meters south <strong>of</strong> the Highway 407 centre line. Such spacing permits flexibility in the<br />
long term to permit an interchange opportunity if needs, demands and directions <strong>of</strong> traffic flows<br />
alter or change.<br />
Poulos & Chung Ltd.<br />
08.217 Kedron Traffic <strong>Report</strong> 14April2010.docx<br />
35
Kedron<br />
Traffic Assessment<br />
08.217 Base W 01/22/10<br />
Legend:<br />
Site Area<br />
Regional Cycle Plan Study<br />
Figure 28<br />
36
N<br />
Simcoe St.<br />
Ritson Rd.<br />
Harmony Rd.<br />
Townline Rd.<br />
Kedron<br />
Traffic Assessment<br />
0 (0)<br />
Hwy 407<br />
0 (0)<br />
0 (0)<br />
139 (184)<br />
08.217 Base S 03/18/10<br />
0 (0)<br />
0 (0)<br />
183 (160)<br />
0 (0)<br />
Legend:<br />
XX (YY) : AM Peak (PM Peak)<br />
0 (0)<br />
0 (0)<br />
0 (0)<br />
599 (713)<br />
Site<br />
0 (0)<br />
165 (177)<br />
724 (621)<br />
178 (173)<br />
2021 Peak Hour 407 Ramp Traffic<br />
due to Site Development<br />
Figure 29<br />
37
9.0 Conclusions and Recommendations<br />
Completion <strong>of</strong> this analysis reveals that the proposed road network in the preferred plan is<br />
sufficient to meet the future traffic demands <strong>of</strong> the Kedron Part II Plana area, the North Kedron<br />
Industrial Area and the East Windfields Industrial Area. The development <strong>of</strong> ROPA 128, the<br />
Proposed Highway 407 East Technically Preferred Route, and the growth in background traffic<br />
were all taken into consideration during the analysis. All intersections are expected to perform at<br />
acceptable levels <strong>of</strong> service.<br />
In addition, the site is capable <strong>of</strong> integrating itself with the Region’s transit plans as well as the<br />
<strong>City</strong>’s cycle plan. A more detailed analysis <strong>of</strong> transit capital and operating costs will be required<br />
at later stages <strong>of</strong> the development process.<br />
Poulos & Chung Ltd.<br />
08.217 Kedron Traffic <strong>Report</strong> 14April2010.docx<br />
38
<strong>Appendix</strong> A – Phase 1 Traffic Assessment Status <strong>Report</strong>
Kedron Traffic Assessment Status <strong>Report</strong><br />
September 2009
1. Introduction<br />
Technical analysis <strong>of</strong> available information has commenced for the study area planning. The<br />
Region <strong>of</strong> Durham utilizing their Travel Demand Forecasting Model (EMME II) has provided<br />
outputs to assist in creating a base <strong>of</strong> information. These outputs are based on the 2008<br />
Consolidation <strong>of</strong> the Regional Official Plan (incorporating Amendment 114) and the 2008<br />
Development Charge Background Study Update.<br />
Schedule C from the Regional Official Plan 128 was used as base information to illustrate the<br />
Study Area and visually comprehend the existing and proposed transportation network. In<br />
addition the Region <strong>of</strong> Durham <strong>Transportation</strong> Master Plan was consulted to gain an appreciation<br />
<strong>of</strong> travel demand characteristics, patterns and directions. In addition the Plan provides clear<br />
direction for implementing travel demand management measures and efforts to shift travel<br />
demand from the automobile to transit and other sustainable modes.<br />
This technical appendix summarizes the elements <strong>of</strong> the existing and proposed transportation<br />
system that are critical to the Study Area.<br />
It also presents the technical analysis completed to date. This includes:<br />
• Existing roadway lane configurations and traffic controls;<br />
• Existing intersection turning movement count information;<br />
• EMME II area traffic zones including population and employment statistics;<br />
• EMME II outputs for existing conditions and forecast traffic flows for horizon years<br />
2012 and 2021.<br />
This information is the basis upon which transportation efforts can be used to evaluate land use<br />
and roadway options for the Study Area.<br />
Through this effort it is intended to:<br />
• Identify the optimal transportation system (roads, transit, pedestrian and bicycle) to<br />
serve all travel demands within the Study Area;<br />
• Identify the optimal transportation system serving travel demands not only to and<br />
from but also accommodating those demands that travel through the study area.<br />
08.217 Kedron Phase 1 background reportversion sent out with phase 2 report.docx Page 2
2. Study Area<br />
The study Area is located in the north east area <strong>of</strong> the <strong>City</strong> <strong>of</strong> <strong>Oshawa</strong>, and is bounded by Conlin<br />
Road East to the south, the <strong>Oshawa</strong> Creek and Ritson Road North to the west, the proposed<br />
Highway 407 Technically Preferred Route to the north and Townline Road North to the east.<br />
The location <strong>of</strong> the study area is shown in Figure 1.<br />
Existing area roads are illustrated along with the proposed Highway 407 East Technically<br />
Preferred Route.<br />
08.217 Kedron Phase 1 background reportversion sent out with phase 2 report.docx Page 3
Kedron<br />
<strong>Transportation</strong> Assessment<br />
N<br />
Winchester Rd.<br />
Conlin Rd.<br />
Taunton Rd.<br />
Rossland Rd.<br />
Thickson Rd.<br />
Thornton Rd.<br />
Stevenson Rd.<br />
Simcoe St.<br />
Riston Rd.<br />
Harmony Rd.<br />
Townline Rd.<br />
Dundas St.<br />
Wentworth St.<br />
Wentworth St.<br />
Legend<br />
Study Boundary<br />
Proposed 407 Alignment<br />
General Study Area<br />
Figure 1<br />
08.217 Base D 06/09/09
3. Road Network<br />
The existing road network consists <strong>of</strong> a series <strong>of</strong> Regional Roads and local concession roads.<br />
The Regional roads provide arterial functions and services not only for <strong>Oshawa</strong> but other areas<br />
<strong>of</strong> the Region. These roads typically with one lane in each direction <strong>of</strong> travel incorporate<br />
appropriate geometric standards to accommodate relatively high volumes <strong>of</strong> traffic at reasonably<br />
high vehicle speeds. The local concession roads also typically have one lane in each direction <strong>of</strong><br />
travel. However, these roads are designed to accommodate a lower traffic flow at lower vehicle<br />
speeds.<br />
The primary roads (Regional Roads) serving the study area are scheduled over time to be<br />
improved. These improvements will ensure that future automobile, truck and transit demands can<br />
be satisfactorily met.<br />
Figure 2 illustrates from the <strong>Transportation</strong> Master Plan Study the planned improvements to the<br />
roadway network identified in Schedule C <strong>of</strong> Regional Official Plan 128.<br />
The study area boundary is illustrated on top <strong>of</strong> the base planned road information. Of primary<br />
importance to the study area are those roads which provide a boundary road function, traverse<br />
through the study area or are in the immediate vicinity <strong>of</strong> the site. It is understood that not all <strong>of</strong><br />
the “Primary Roads” serving the study area are Regional Roads, and designation <strong>of</strong> an arterial<br />
road in the Region’s Official Plan does not imply that it is or will be under Regional jurisdiction.<br />
These roads include:<br />
• The east-west roads <strong>of</strong> Winchester Road and Conlin Road which are approximately<br />
on the northern and southern boundaries <strong>of</strong> the study are designated as Type B arterial<br />
roads;<br />
• The north-south roads <strong>of</strong> Simcoe Street, Ritson Road and Townline Road are<br />
designated as Type B arterial roads. Simcoe Street, although to the west <strong>of</strong> the site<br />
and Ritson Road provide direct connects to Downtown <strong>Oshawa</strong>;<br />
• The north-south roads <strong>of</strong> Wilson Road and Grandview Street are designated as Type<br />
C arterial roads;<br />
• The north-south roads <strong>of</strong> Harmony Road and Courtice Road / Enfield Road are<br />
designated as Type A arterial roads. Harmony Road which essentially bisects the<br />
study area, is planned with an interchange at Highway 407. Also, within the<br />
immediate vicinity <strong>of</strong> the interchange a transit terminal is planned with the Highway<br />
407 rapid transit way. Courtice Road with its planned direct connection with Enfiield<br />
Road also has a planned interchange with Highway 407. Both Harmony Road and<br />
Enfield Road / Courtice Road are expected to provide valuable accessibility to<br />
Highway 407;<br />
08.217 Kedron Phase 1 background reportversion sent out with phase 2 report.docx Page 5
• Immediately to the south <strong>of</strong> the Study Area is Taunton Road. It is designated as a<br />
Type A Arterial road and provides a direct connection to north-east Toronto and<br />
southern York Region.<br />
These Regional roads will be critical to provide direct access to the study area as well as<br />
connecting the Study Area to all parts <strong>of</strong> the Region <strong>of</strong> Durham and the Province <strong>of</strong> Ontario.<br />
The Study Area will formulate enhancements to the Type C arterial road network. This network<br />
will consist <strong>of</strong> new road elements and connections to and / or enhancements <strong>of</strong> existing local<br />
roads serving the local area.<br />
08.217 Kedron Phase 1 background reportversion sent out with phase 2 report.docx Page 6
BR OC K R D<br />
HARMON Y R D<br />
Kedron<br />
Traffic Assessment<br />
FREEWAY AND ARTERIAL<br />
ROAD NETWORK<br />
NOTES:<br />
Urban Area based on Regional Official Plan.<br />
This figure forms part <strong>of</strong> the Durham <strong>Transportation</strong><br />
Master Plan and must be read in conjunction with<br />
the text.<br />
This map is intended as a framework for planning<br />
and design. Consequently, all projects are subject<br />
to further detailed study in accordance with the<br />
Environmental Assessment Act.<br />
Existing<br />
Freeway<br />
Type A Arterial Road<br />
Type B Arterial Road<br />
Type C Arterial Road<br />
Interchanges<br />
Proposed<br />
X<br />
Existing Interchanges To Be Removed<br />
Railway<br />
Hamlet<br />
Urban Area (generalized)<br />
N<br />
BRAWLEY RD<br />
HOWDEN RD<br />
30<br />
C.PR . . Havelock<br />
Future<br />
Federal Airport<br />
COLUMBUS RD<br />
Study Area<br />
3<br />
HIGHWAY 407<br />
HIGHWAY 7<br />
WINCHESTER RD<br />
3<br />
27<br />
37<br />
FINCH AVE<br />
1<br />
C H URCH S T<br />
E D<br />
WESTN YR<br />
C.P.R. Belleville<br />
SALEM RD<br />
41<br />
TAUNTON RD<br />
AUDLEY RD<br />
LAKE RIDGE RD<br />
23<br />
31 36<br />
CORONATION<br />
RD<br />
4<br />
HIGHWAY 2<br />
12<br />
HIGHWAY<br />
BR O C K S T<br />
ANDERSO N ST<br />
D<br />
T HI CK O N R 26<br />
ROSSLAND RD<br />
CONLIN<br />
<strong>Oshawa</strong><br />
Airport<br />
RD<br />
ST EVENS O N 28<br />
RD<br />
SIMCOE ST<br />
RIT S O N RD<br />
TOWNLINE RD<br />
2 16<br />
33<br />
55<br />
COURTICE RD<br />
34<br />
T R ULLS RD<br />
LT NA RD<br />
A O<br />
WHITE S RD<br />
38<br />
DIXIE RD<br />
29<br />
24<br />
HIGHWAY 401<br />
X<br />
BAYLY ST<br />
22<br />
C.N.R. Kingston<br />
VICTORIA ST<br />
53<br />
X<br />
X<br />
BLOOR<br />
ST<br />
22<br />
LAKE ONTARIO<br />
<strong>Oshawa</strong><br />
Harbour<br />
L:\projects\<strong>Transportation</strong>_Master_Plan\TMP_MXD_2003\RecommendedPlan\13_FreewayArterial_2.cdr<br />
08.217 Base I 06/09/09<br />
Drawing has been modified to show latest Hwy 407<br />
alignment through study area.<br />
Image modified from Durham Region, 2003.<br />
Existing and Proposed Road Network<br />
Figure 2
4. Transit Network<br />
Durham Transit is expected to play an ever increasing important role to serve the typical travel<br />
demands <strong>of</strong> the Study Area. Transit is expected to accommodate over twenty-five percent <strong>of</strong> the<br />
typical peak hours and daily demand <strong>of</strong> travel. This is the upper range <strong>of</strong> transit modal split that<br />
will be examined for the Study Area. In discussions with Regional and Town staff, a lower<br />
transit modal split number will be selected and also assessed. This will provide an optimal range<br />
<strong>of</strong> transit service potential on the major and minor transit spines. The upper range was selected<br />
because the <strong>Transportation</strong> Master Plan has targeted a shift <strong>of</strong> approximately fifteen (15) percent<br />
from automobile travel in the weekday roadway peak hours to transit. Estimating that the<br />
existing transit modal split levels are within six to nine percent implies that the target 2021<br />
modal split should be in the range <strong>of</strong> twenty-five percent.<br />
Figure 3 illustrates the existing transit services in the immediate vicinity <strong>of</strong> the Study Area.<br />
It is evident that progressive additions and modifications can be made to transit as staged<br />
development within the Study Area commences.<br />
Figure 4 illustrates the planned major transit improvements to occur in the Region <strong>of</strong> Durham.<br />
These improvements are centered on key transit spines which will contain enhanced transit<br />
vehicle frequencies <strong>of</strong> service and transit priority measures.<br />
The Study Area is identified to illustrate which <strong>of</strong> these transit spines will directly serve<br />
anticipated travel demands. The key transit spines in the immediate vicinity <strong>of</strong> the study area<br />
include:<br />
• In the north-south direction <strong>of</strong> travel Simcoe Street, Harmony Road and Townline<br />
Road;<br />
• In the east-west direction Taunton Road and Conlin Road.<br />
These transit spines in combination with the Highway 407 rapid transit corridor provide a<br />
network <strong>of</strong> transit services linking and connecting to all primary regional and inter-regional<br />
attractors and generators.<br />
The Study Area will respect these transit spines and make every effort to provide direct and<br />
efficient extensions / connections to them.<br />
The Region is completing a Long Term Transit Strategy for the Region <strong>of</strong> Durham. It is<br />
anticipated the Study will be complete in 2010 and will identify future rapid transit corridors and<br />
transit services priorities. As a result it is expected that Schedule C – Map C3 <strong>of</strong> the 2008<br />
consolidation <strong>of</strong> the Regional Official Plan will be revised.<br />
08.217 Kedron Phase 1 background reportversion sent out with phase 2 report.docx Page 8
5. Pedestrian and Cyclist Network<br />
The Region <strong>of</strong> Durham and the <strong>City</strong> <strong>of</strong> <strong>Oshawa</strong> both have identified planned and proposed<br />
networks for pedestrians and bicyclists. These plans will form the basis for identifying<br />
extensions and connections, to / from and within the Study Area. The Study Area network will<br />
use the same standards, forms and functions as adopted in the Region <strong>of</strong> Durham and <strong>City</strong> <strong>of</strong><br />
<strong>Oshawa</strong> plans.<br />
6. Boundary Road Conditions<br />
An important addition to the roadway network is Highway 407. The technically preferred<br />
alignment is shown in Figure 5. The proposed interchanges at Simcoe Street, Harmony Road and<br />
Enfield Road are shown.<br />
Available traffic flow information has been reviewed. Existing intersection turning movement<br />
count information and the existing roadway lane configurations and controls have been<br />
summarized and presented in Figures 6 and 7.<br />
The “Synchro” s<strong>of</strong>tware program was used to analyze the intersections. Upon request the<br />
analysis will be provided in electronic format. The analysis indicates that the existing vehicle<br />
demands on the Study Area roads are being accommodated at very good levels <strong>of</strong> service.<br />
The existing road formation provides a sound base upon which network improvements and<br />
additions can be brought forth to serve future travel demands.<br />
08.217 Kedron Phase 1 background reportversion sent out with phase 2 report.docx Page 9
N<br />
Kedron<br />
Traffic Assessment<br />
Study area continues past map border<br />
Study Area<br />
08.217 Base F 06/09/09<br />
Image modified from Durham Region Transit, 2009<br />
Current Area Transit<br />
Figure 3
2<br />
CITY OF OSHAWA<br />
<strong>Transportation</strong> Centres<br />
Municipal Boundaries<br />
Urban Area<br />
Note: Dashed lines represent Transit<br />
Priority corridors on future roads.<br />
Study Area<br />
N<br />
IJ<br />
3<br />
Kedron<br />
<strong>Transportation</strong> Assessment<br />
50<br />
48<br />
N<br />
TRANSIT PRIORITY<br />
NETWORK<br />
Lake<br />
Simcoe<br />
23<br />
23<br />
48<br />
23<br />
TOWNSHIP OF BROCK<br />
12<br />
12<br />
15<br />
7<br />
NOTES:<br />
Urban area based on Regional Official Plan.<br />
This figure forms part <strong>of</strong> the Durham <strong>Transportation</strong><br />
Master Plan and must be read in conjunction with<br />
the text.<br />
This map is intended as a framework for planning and<br />
design. Consequently, all projects are subject to further<br />
detailed study in accordance with the Environmental<br />
Assessment Act. Enlargement Detail<br />
Major Transit Corridors<br />
Minor Transit Corridors<br />
! Highway 407 Transit Corridor<br />
Highway 401 Bus Rapid Transit<br />
Future <strong>Transportation</strong> Corridor<br />
! ! "Mainstreet" Highway 2<br />
Commuter Rail<br />
30<br />
39<br />
13<br />
TOWNSHIP OF<br />
UXBRIDGE<br />
8<br />
11<br />
47<br />
13<br />
1<br />
1<br />
13<br />
23<br />
10<br />
13<br />
47<br />
8<br />
7/12<br />
7/12<br />
13<br />
6<br />
2<br />
Lake<br />
2<br />
7<br />
Scugog<br />
7A<br />
57<br />
³<br />
ST<br />
407<br />
CITY OF PICKERING<br />
IJ<br />
1<br />
ST<br />
7<br />
IJ<br />
5<br />
IJ<br />
23<br />
IJ<br />
TOWN OF WHITBY<br />
ST<br />
ST IJ<br />
7<br />
5<br />
7/12<br />
3<br />
47<br />
27<br />
CITY OF PICKERING<br />
407<br />
38<br />
4<br />
1<br />
1<br />
7<br />
21<br />
5<br />
23<br />
31<br />
TOWN<br />
OF AJAX<br />
2<br />
401<br />
22<br />
23<br />
7/12<br />
TOWN OF<br />
WHITBY<br />
7<br />
5<br />
21<br />
28<br />
401<br />
26<br />
7/12<br />
2<br />
CITY OF<br />
OSHAWA<br />
3<br />
2<br />
TOWNSHIP OF<br />
SCUGOG<br />
19<br />
33<br />
55<br />
34<br />
7A<br />
3<br />
2<br />
57<br />
57<br />
MUNICIPALITY<br />
OF<br />
CLARINGTON<br />
14<br />
20<br />
4<br />
42<br />
0 1 2 4 6 8 10<br />
Kilometres<br />
35<br />
35/115<br />
115<br />
9<br />
18<br />
IJ<br />
27<br />
IJ<br />
38<br />
!<br />
! !<br />
!<br />
!<br />
! !<br />
IJ<br />
4<br />
! !<br />
!<br />
")<br />
! !<br />
2<br />
ST<br />
401<br />
!<br />
IJ<br />
31<br />
TOWN<br />
OF AJAX<br />
!<br />
IJ 41 !<br />
!<br />
! ! !<br />
2<br />
! ! !<br />
IJ<br />
! ! ! ! !<br />
IJ<br />
! ! !<br />
ST<br />
22 401<br />
28<br />
IJ<br />
26<br />
! !<br />
!<br />
!<br />
IJ<br />
!<br />
!<br />
!<br />
!<br />
!<br />
!<br />
!<br />
IJ<br />
33<br />
!<br />
!<br />
IJ IJ<br />
55<br />
! !<br />
!<br />
!<br />
34<br />
!<br />
")<br />
! !<br />
!<br />
!<br />
See Enlargement for Detail<br />
401<br />
2<br />
401<br />
Lake Ontario<br />
0 1 2 4 6 8 10<br />
Kilometres<br />
08.217 Base H 06/09/09<br />
Drawing has been modified to show latest Hwy 407<br />
alignment through study area.<br />
Image modified from Durham Region, 2003.<br />
Future Area Transit<br />
Figure 4
7. Forecast Traffic Flows<br />
Several Figures are attached <strong>Appendix</strong> A which illustrate the EMME II outputs as provided by<br />
the Region <strong>of</strong> Durham. The outputs include:<br />
• Roadway p. m. peak hour auto volumes generated by traffic zone centroid for 2006,<br />
2012 and 2021;<br />
• Roadway p. m. peak hour auto link volumes for 2006, 2012 and 2021;<br />
• Roadway attributes used in the model analysis;<br />
• An area traffic zone map;<br />
• The 2006, 2012 and 2021 population and employment numbers used by the<br />
transportation model in each traffic zone.<br />
The above information was used to:<br />
• Review the forecast vehicle flows by existing condition and horizon year;<br />
• Ascertain the population and employment numbers in the study area and used by the<br />
EMME II model to generate traffic flows;<br />
• Determine the amount <strong>of</strong> traffic flow generated by this population and employment,<br />
(within the Study Area) and following standard assignment patterns, and then;<br />
• Subtract this traffic flow (generated by the Study Area) out <strong>of</strong> the forecast horizon<br />
year total traffic flows.<br />
This analysis approach permits all other planned forecast traffic flow demand to remain on the<br />
road network <strong>of</strong> the Study Area and environs.<br />
This now permits the study team to examine alternative land use / transportation systems and<br />
network options. In calculating travel demands by option, comparisons and evaluations can be<br />
completed leading to the selection <strong>of</strong> an optimum transportation system / network.<br />
Prior to commencing this analysis Poulos & Chung Limited will meet with Region <strong>of</strong> Durham<br />
and <strong>City</strong> <strong>of</strong> <strong>Oshawa</strong> staff to verify all analysis parameters and inputs. These will range from trip<br />
generation rates, trip distribution and modal split considerations. Once these have been verified<br />
they will be applied to the land use plans and formations brought forward by the project team.<br />
The vehicle / transit demands generated by the study area will be summarized in a tabular and<br />
illustrative format to easily understand the magnitude <strong>of</strong> travel demand and the primary<br />
directions <strong>of</strong> travel. This will be done for the assessment <strong>of</strong> alternative road network<br />
opportunities and for the protection <strong>of</strong> future extensions and connections. This output will be<br />
reviewed with Region <strong>of</strong> Durham and <strong>City</strong> <strong>of</strong> <strong>Oshawa</strong> staff. Once this fine turning has been<br />
completed, it is expected in the final stages <strong>of</strong> the evaluation that a request will be made <strong>of</strong><br />
Durham Region to provide additional EMME II outputs to verify the analysis.<br />
It is anticipated that such an approach will:<br />
08.217 Kedron Phase 1 background reportversion sent out with phase 2 report.docx Page 12
• Define the optimal road network and transit system for the Study Area;<br />
• Provide demand input towards protecting for potential road crossings <strong>of</strong> Highway<br />
407;<br />
• Provide demand input towards protecting for a potential interchange at Townline<br />
Road with Highway 407.<br />
Upon completion <strong>of</strong> the analysis process and verification provided by additional EMME II<br />
model runs a final report will be produced.<br />
The report will in effect be the Phase 1 and Phase 2 transportation analysis <strong>of</strong> an Environmental<br />
Assessment Study. The report will document all roadway / land use alternatives investigated. It<br />
will document all vehicle demand flows, including transit and form the basis for need and<br />
justification. Through the evaluation <strong>of</strong> the alternatives a preferred roadway network / transit<br />
system plan will be recommended. A draft final report will be prepared and circulated to the<br />
Region <strong>of</strong> Durham and the <strong>City</strong> <strong>of</strong> <strong>Oshawa</strong> for comments and input prior to finalization <strong>of</strong> the<br />
document.<br />
08.217 Kedron Phase 1 background reportversion sent out with phase 2 report.docx Page 13
Kedron<br />
<strong>Transportation</strong> Assessment<br />
08.217 Base E 06/03/09<br />
Highway 407<br />
Proposed Alignment<br />
Figure 5
Kedron<br />
<strong>Transportation</strong> Assessment<br />
N<br />
80 km/h<br />
Grandview St. N.<br />
50 km/h<br />
50 km/h<br />
80 km/h 50 km/h<br />
60 km/h<br />
Winchester Rd. E.<br />
Consession Rd. 7<br />
Intersection Level <strong>of</strong><br />
Service: A<br />
Intersection Level <strong>of</strong><br />
Service: D<br />
80 km/h<br />
80 km/h<br />
Harmony Rd. N.<br />
Ritson Rd. N.<br />
Townline Rd. N.<br />
Intersection Level <strong>of</strong><br />
Service: C<br />
Intersection Level <strong>of</strong><br />
Service: B<br />
50 km/h<br />
50 km/h 70 km/h<br />
Conlin Rd. E.<br />
60 km/h<br />
Legend<br />
80 km/h<br />
Stop Sign<br />
Traffic Light<br />
Speed Limit<br />
Lane Configurations and<br />
Traffic Control<br />
Figure 6<br />
08.217 Base E 06/03/09
Kedron<br />
<strong>Transportation</strong> Assessment<br />
N<br />
4267 (3980)<br />
Consession Rd. 7<br />
Townline Rd. N.<br />
Grandview St. N.<br />
(146) 35<br />
(137) 31<br />
1 (3)<br />
218 (80)<br />
48 (36)<br />
12 (74)<br />
33 (39)<br />
241 (132)<br />
67 (22)<br />
151 (80)<br />
25 (15)<br />
7 (41)<br />
230 (211)<br />
86 (104)<br />
(0) 0<br />
(33) 17<br />
(5) 4<br />
(8) 4<br />
(279) 58<br />
(252) 101<br />
Harmony Rd. N.<br />
Winchester Rd. E.<br />
Conlin Rd. E.<br />
1 (1)<br />
119 (57)<br />
(2) 0<br />
(43) 146<br />
(94) 28<br />
(288) 156<br />
(6) 7<br />
9858 (7483)<br />
(7) 4<br />
(122) 50<br />
(100) 46<br />
18 (21)<br />
324 (119)<br />
21 (25)<br />
21 (31)<br />
210 (196)<br />
158 (128)<br />
Ritson Rd. N.<br />
(17) 18<br />
(270) 181<br />
(5) 13<br />
(13) 5<br />
(224) 89<br />
(163) 102<br />
08.217 Base E 06/03/09<br />
Legend<br />
Peak Hours:<br />
ADT:<br />
AM (PM)<br />
Spring (Summer)<br />
Data from Durham Region, 2007.<br />
Turning Movement Counts<br />
and ADT values<br />
Figure 7
6224<br />
6223<br />
6250<br />
6211<br />
6212 6222<br />
6301<br />
6644<br />
6311<br />
6700<br />
6690<br />
6410<br />
6221<br />
6682<br />
6363<br />
6670<br />
6661<br />
6371<br />
6373<br />
6643<br />
6471<br />
6351<br />
6442<br />
6333<br />
6331<br />
6550<br />
6523<br />
6335<br />
6391 6393<br />
6454<br />
6434<br />
6590<br />
6463<br />
6323<br />
6633<br />
6362<br />
6245<br />
6662<br />
6571<br />
6482<br />
6352<br />
6292<br />
6581<br />
6501<br />
6242<br />
6432<br />
6583<br />
6383<br />
6502<br />
6600<br />
6341<br />
6481<br />
6444<br />
6532<br />
6451<br />
6343<br />
6572<br />
6291<br />
6246<br />
6232<br />
6382<br />
6374<br />
6524<br />
6453<br />
6313<br />
6244<br />
6243<br />
6522<br />
6472<br />
6562<br />
6263<br />
6293<br />
6332<br />
6381<br />
6241<br />
6431 6443<br />
6282<br />
6642<br />
6324<br />
6561<br />
6421<br />
6610<br />
6511<br />
6521<br />
6681<br />
6384<br />
6334<br />
6422<br />
6233<br />
6492<br />
6641<br />
6433<br />
6464<br />
6361<br />
6312<br />
6652<br />
6452<br />
6622<br />
6632<br />
6621<br />
6303<br />
6394<br />
6302<br />
6392<br />
6441<br />
6372<br />
6336 6342 6344<br />
6271 6272 6273<br />
6513<br />
6491<br />
6631<br />
6231<br />
6461<br />
6402<br />
6531<br />
6281<br />
6321<br />
6322<br />
6401<br />
6512<br />
6540<br />
6462<br />
6651<br />
6261<br />
6582<br />
6294<br />
6573<br />
6262<br />
6690<br />
<strong>City</strong> <strong>of</strong> <strong>Oshawa</strong><br />
<strong>Transportation</strong> Zones
The tables below are the employment and population forecasts for the <strong>Oshawa</strong> TAZ's.<br />
The highlighted zones represent the study area.<br />
TAZ<br />
Population<br />
Employment<br />
Population<br />
Employment<br />
TAZ<br />
2006 2012 2021 2006 2012 2021 2006 2012 2021 2006 2012 2021<br />
6211 325 335 349 34 36 38 6410 7 10 15 77 79 81<br />
6212 170 176 183 1 1 2 6421 916 940 972 287 294 302<br />
6221 77 80 83 6 7 7 6422 1,720 1,753 1,799 52 56 61<br />
6222 57 59 62 2 3 3 6431 1,707 1,745 1,795 548 571 587<br />
6223 46 47 49 6 7 7 6432 1,962 2,013 2,082 442 460 475<br />
6224 129 133 139 4 4 5 6433 5,485 5,504 5,529 464 491 520<br />
6231 15 16 16 0 0 0 6434 2,817 2,877 2,957 268 279 290<br />
6232 3 3 3 0 0 0 6441 1,074 1,087 1,104 488 520 553<br />
6233 6 6 7 0 0 0 6442 8,885 8,953 9,044 243 254 266<br />
6241 27 28 29 0 0 0 6443 1,198 1,422 1,783 213 239 274<br />
6242 51 53 55 0 0 1 6444 651 697 759 5 9 15<br />
6243 27 28 29 30 30 31 6451 1,953 2,105 2,346 27 42 63<br />
6244 98 101 105 0 1 1 6452 2,063 2,087 2,120 3 5 8<br />
6245 23 24 25 0 0 0 6453 281 1,128 2,492 51 129 246<br />
6246 40 42 43 0 0 0 6454 473 634 894 22 37 60<br />
6250 66 69 73 0 1 1 6461 2,081 2,113 2,157 196 203 210<br />
6261 6 6 7 0 0 0 6462 1,097 1,110 1,128 123 128 132<br />
6262 12 13 13 3 4 4 6463 3,228 3,283 3,357 665 684 701<br />
6263 6 6 7 0 0 0 6464 882 900 924 96 101 106<br />
6271 94 98 103 18 18 19 6471 2,917 2,978 3,062 220 230 241<br />
6272 78 81 85 27 28 28 6472 3,595 3,628 3,674 1,191 1,238 1,281<br />
6273 14 19 27 1 1 2 6481 1,579 1,610 1,651 1,812 1,849 1,882<br />
6281 14 15 16 0 0 0 6482 4,200 4,250 4,317 1,147 1,173 1,191<br />
6282 3 3 3 0 0 0 6491 1,400 1,406 1,414 1,844 1,909 1,964<br />
6291 30 31 33 83 117 178 6492 2,397 2,409 2,424 2,511 2,587 2,638<br />
6292 6 6 7 0 0 0 6501 3,030 3,079 3,145 178 183 188<br />
6293 24 25 26 0 0 0 6502 3,962 4,005 4,064 269 279 289<br />
6294 19 20 22 0 0 0 6511 1,866 1,898 1,942 365 395 417<br />
6301 60 63 66 11 12 12 6512 932 947 968 356 367 376<br />
6302 25 26 55 0 0 1 6513 1,247 1,267 1,293 36 38 41<br />
6303 7 8 8 4 86 815 6521 2,013 2,098 2,230 2 10 21<br />
6311 32 33 35 0 0 0 6522 1,617 1,656 1,709 437 449 460<br />
6312 25 26 27 0 198 1,967 6523 2,467 2,942 3,706 85 130 196<br />
6313 5 5 5 0 0 0 6524 828 871 929 579 600 621<br />
6321 0 0 0 0 74 732 6531 1,842 1,865 1,896 208 215 222<br />
6322 156 156 156 1,469 1,621 1,865 6532 3,249 3,279 3,321 417 441 468<br />
6323 3 3 122 43 84 404 6540 23 23 23 2,660 2,765 2,853<br />
6324 3 147 381 42 61 91 6550 4,501 4,536 4,582 1,320 1,390 1,464<br />
6331 74 152 909 27 184 1,334 6561 1,994 2,002 2,013 2,948 3,065 3,174<br />
6332 0 147 1,573 11 24 144 6562 3,416 3,432 3,453 1,139 1,198 1,265<br />
6333 34 160 1,384 1,611 1,821 2,198 6571 4,200 4,260 4,342 241 253 264<br />
6334 0 384 1,004 0 35 87 6572 2,630 2,678 2,741 726 746 764<br />
6335 21 65 494 360 527 838 6573 393 401 410 8 9 10<br />
6336 308 472 737 6 21 44 6581 2,979 3,026 3,090 167 175 183<br />
6341 2 711 1,852 0 32 86 6582 560 568 579 1 2 3<br />
6342 7 408 1,153 2 39 102 6583 2,250 2,293 2,352 262 273 285<br />
6343 5 443 1,149 275 500 900 6590 93 121 159 1,185 1,572 1,864<br />
6344 7 333 858 0 30 74 6600 3,469 3,520 3,589 311 320 329<br />
6351 9 129 1,295 0 130 1,292 6610 1,419 1,420 1,421 1,531 1,610 1,690<br />
6352 7 7 294 46 58 91 6621 1,653 1,683 1,723 190 198 205<br />
6361 18 18 18 129 148 231 6622 1,495 1,524 1,563 79 83 88<br />
6362 83 88 97 1,928 3,242 4,563 6631 159 162 168 14 14 15<br />
6363 111 111 111 1,007 1,382 2,941 6632 1,909 1,933 1,966 168 175 181<br />
6371 1,135 1,166 1,214 1,094 1,118 1,139 6633 2,180 2,211 2,253 295 307 317<br />
6372 1,312 1,333 1,362 18 21 23 6641 17 29 44 7,544 7,617 7,585<br />
6373 2,162 2,229 2,333 115 123 134 6642 0 0 0 557 627 736<br />
6374 2,444 2,511 2,615 291 312 338 6643 0 0 0 3,466 4,517 5,322<br />
6381 789 1,334 2,212 156 208 285 6644 1 1 2 2,739 2,882 2,959<br />
6382 2,102 2,280 2,563 216 241 274 6651 990 1,000 1,014 589 605 609<br />
6383 948 1,587 2,630 100 160 250 6652 4,462 4,482 4,511 129 133 137<br />
6384 652 1,169 2,001 14 61 132 6661 2,351 2,414 2,498 2,589 2,648 2,687<br />
6391 24 698 1,783 0 61 153 6662 850 869 895 1,490 1,598 1,678<br />
6392 182 294 473 598 626 654 6670 7,278 7,361 7,472 1,318 1,349 1,358<br />
6393 248 910 1,976 26 87 177 6681 1,279 1,302 1,333 125 130 135<br />
6394 682 918 1,297 42 64 97 6682 3,491 3,537 3,600 708 728 745<br />
6401 1 2 3 21 22 23 6690 318 324 333 3,780 4,034 5,260<br />
6402 2,251 2,251 2,251 0 0 0 6700 0 0 0 1,245 1,385 2,442
10<br />
1<br />
60<br />
16<br />
3<br />
9<br />
4<br />
9<br />
54<br />
13<br />
35<br />
57<br />
54<br />
27<br />
66<br />
Co<br />
40<br />
28<br />
13<br />
25<br />
36<br />
26<br />
18<br />
38<br />
d.<br />
Enfield Rd.<br />
49<br />
2<br />
5<br />
65<br />
51<br />
30<br />
41<br />
22<br />
19<br />
4<br />
17<br />
2006 PM Peak Hour Auto Volume for Centroid Connectors<br />
Legend<br />
Traffic Zone Boundary<br />
Road Link<br />
Centroid Connector<br />
4<br />
2<br />
6<br />
3<br />
6<br />
11<br />
3<br />
5<br />
1<br />
16<br />
11<br />
1<br />
3<br />
2<br />
2<br />
1<br />
2<br />
5<br />
2<br />
1<br />
Conlin Rd.<br />
25<br />
56<br />
Simcoe St<br />
5<br />
10<br />
26<br />
75<br />
329<br />
135<br />
9<br />
11<br />
1<br />
1<br />
7<br />
1<br />
1<br />
2<br />
2<br />
31<br />
21<br />
85<br />
137<br />
1<br />
1<br />
1<br />
1<br />
25<br />
88<br />
1<br />
88<br />
75<br />
77<br />
93<br />
205<br />
1<br />
7<br />
4<br />
3<br />
35<br />
122<br />
2<br />
242<br />
296<br />
85<br />
1<br />
45<br />
23<br />
15<br />
38<br />
112<br />
199<br />
104<br />
213<br />
43<br />
116<br />
216<br />
246<br />
61<br />
180<br />
21<br />
4<br />
50<br />
45<br />
N<br />
Ritson Rd N<br />
Harmony Rd<br />
Taunton Rd E<br />
137<br />
81<br />
76<br />
18<br />
6<br />
16<br />
15<br />
20<br />
9<br />
11<br />
28<br />
4<br />
3<br />
10<br />
29<br />
1<br />
1<br />
21<br />
63<br />
1<br />
1<br />
1<br />
1<br />
1<br />
1<br />
1<br />
4<br />
2<br />
12<br />
ard Rd.<br />
136<br />
49<br />
5<br />
1<br />
1<br />
212<br />
133<br />
36<br />
17<br />
10<br />
5<br />
21<br />
40<br />
6<br />
4<br />
1<br />
2<br />
1<br />
ncester Rd<br />
249<br />
60<br />
24<br />
91<br />
hickson Rd N<br />
7<br />
5<br />
0
7<br />
161<br />
Co<br />
112<br />
134<br />
110<br />
255<br />
115<br />
283<br />
423<br />
752<br />
317<br />
513<br />
12<br />
550<br />
311<br />
400<br />
331<br />
550<br />
19<br />
53<br />
39<br />
64<br />
d.<br />
37<br />
Enfield Rd.<br />
7<br />
Conlin Rd.<br />
331<br />
110<br />
255<br />
155<br />
200<br />
180<br />
395<br />
19<br />
712<br />
25<br />
5<br />
26<br />
379 378<br />
2<br />
5<br />
208<br />
Taunton Rd E<br />
674<br />
418<br />
22<br />
4 30<br />
49<br />
4<br />
188<br />
402<br />
723<br />
2006 PM Peak Hour Auto Link Volume<br />
No. <strong>of</strong> Lanes - One Way<br />
1 Lane<br />
2 Lanes<br />
3 Lanes<br />
4<br />
87<br />
471<br />
4<br />
88<br />
96<br />
15<br />
283<br />
5<br />
8<br />
111 97<br />
8<br />
6<br />
98<br />
485<br />
464 485<br />
108<br />
14<br />
27<br />
106 104<br />
312 310<br />
502<br />
323 323<br />
511 512<br />
323<br />
511<br />
14<br />
10<br />
515<br />
513<br />
501<br />
352<br />
333<br />
441 441<br />
701 702<br />
513<br />
701<br />
182<br />
249<br />
5<br />
1 6<br />
14<br />
12<br />
469<br />
281<br />
9<br />
97<br />
441<br />
7 7<br />
112<br />
26<br />
3<br />
12<br />
10<br />
5<br />
109<br />
325<br />
9<br />
4<br />
501<br />
Simcoe St<br />
485<br />
700<br />
10<br />
378<br />
429<br />
371<br />
498<br />
366<br />
686<br />
554<br />
386<br />
309<br />
808<br />
290<br />
66<br />
643<br />
191<br />
290<br />
267<br />
84<br />
65<br />
11<br />
366<br />
194<br />
379<br />
253<br />
248<br />
260<br />
76<br />
306<br />
198<br />
504<br />
272<br />
500<br />
533<br />
347<br />
562<br />
543<br />
313<br />
380<br />
705 726<br />
120<br />
475<br />
267<br />
298<br />
254<br />
259<br />
640<br />
358<br />
392<br />
274<br />
298<br />
499<br />
87<br />
537<br />
715<br />
477<br />
56<br />
328<br />
640<br />
726<br />
74<br />
384<br />
273<br />
562<br />
219<br />
855<br />
114<br />
147<br />
910<br />
364<br />
635<br />
307<br />
10<br />
36<br />
85<br />
291<br />
683<br />
592<br />
631<br />
518<br />
1274<br />
194<br />
501<br />
686<br />
19<br />
41<br />
44<br />
19 277<br />
734<br />
568<br />
265 290<br />
290<br />
195<br />
378<br />
193<br />
66 66<br />
505<br />
307<br />
76 76<br />
643<br />
267<br />
136<br />
84<br />
44<br />
1<br />
33<br />
127<br />
62<br />
251<br />
7<br />
168<br />
320<br />
477<br />
58<br />
94<br />
481<br />
321<br />
37<br />
798<br />
494<br />
697<br />
141<br />
331<br />
348<br />
10<br />
41<br />
323<br />
392<br />
271<br />
36<br />
N<br />
Ritson Rd N<br />
Harmony Rd<br />
461<br />
363<br />
36<br />
1<br />
607<br />
647<br />
219<br />
7<br />
113<br />
556<br />
580<br />
646<br />
ncester Rd<br />
489<br />
0<br />
696<br />
154<br />
136<br />
94<br />
hickson Rd N<br />
ard Rd.<br />
3<br />
136<br />
154<br />
309<br />
384
7<br />
222<br />
Co<br />
205<br />
214<br />
177<br />
306<br />
254<br />
392<br />
614<br />
892<br />
427<br />
625<br />
32<br />
656<br />
395<br />
510<br />
434<br />
656<br />
43<br />
100<br />
66<br />
110<br />
d.<br />
63<br />
Enfield Rd.<br />
9<br />
Conlin Rd.<br />
434<br />
177<br />
306<br />
185<br />
187<br />
10<br />
14<br />
1<br />
265<br />
4<br />
214<br />
Taunton Rd E<br />
480<br />
868<br />
521<br />
4<br />
962<br />
47<br />
63<br />
8<br />
7<br />
1<br />
43<br />
393<br />
2012 PM Peak Hour Auto Link Volume<br />
No. <strong>of</strong> Lanes - One Way<br />
1 Lane<br />
2 Lanes<br />
3 Lanes<br />
12<br />
193<br />
552<br />
114<br />
9<br />
194<br />
17<br />
254<br />
15<br />
12<br />
268 202<br />
13<br />
11<br />
237<br />
563<br />
509 531<br />
240<br />
25<br />
2<br />
1<br />
13<br />
44<br />
515<br />
251<br />
0<br />
8<br />
43<br />
155 121<br />
308 296<br />
566<br />
428 420<br />
542 541<br />
11<br />
263<br />
428<br />
542<br />
11<br />
45<br />
577<br />
115<br />
554<br />
544<br />
416<br />
379<br />
573 572<br />
719 719<br />
573<br />
6 7<br />
267<br />
10<br />
44<br />
430<br />
8<br />
5<br />
579<br />
719<br />
553<br />
226<br />
293<br />
572<br />
687<br />
13<br />
262<br />
476<br />
476<br />
7<br />
420<br />
587<br />
391<br />
487<br />
661<br />
709<br />
183<br />
388<br />
409<br />
21<br />
861<br />
456<br />
204<br />
727<br />
304<br />
476<br />
470 456<br />
305<br />
407<br />
170<br />
251<br />
281<br />
159<br />
408<br />
564<br />
352<br />
631<br />
629<br />
412<br />
615<br />
679<br />
389<br />
530<br />
764 856<br />
173<br />
584 586<br />
425<br />
523<br />
376<br />
308<br />
269<br />
525<br />
755<br />
413<br />
504<br />
534<br />
589<br />
634<br />
129<br />
639<br />
1003<br />
606<br />
60<br />
378<br />
755<br />
856<br />
129<br />
468<br />
334<br />
758<br />
517<br />
984<br />
100<br />
103<br />
1018<br />
512<br />
994<br />
593<br />
27<br />
194<br />
236<br />
291<br />
1038<br />
705<br />
612<br />
653<br />
1473<br />
268<br />
590<br />
726663<br />
43<br />
3<br />
Simcoe St<br />
478<br />
268<br />
709<br />
269<br />
391<br />
493<br />
306<br />
66<br />
204<br />
403<br />
568<br />
368<br />
206<br />
400<br />
108<br />
52<br />
39<br />
9<br />
77<br />
148<br />
398<br />
17<br />
66 79<br />
39<br />
159<br />
410<br />
161<br />
712<br />
66<br />
577<br />
123<br />
2<br />
156<br />
390<br />
325<br />
36<br />
42<br />
979<br />
608<br />
473<br />
895<br />
661<br />
0<br />
178<br />
465<br />
485<br />
27<br />
46<br />
406<br />
447<br />
350<br />
N<br />
Ritson Rd N<br />
Harmony Rd<br />
587<br />
672<br />
49<br />
3<br />
666<br />
736<br />
270<br />
12<br />
267<br />
592<br />
643<br />
616<br />
ncester Rd<br />
625<br />
4<br />
802<br />
179<br />
157<br />
74<br />
hickson Rd N<br />
ard Rd.<br />
3<br />
157<br />
179<br />
436<br />
607
11<br />
1<br />
2<br />
2<br />
17<br />
66<br />
0<br />
7<br />
16<br />
13<br />
57<br />
63<br />
28<br />
63<br />
Co<br />
44<br />
30<br />
7<br />
17<br />
42<br />
29<br />
24<br />
55<br />
d.<br />
Enfield Rd.<br />
137<br />
81<br />
9<br />
10<br />
119<br />
66<br />
156<br />
105<br />
6<br />
8<br />
23<br />
2012 PM Peak Hour Auto Volume for Centroid Connectors<br />
Legend<br />
Traffic Zone Boundary<br />
Road Link<br />
Centroid Connector<br />
5<br />
3<br />
7<br />
3<br />
6<br />
11<br />
3<br />
3<br />
1<br />
10<br />
11<br />
1<br />
42<br />
19<br />
3<br />
18<br />
11<br />
2<br />
2<br />
2<br />
1<br />
2<br />
Conlin Rd.<br />
98<br />
133<br />
Simcoe St<br />
5<br />
13<br />
27<br />
17<br />
57<br />
90<br />
44<br />
113<br />
5<br />
381<br />
8<br />
5<br />
3<br />
176<br />
37<br />
48<br />
36<br />
27<br />
4<br />
11<br />
11<br />
45<br />
32<br />
12<br />
3<br />
4<br />
18<br />
40<br />
50<br />
43<br />
34<br />
3<br />
10<br />
7<br />
103<br />
69<br />
54<br />
110<br />
6<br />
45<br />
31<br />
2<br />
6<br />
2<br />
2<br />
68<br />
14<br />
14<br />
1<br />
97<br />
96<br />
2<br />
3<br />
13<br />
1<br />
77<br />
113<br />
85<br />
1<br />
91<br />
6<br />
199<br />
27<br />
10<br />
18<br />
6<br />
6<br />
68<br />
26<br />
126<br />
3<br />
246<br />
307<br />
89<br />
12<br />
54<br />
17<br />
24<br />
53<br />
113<br />
205<br />
128<br />
289<br />
49<br />
123<br />
243<br />
276<br />
72<br />
185<br />
23<br />
7<br />
60<br />
57<br />
N<br />
Ritson Rd N<br />
Harmony Rd<br />
Taunton Rd E<br />
136<br />
90<br />
77<br />
19<br />
7<br />
12<br />
15<br />
26<br />
19<br />
23<br />
16<br />
32<br />
10<br />
4<br />
17<br />
18<br />
6<br />
17<br />
2<br />
9<br />
15<br />
36<br />
2<br />
53<br />
ard Rd.<br />
3<br />
135<br />
58<br />
2<br />
1<br />
7<br />
21<br />
143<br />
5<br />
2<br />
1<br />
2<br />
435<br />
268<br />
32<br />
23<br />
65<br />
21<br />
14<br />
71<br />
3<br />
2<br />
2<br />
1<br />
ncester Rd<br />
146<br />
270<br />
80<br />
45<br />
132<br />
hickson Rd N<br />
18<br />
14<br />
9
308<br />
Co<br />
281<br />
117<br />
171<br />
578<br />
997<br />
233<br />
391<br />
288<br />
517<br />
1139<br />
997<br />
330<br />
430<br />
613<br />
808<br />
637<br />
831<br />
164<br />
845<br />
263<br />
183<br />
263<br />
d.<br />
59<br />
Enfield Rd.<br />
25<br />
31<br />
12<br />
37<br />
Conlin Rd.<br />
517<br />
1139<br />
171<br />
233<br />
589 562<br />
218<br />
344<br />
44<br />
24<br />
640<br />
Taunton Rd E<br />
3<br />
360<br />
5<br />
640<br />
380<br />
784<br />
845<br />
942<br />
837<br />
2<br />
1030<br />
481<br />
454<br />
100<br />
190<br />
7<br />
9<br />
48<br />
4<br />
2<br />
2021 PM Peak Hour Auto Link Volume<br />
3<br />
7<br />
644<br />
158<br />
4<br />
6<br />
25<br />
458<br />
8<br />
15<br />
73 14<br />
9<br />
654<br />
527 549<br />
38<br />
18<br />
13<br />
12<br />
16<br />
37<br />
636<br />
173<br />
632<br />
308<br />
9<br />
447<br />
231<br />
387<br />
28<br />
9<br />
9<br />
23<br />
535<br />
455<br />
9<br />
18<br />
1<br />
32<br />
644<br />
160<br />
585<br />
36<br />
237<br />
478<br />
479<br />
12<br />
78<br />
25<br />
16<br />
231<br />
389<br />
17<br />
58<br />
2<br />
635<br />
1346<br />
671<br />
665<br />
1131<br />
1131<br />
2435<br />
2182<br />
No. <strong>of</strong> Lanes - One Way<br />
1 Lane<br />
2 Lanes<br />
3 Lanes<br />
13<br />
37<br />
565<br />
495<br />
387<br />
244<br />
635<br />
270<br />
569<br />
492<br />
620<br />
60<br />
373<br />
1017<br />
814<br />
4<br />
594<br />
517<br />
1139<br />
517<br />
1139<br />
1131<br />
479<br />
635<br />
2182<br />
947<br />
2182<br />
1346<br />
2435<br />
764<br />
505<br />
729<br />
455<br />
589<br />
739<br />
492<br />
640<br />
491<br />
719<br />
974<br />
554<br />
816<br />
469<br />
341<br />
415<br />
57<br />
509<br />
616<br />
432<br />
280<br />
329<br />
101<br />
961<br />
233<br />
111<br />
478<br />
262<br />
702<br />
681<br />
526<br />
806<br />
717<br />
559<br />
967<br />
277<br />
598<br />
452<br />
886<br />
701<br />
240<br />
148<br />
878<br />
933<br />
512<br />
941<br />
997<br />
774<br />
1073<br />
249<br />
83<br />
1266<br />
1223 1182<br />
1204<br />
501<br />
358<br />
825<br />
195<br />
295<br />
933<br />
397<br />
303<br />
917<br />
828<br />
1073<br />
1058<br />
743<br />
853<br />
53<br />
171<br />
227<br />
367<br />
1223<br />
858<br />
832<br />
1416<br />
395<br />
2435<br />
6<br />
541<br />
1346<br />
2435<br />
225<br />
107<br />
213<br />
1008<br />
687<br />
395<br />
ncester Rd<br />
1346<br />
436<br />
714<br />
427 469<br />
418<br />
512<br />
346 341<br />
654<br />
974<br />
262 261<br />
107<br />
886<br />
435<br />
225<br />
163<br />
3<br />
113<br />
149<br />
03<br />
12<br />
85<br />
1242<br />
127<br />
585<br />
1<br />
20<br />
180<br />
221<br />
154<br />
1163<br />
986<br />
1321<br />
0<br />
308<br />
822<br />
320<br />
570<br />
795<br />
123<br />
349<br />
912<br />
506<br />
504490<br />
299<br />
710<br />
677<br />
714<br />
149<br />
1026<br />
903<br />
hickson Rd N<br />
Simcoe St<br />
213<br />
556<br />
584<br />
433<br />
117<br />
981<br />
917<br />
226<br />
53<br />
72<br />
277<br />
461<br />
417<br />
N<br />
ard Rd.<br />
Ritson Rd N<br />
Harmony Rd<br />
3<br />
3<br />
1116<br />
102<br />
913<br />
89<br />
28<br />
924<br />
495<br />
1
12<br />
16<br />
4<br />
2<br />
38<br />
77<br />
7<br />
8<br />
29<br />
84<br />
75<br />
77<br />
202<br />
29<br />
66<br />
Co<br />
43<br />
33<br />
9<br />
10<br />
54<br />
35<br />
23<br />
49<br />
d.<br />
Enfield Rd.<br />
265<br />
179<br />
41<br />
19<br />
132<br />
2<br />
96<br />
351<br />
231<br />
7<br />
2021 PM Peak Hour Auto Volume for Centroid Connectors<br />
Legend<br />
Traffic Zone Boundary<br />
Road Link<br />
Centroid Connector<br />
3<br />
2<br />
7<br />
4<br />
9<br />
10<br />
3<br />
16<br />
12<br />
9<br />
2<br />
1<br />
3<br />
410<br />
159<br />
170<br />
78<br />
4<br />
8<br />
1<br />
1<br />
2<br />
1<br />
Conlin Rd.<br />
222<br />
270<br />
Simcoe St<br />
47<br />
41<br />
106<br />
244<br />
153<br />
241<br />
138<br />
211<br />
38<br />
551<br />
254<br />
32<br />
12<br />
341<br />
244<br />
343<br />
89<br />
66<br />
21<br />
22<br />
14<br />
48<br />
19<br />
9<br />
92<br />
141<br />
16<br />
30<br />
225<br />
77<br />
165<br />
54<br />
104<br />
117<br />
168<br />
15<br />
91<br />
74<br />
17<br />
41<br />
61<br />
13<br />
49<br />
4<br />
5<br />
29<br />
159<br />
4<br />
126<br />
107<br />
1<br />
3<br />
95<br />
3<br />
169<br />
170<br />
96<br />
3<br />
101<br />
6<br />
201<br />
88<br />
16<br />
23<br />
32<br />
60<br />
137<br />
4<br />
9<br />
10<br />
245<br />
325<br />
159<br />
11<br />
92<br />
33<br />
66<br />
104<br />
64<br />
122<br />
208<br />
262<br />
615<br />
61<br />
109<br />
211<br />
264<br />
97<br />
198<br />
9<br />
104<br />
85<br />
35<br />
N<br />
Ritson Rd N<br />
Harmony Rd<br />
Taunton Rd E<br />
160<br />
101<br />
82<br />
23<br />
9<br />
11<br />
15<br />
39<br />
56<br />
40<br />
28<br />
50<br />
6<br />
4<br />
93<br />
48<br />
18<br />
1<br />
64<br />
54<br />
1<br />
1<br />
238<br />
3<br />
1<br />
1<br />
1<br />
1<br />
2<br />
1<br />
5<br />
4<br />
21<br />
51<br />
ard Rd.<br />
676<br />
155<br />
59<br />
4<br />
1<br />
813<br />
424<br />
228<br />
80<br />
104<br />
39<br />
73<br />
5<br />
1<br />
2<br />
5<br />
ncester Rd<br />
83<br />
522<br />
149<br />
181<br />
103<br />
hickson Rd N<br />
117<br />
52<br />
2