Pedestrian safety - Global Road Safety Partnership
Pedestrian safety - Global Road Safety Partnership
Pedestrian safety - Global Road Safety Partnership

You also want an ePaper? Increase the reach of your titles
YUMPU automatically turns print PDFs into web optimized ePapers that Google loves.
<strong>Pedestrian</strong><br />
<strong>safety</strong><br />
A ROAD SAFETY MANUAL<br />
FOR DECISION-MAKERS<br />
AND PRACTITIONERS<br />
good practice
<strong>Pedestrian</strong> <strong>safety</strong><br />
A road <strong>safety</strong> manual<br />
for decision-makers and<br />
practitioners
WHO Library Cataloguing-in-Publication Data<br />
<strong>Pedestrian</strong> <strong>safety</strong>: a road <strong>safety</strong> manual for decision-makers and practitioners.<br />
1.Accidents, Traffic – prevention and control. 2.Automobile driving. 3.Wounds and injuries – prevention<br />
and control. 4.Walking – injuries. 5.<strong>Safety</strong>. 6.Handbook. I.World Health Organization. II.FIA<br />
Foundation for the Automobile and Society. III.<strong>Global</strong> <strong>Road</strong> <strong>Safety</strong> <strong>Partnership</strong>. IV.World Bank.<br />
ISBN 978 92 4 150535 2 (NLM classification: WA 275)<br />
© World Health Organization 2013<br />
All rights reserved. Publications of the World Health Organization are available on the WHO<br />
web site (www.who.int) or can be purchased from WHO Press, World Health Organization,<br />
20 Avenue Appia, 1211 Geneva 27, Switzerland (tel.: +41 22 791 3264; fax: +41 22 791 4857;<br />
e-mail: bookorders@who.int).<br />
Requests for permission to reproduce or translate WHO publications –whether for sale or for<br />
non-commercial distribution– should be addressed to WHO Press through the WHO web site<br />
(www.who.int/about/licensing/copyright_form/en/index.html).<br />
The designations employed and the presentation of the material in this publication do not imply the<br />
expression of any opinion whatsoever on the part of the World Health Organization concerning the<br />
legal status of any country, territory, city or area or of its authorities, or concerning the delimitation of<br />
its frontiers or boundaries. Dotted lines on maps represent approximate border lines for which there<br />
may not yet be full agreement.<br />
The mention of specific companies or of certain manufacturers’ products does not imply that they<br />
are endorsed or recommended by the World Health Organization in preference to others of a similar<br />
nature that are not mentioned. Errors and omissions excepted, the names of proprietary products are<br />
distinguished by initial capital letters.<br />
All reasonable precautions have been taken by the World Health Organization to verify the<br />
information contained in this publication. However, the published material is being distributed<br />
without warranty of any kind, either expressed or implied. The responsibility for the interpretation<br />
and use of the material lies with the reader. In no event shall the World Health Organization be liable<br />
for damages arising from its use.<br />
Printed in Italy<br />
Design and editing by Inís Communication – www.iniscommunication.com
<strong>Pedestrian</strong> <strong>safety</strong>: a road <strong>safety</strong> manual for decision-makers and practitioners<br />
Table of contents<br />
Preface ...................................................... vii<br />
Contributors and acknowledgements ...............................viii<br />
Executive summary ............................................. ix<br />
Introduction .................................................. xi<br />
Implementation of good practices in road <strong>safety</strong> .........................xiii<br />
<strong>Pedestrian</strong> <strong>safety</strong> manual. ......................................... xiv<br />
References .................................................... xvi<br />
1 Why is addressing pedestrian <strong>safety</strong> necessary? ....................1<br />
1.1 Guiding principles. ............................................4<br />
1.1.1 The importance of safe walking ..............................4<br />
1.1.2 The Safe System approach and pedestrian <strong>safety</strong> .................5<br />
1.2 Magnitude of the pedestrian injury problem ..........................9<br />
1.2.1 <strong>Pedestrian</strong>s killed in road traffic crashes. .......................9<br />
1.2.2 The cost of pedestrian fatalities and injuries ....................12<br />
1.2.3 Who are killed and injured as pedestrians?. ....................13<br />
1.2.4 Where do pedestrian collisions occur? ........................14<br />
1.2.5 When do pedestrian collisions occur?. ........................15<br />
1.3 What happens in a pedestrian collision? ...........................15<br />
1.4 Risk factors for pedestrian traffic injury ............................17<br />
1.4.1 Speed ...............................................17<br />
1.4.2 Alcohol ..............................................19<br />
1.4.3 Lack of pedestrian facilities in roadway design and land-use planning ..20<br />
1.4.4 Inadequate visibility of pedestrians ..........................20<br />
1.4.5 Other risk factors .......................................20<br />
1.5 Summary. .................................................21<br />
References ....................................................22<br />
2 <strong>Pedestrian</strong> <strong>safety</strong> in roadway design and land-use planning ...........25<br />
2.1 How roadway design contributes to pedestrian injury ...................27<br />
iii
Table of contents<br />
2.1.1 Traffic mix ............................................29<br />
2.1.2 The width of roads and lanes, and road design speed .............31<br />
2.1.3 <strong>Pedestrian</strong> crossings. ....................................32<br />
2.1.4 High traffic volume roads. .................................33<br />
2.1.5 Perception of <strong>safety</strong> and security of the travel environment. .........34<br />
2.2 How land-use planning factors affect pedestrian <strong>safety</strong> .................34<br />
2.3 Policy and planning reforms that support pedestrian <strong>safety</strong> ..............35<br />
2.4 Summary. .................................................37<br />
References ....................................................38<br />
3 Prioritizing pedestrian <strong>safety</strong> interventions and preparing a plan of action. 41<br />
3.1 Why assess the pedestrian <strong>safety</strong> situation? ........................43<br />
3.2 How to assess the pedestrian <strong>safety</strong> situation .......................44<br />
3.2.1 Assessing the magnitude, trends and patterns of pedestrian<br />
fatalities and injuries ....................................44<br />
3.2.2 Assessing risk factors for pedestrian injury. ....................48<br />
3.2.3 Assessing the policy environment and existing initiatives on<br />
pedestrian <strong>safety</strong> .......................................51<br />
3.3 Preparing a pedestrian <strong>safety</strong> action plan ...........................53<br />
3.3.1 Mobilizing stakeholders. ..................................54<br />
3.3.2 Core components of an action plan ..........................56<br />
3.4 Summary. .................................................58<br />
References ....................................................59<br />
4 Implementing pedestrian <strong>safety</strong> interventions .....................61<br />
4.1 An overview of effective pedestrian <strong>safety</strong> interventions ................ 63<br />
4.2 Implementing pedestrian <strong>safety</strong> interventions. .......................70<br />
4.2.1 Reducing pedestrian exposure to vehicular traffic ................70<br />
4.2.2 Reducing vehicle speeds ..................................75<br />
4.2.3 Improving the visibility of pedestrians .........................78<br />
4.2.4 Improving pedestrian and motorist <strong>safety</strong> awareness and behaviour ...79<br />
4.2.5 Improving vehicle design for pedestrian protection. ...............83<br />
4.2.6 Providing care for injured pedestrians .........................85<br />
4.3 Summary. .................................................90<br />
References ....................................................90<br />
iv
<strong>Pedestrian</strong> <strong>safety</strong>: a road <strong>safety</strong> manual for decision-makers and practitioners<br />
5 Evaluating pedestrian <strong>safety</strong> programmes ........................95<br />
5.1 Evaluating pedestrian <strong>safety</strong> interventions ..........................97<br />
5.2 Advocating for pedestrian <strong>safety</strong> ................................102<br />
5.3 Summary. ................................................105<br />
References ...................................................105<br />
Appendices. .................................................107<br />
Appendix 1: A comprehensive framework for safe walking: strategic principles ...109<br />
Appendix 2: Traffic-calming measures ................................111<br />
v
vi<br />
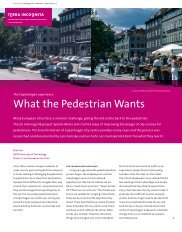
Preface
<strong>Pedestrian</strong> <strong>safety</strong>: a road <strong>safety</strong> manual for decision-makers and practitioners<br />
Preface<br />
Each year, more than 270 000 pedestrians lose their lives on the world’s roads.<br />
Many leave their homes as they would on any given day – to school, work, places of<br />
worship, homes of friends – never to return. <strong>Global</strong>ly, pedestrians constitute 22%<br />
of all road deaths, and in some countries this proportion is as high as two thirds.<br />
Millions more people are injured in traffic-related crashes while walking, some of<br />
whom become permanently disabled. These incidents cause much suffering and grief<br />
as well as economic hardship for families and loved ones.<br />
The capacity to respond to pedestrian <strong>safety</strong> is an important component of efforts<br />
to prevent road traffic injuries. <strong>Pedestrian</strong> collisions, like other road traffic crashes,<br />
should not be accepted as inevitable because they are, in fact, both predictable and<br />
preventable. The key risks to pedestrians are well documented, and they include issues<br />
related to a broad range of factors: driver behaviour, particularly in relation to speeding<br />
as well as drinking and driving; infrastructure in terms of a lack of dedicated facilities<br />
for pedestrians such as sidewalks, crossings and raised medians; and vehicle design in<br />
terms of solid vehicle fronts that are not forgiving to pedestrians should they be struck.<br />
Poor trauma care services in many settings also thwart efforts to provide the urgent<br />
treatment needed to save pedestrian lives in the event of a collision.<br />
<strong>Pedestrian</strong> <strong>safety</strong>: a road <strong>safety</strong> manual for decision-makers and practitioners describes:<br />
the magnitude of pedestrian deaths and injuries; key risk factors; ways of assessing<br />
the pedestrian <strong>safety</strong> situation in a given setting and prepare an action plan; and how<br />
to select, design, implement and evaluate effective interventions. The manual stresses<br />
the importance of a comprehensive, holistic approach that includes engineering,<br />
legislation and enforcement as well as behavioural measures. It also draws attention<br />
to the benefits of walking, which should be promoted as an important mode of<br />
transport given its potential to improve health and preserve the environment.<br />
We hope that this manual, which is designed for a multidisciplinary audience<br />
including engineers, planners, police, public health professionals and educators,<br />
will contribute towards strengthening national and local capacity to implement<br />
pedestrian <strong>safety</strong> measures in settings worldwide. We encourage all to bring this<br />
manual to the attention of those who will use it to save pedestrian lives.<br />
Etienne Krug<br />
Director<br />
Department of Violence and Injury<br />
Prevention and Disability<br />
World Health Organization<br />
Pieter Venter<br />
Chief Executive<br />
<strong>Global</strong> <strong>Road</strong> <strong>Safety</strong> <strong>Partnership</strong><br />
David Ward<br />
Director General<br />
FIA Foundation for the Automobile<br />
and Society<br />
Jose Luis Irigoyen<br />
Director<br />
Transport, Water, Information and<br />
Communication Technologies Department<br />
The World Bank<br />
vii
Preface<br />
Contributors and acknowledgements<br />
The World Health Organization (WHO) coordinated the preparation of this<br />
manual and acknowledges, with thanks, all those who contributed to its preparation<br />
over the last three years. Particular thanks are due to the following people, who<br />
helped to bring the document to fruition:<br />
Advisory committee<br />
Etienne Krug, Jose Luis Irigoyen, Pieter Venter, David Ward.<br />
Project coordinator<br />
Meleckidzedeck Khayesi.<br />
Principal writers<br />
Kidist Bartolomeos, Peter Croft, Soames Job, Meleckidzedeck Khayesi, Olive<br />
Kobusingye, Margie Peden, David Schwebel, David Sleet, Geetam Tiwari, Blair<br />
Turner, Geert van Waeg.<br />
Additional contributors<br />
Rudayna Abdo, Claudia Adriazola-Steil, Daniel Alba, Timothy Armstrong, Mark<br />
Connors, Ann Marie Doherty, Nicolae Duduta, Eeuwe Engelsman, Reid Ewing,<br />
Elaine Fletcher, Andrea Garfinkel-Castro, Romy Granek, Michael Green, Jeff<br />
Gulden, Jinhong Guo, Mike Kirby, Kacem Iaych, Manjul Joshipura, Heloisa Martins,<br />
Heiner Monheim, Luiz Montans, Martin Mwangi, Zia Saleh, Rob Methorst, Karen<br />
Lee, Rahul Jobanputra, Roberto Pavarino, Jacqueline Pieters, Vladimir Poznyak,<br />
Marco Priego, Dag Rekve, Matthew Roe, Jaime Royals, Wilson Odero, Nancy<br />
Schneider, Tom Shakespeare, Laura Sminkey, Greg Smith, Philip Stoker, Claes<br />
Tingvall, Tami Toroyan, Ellen Vanderslice, Marianne Vanderschuren, Jelica Vesic,<br />
Hans-Joachim Vollpracht, Godfrey Xuereb.<br />
Peer reviewers<br />
Matts-Ake Belin, Casto Benitez, Gayle Di Pietro, Martha Híjar, Jack McLean,<br />
Susanne Lindahl, Todd Litman, Asteria Mlambo, Kristie Johnson, Eugenia<br />
Rodrigues, Laura Sandt, Bronwen Thornton, Andrés Villaveces, Maria-Teresa<br />
Villegas, Maria Vegega, John Whitelegg, Jim Walker, Charles Zegeer.<br />
Editing<br />
Tim France (stylistic) and Alison Harvey (technical).<br />
Production team<br />
Pascale Broisin (assistance with printing), Inis Communication (design, layout,<br />
editing), Pascale Lanvers-Casasola (administrative support), Frederique Robin<br />
(assistance with printing).<br />
Financial support<br />
WHO gratefully acknowledges the financial support received from Bloomberg<br />
Philanthropies and the United States National Highway Traffic <strong>Safety</strong><br />
Administration, which made possible the production of this manual.<br />
viii
<strong>Pedestrian</strong> <strong>safety</strong>: a road <strong>safety</strong> manual for decision-makers and practitioners<br />
Executive summary<br />
<strong>Road</strong> traffic crashes kill about 1.24 million people each year. More than one fifth<br />
of these deaths occur among pedestrians. <strong>Pedestrian</strong> collisions, like all road<br />
traffic crashes, should not be accepted as inevitable because they are, in fact, both<br />
predictable and preventable. Key risk factors for pedestrian road traffic injury are<br />
vehicle speed, alcohol use by drivers and pedestrians, lack of safe infrastructure for<br />
pedestrians and inadequate visibility of pedestrians. Reduction or elimination of<br />
the risks faced by pedestrians is an important and achievable policy goal. Proven<br />
interventions exist, yet in many locations pedestrian <strong>safety</strong> does not attract the<br />
attention it merits.<br />
This manual provides information for use in developing and implementing<br />
comprehensive measures to improve pedestrian <strong>safety</strong>. The extent of pedestrian<br />
fatalities and injuries, and the importance of addressing the key associated risk factors<br />
for pedestrian injury, are examined. The steps outlined for conducting a situational<br />
assessment to help with prioritizing interventions and preparing a related plan of<br />
action, are intended to assist with the implementation of effective interventions, and<br />
evaluation of pedestrian <strong>safety</strong> measures. While the focus of the manual is on subnational<br />
administrative units, the strategies presented can be applied at the national<br />
level. It is hoped that the modular structure of this manual enables adoption to suit<br />
the needs and problems of individual countries. The manual is applicable worldwide<br />
but specifically targets decision-makers and practitioners in low- and middleincome<br />
countries.<br />
ix
x<br />
Executive summary
i<br />
Introduction
<strong>Pedestrian</strong> <strong>safety</strong>: a road <strong>safety</strong> manual for decision-makers and practitioners<br />
Introduction<br />
Introduction<br />
Implementation of good practices in road <strong>safety</strong><br />
The World Health Organization (WHO), the World Bank, the FIA Foundation for<br />
the Automobile and Society and the <strong>Global</strong> <strong>Road</strong> <strong>Safety</strong> <strong>Partnership</strong> (GRSP) have<br />
been collaborating on a project over the past six years to produce a series of good<br />
practice manuals covering key issues identified in the World report on road traffic<br />
injury prevention (1). The project arose out of the numerous requests made to WHO<br />
and the World Bank by road <strong>safety</strong> practitioners around the world, especially those<br />
working in low- and middle-income countries, asking for information to assist with<br />
implementing the report’s six recommendations.<br />
Recommendations of the World report on road traffic injury prevention<br />
1. Identify a lead agency in government to guide the national road traffic <strong>safety</strong> effort.<br />
2. Assess the problem, policies, institutional settings and capacity relating to road<br />
traffic injury.<br />
3. Prepare a national road <strong>safety</strong> strategy and plan of action.<br />
4. Allocate financial and human resources to address the problem.<br />
5. Implement specific actions to prevent road traffic crashes, minimize injuries and<br />
their consequences, and evaluate the impact of these actions.<br />
6. Support the development of national capacity and international cooperation.<br />
This collaboration has so far produced good practice manuals on helmets, seat-belts<br />
and child restraints, speed, drinking and driving, and data systems. These manuals<br />
are available on the website of the United Nations <strong>Road</strong> <strong>Safety</strong> Collaboration<br />
(UNRSC). 1 In addition to specific risk factors that have formed the content of the<br />
manuals so far, research shows the need to address several risk factors facing specific<br />
road users, such as pedestrians. The current manual is a response to this need, which<br />
exists in many countries around the world.<br />
1<br />
United Nations <strong>Road</strong> <strong>Safety</strong> Collaboration: http://www.who.int/road<strong>safety</strong><br />
xiii
Introduction<br />
<strong>Pedestrian</strong> <strong>safety</strong> manual<br />
Why was the manual developed?<br />
Studies show a disproportionate involvement of pedestrians, cyclists and motorized<br />
two-wheelers in road traffic injuries. For instance, the first <strong>Global</strong> status report on<br />
road <strong>safety</strong> revealed that nearly half (46%) of those killed in road traffic crashes<br />
are pedestrians, cyclists or users of motorized two wheelers (2). More recently, the<br />
second <strong>Global</strong> status report on road <strong>safety</strong> 2013: supporting a decade of action examined<br />
pedestrians independently from other vulnerable road users, and showed that 22%<br />
of those killed on the world’s roads are pedestrians (3). As shown in both the <strong>Global</strong><br />
status report on road <strong>safety</strong> (2,3) and World report on road traffic injury prevention (1),<br />
there are regional and national differences in the distribution of road-user mortality.<br />
Countries must address the problem of pedestrian <strong>safety</strong> by implementing effective<br />
measures. There are several recommendations that call on governments to take into<br />
consideration the needs of all road users, including pedestrians and cyclists, when<br />
making decisions about road design and infrastructure, land-use planning and<br />
transport services (3). This manual supports countries in achieving this objective with<br />
a specific focus on pedestrians.<br />
Who is the manual for?<br />
This manual will benefit a variety of users, but the primary target audiences are<br />
engineers, planners, enforcement professionals, public health professionals and<br />
educators and other such people who have responsibility to improve pedestrian<br />
<strong>safety</strong> at the local and sub-national levels. Though the application of this manual<br />
can be at the national level, the settings envisaged are sub-national geographical<br />
and administrative units such as provinces or states, districts, cities, towns,<br />
neighbourhoods and communities. A secondary target audience are decision-makers<br />
and leaders in government and nongovernmental organizations, who provide overall<br />
policy support on road <strong>safety</strong>, transport and land-use planning.<br />
What does the manual cover?<br />
The manual provides information to use in designing and implementing<br />
interventions that can improve pedestrian <strong>safety</strong> in local and sub-national settings<br />
around the world. A summary of the content of each module is presented below:<br />
Module 1 stresses the need to promote pedestrian <strong>safety</strong> in transport planning and<br />
presents data on the magnitude of pedestrian fatalities and risk factors.<br />
Module 2 examines the extent of pedestrian consideration and inclusion in land-use,<br />
transport and public space planning.<br />
Module 3 outlines steps for prioritizing interventions and preparing a pedestrian<br />
<strong>safety</strong> plan of action.<br />
xiv
<strong>Pedestrian</strong> <strong>safety</strong>: a road <strong>safety</strong> manual for decision-makers and practitioners<br />
Introduction<br />
Module 4 presents key principles and examples of interventions related to roads,<br />
vehicles and users from around the world.<br />
Module 5 presents key principles for evaluating pedestrian <strong>safety</strong> interventions and<br />
advocating for pedestrian <strong>safety</strong>.<br />
Case studies from a range of countries and settings are included throughout<br />
the modules.<br />
How should the manual be used?<br />
This manual provides information and examples to meet pedestrian <strong>safety</strong> planning<br />
needs in different local settings. Users are expected to be creative and innovative in<br />
adapting the content to the needs of particular situations. Each module contains<br />
tools, research findings and references to help readers determine the current status<br />
of pedestrian <strong>safety</strong> issues in their settings, to prioritize the best options for action<br />
to improve pedestrian <strong>safety</strong>, and to take steps that offer the greatest potential<br />
for improvement.<br />
Individual sections of the manual may be more relevant to some settings than others,<br />
but users are advised to read the entire manual. It may be especially appropriate for<br />
all users to look at Module 3, which guides users on assessing the pedestrian <strong>safety</strong><br />
situation, and then proceed to select particular actions to undertake as indicated in<br />
other modules. While the importance of adapting the content to local situations –<br />
and choosing the appropriate level to begin at – cannot be overstated, users who<br />
oversee the local adaptation of the content must also ensure that the fundamental<br />
principles are not radically changed or misrepresented.<br />
What are the limitations of this manual?<br />
This manual provides key information and examples of measures that can be<br />
implemented to improve pedestrian <strong>safety</strong> around the world. The manual does not<br />
provide an exhaustive ‘state-of-the-art’ review and case studies on pedestrian <strong>safety</strong>.<br />
The references and case studies offered are designed to provide key information that<br />
illustrates the issues being considered. There are several comprehensive reviews of the<br />
literature and case studies on pedestrian <strong>safety</strong> that the reader who wishes to know<br />
more may consult. Some of these reviews and studies are indicated in the reference<br />
lists in the modules.<br />
While every attempt has been made to draw on experiences and lessons learned from<br />
countries implementing pedestrian <strong>safety</strong> programmes, there might be a need for<br />
readers to consult national or sub-national guidelines to ensure that decisions made<br />
take into account and are consistent with the local context.<br />
xv
Introduction<br />
How was the manual developed?<br />
This manual is a result of three years of work by experts from public health, transport,<br />
psychology, planning and implementation, coordinated by WHO. An outline of the<br />
content of the manual, based on a standard format developed for the good practice<br />
manuals, was produced by a team of writers. A literature review was conducted to<br />
gather evidence and examples for preparing the manual. Two international experts<br />
conducted the review by assembling published and grey literature, extracting the<br />
information and preparing a literature review summary. The summary was used to<br />
provide information for different sections of the manual as well as categorize the<br />
examples of good practice provided in Module 4 into proven, promising or those<br />
with insufficient evidence at this time. Randomized controlled trials and case–<br />
control studies were used as the gold standard. A team of experts prepared a draft<br />
of the manual, which was reviewed by experts from health, transport, planning and<br />
implementation backgrounds. The review comments were used to revise the manual.<br />
An advisory committee of experts from the various partner organizations oversaw<br />
the process of further developing the manual, as has been the case with the other<br />
good practice manuals on helmets, speed, drinking and driving, seat-belts and child<br />
restraints, and data systems.<br />
Dissemination of the manual<br />
The manual will be translated into various major languages, and countries are<br />
encouraged to translate the document into local languages. The manual will be<br />
disseminated widely through the distribution channels of all four organizations<br />
involved in the series.<br />
The manual is also available for downloading in PDF format from the websites of all<br />
four partner organizations. This manual is downloadable from http://www.who.int/<br />
road<strong>safety</strong>, for example.<br />
How to obtain more printed copies<br />
Further copies can be requested by e-mailing traffic@who.int, or by writing to:<br />
Department of Violence and Injury Prevention and Disability<br />
World Health Organization<br />
20, Appia Avenue, CH-1211<br />
Geneva 27, Switzerland<br />
References<br />
1. Peden M et al., eds. World report on road traffic injury prevention. Geneva, World Health Organization, 2004.<br />
2. <strong>Global</strong> status report on road <strong>safety</strong>: time for action. Geneva, World Health Organization, 2009.<br />
3. <strong>Global</strong> status report on road <strong>safety</strong> 2013: supporting a decade of action. Geneva, World Health Organization, 2013.<br />
xvi
1<br />
Why is addressing pedestrian<br />
<strong>safety</strong> necessary?
1<br />
1.1 Guiding principles. ....................................... 4<br />
Why is addressing pedestrian<br />
<strong>safety</strong> necessary?<br />
1.1.1 The importance of safe walking. ............................. 4<br />
1.1.2 The Safe System approach and pedestrian <strong>safety</strong>................. 5<br />
1.2 Magnitude of the pedestrian injury problem................ 9<br />
1.2.1 <strong>Pedestrian</strong>s killed in road traffic crashes........................ 9<br />
1.2.2 The cost of pedestrian fatalities and injuries.................... 12<br />
1.2.3 Who are killed and injured as pedestrians? .................... 13<br />
1.2.4 Where do pedestrian collisions occur?. ....................... 14<br />
1.2.5 When do pedestrian collisions occur?......................... 15<br />
1.3 What happens in a pedestrian collision?................... 15<br />
1.4 Risk factors for pedestrian traffic injury................... 17<br />
1.4.1 Speed................................................. 17<br />
1.4.2 Alcohol................................................ 19<br />
1.4.3 Lack of pedestrian facilities in roadway design and land-use planning. 20<br />
1.4.4 Inadequate visibility of pedestrians .......................... 20<br />
1.4.5 Other risk factors ........................................ 20<br />
1.5 Summary. .............................................. 21<br />
References ................................................. 22
<strong>Pedestrian</strong> <strong>safety</strong>: a road <strong>safety</strong> manual for decision-makers and practitioners<br />
More than one fifth of the people killed on the world’s roads each year are not<br />
travelling in a car, on a motorcycle or even on a bicycle – they are pedestrians.<br />
<strong>Pedestrian</strong> deaths and injuries are often preventable, and proven interventions exist,<br />
yet in many locations pedestrian <strong>safety</strong> does not attract the attention it merits.<br />
Successful interventions to protect pedestrians and promote safe walking require<br />
an understanding of the nature of risk factors for pedestrian crashes. This module<br />
provides the reader with background information on the problem of pedestrian<br />
injuries and risk factors worldwide. The information may be used to persuade<br />
political leaders to develop, implement and support pedestrian <strong>safety</strong> measures.<br />
A pedestrian is any person who is travelling by walking for at least part of<br />
his or her journey. In addition to the ordinary form of walking, a pedestrian<br />
may be using various modifications and aids to walking such as wheelchairs,<br />
motorized scooters, walkers, canes, skateboards, and roller blades. The<br />
person may carry items of varying quantities, held in hands, strapped on the<br />
back, placed on the head, balanced on shoulders, or pushed/pulled along. A<br />
person is also considered a pedestrian when running, jogging, hiking, or when<br />
sitting or lying down in the roadway.<br />
1: Why is addressing pedestrian <strong>safety</strong> necessary?<br />
The content of this module is organized as follows:<br />
1.1 Guiding principles: Two of the principles that guide work on pedestrian<br />
<strong>safety</strong> and shape this manual are presented. The first is the concept of ‘safe walking’.<br />
Walking is a basic and common mode of transport with benefits to health and the<br />
environment. Measures must be taken to improve the <strong>safety</strong> of walkers. The second<br />
guiding principle is the ‘Safe System’ approach, discussed here as a framework for<br />
understanding and addressing pedestrian <strong>safety</strong>.<br />
1.2 Magnitude of pedestrian road injury problem: This section presents data on<br />
the number of pedestrians killed in road traffic crashes worldwide. It also presents<br />
information on the demographic and socioeconomic characteristics of people who<br />
are injured or killed as pedestrians, and the costs of pedestrian road traffic crashes.<br />
1.3 What happens in a pedestrian collision? This section briefly describes the<br />
sequence of events and typical injuries arising from pedestrian–car collisions. It provides<br />
a useful background for understanding the risk factors discussed in Section 1.4.<br />
1.4 Risk factors: This section discusses the key risk factors for pedestrian injury,<br />
particularly speed, alcohol, lack of road infrastructure for pedestrians and inadequate<br />
visibility of pedestrians on roads. Other risk factors are also outlined.<br />
3
Why is addressing pedestrian <strong>safety</strong> necessary?<br />
1.1 Guiding principles<br />
1.1.1 The importance of safe walking<br />
We are all pedestrians. Walking is a basic and common mode of transport in all<br />
societies around the world. Virtually every trip begins and ends with walking.<br />
Walking comprises the sole means of travel on some journeys, whether a long trip or<br />
a short stroll to a shop. In other journeys, a person may walk for one or more portion<br />
of the trip, for example, walking to and from bus stops, with a bus trip in between.<br />
Walking has well established health and environmental benefits such as increasing<br />
physical activity that may lead to reduced cardiovascular and obesity-related diseases,<br />
and many countries have begun to implement policies to encourage walking as an<br />
important mode of transport (1–3). Unfortunately, in some situations increased<br />
walking can lead to increased risk of road traffic crashes and injury. Due to the<br />
dramatic growth in the number of motor vehicles and the frequency of their use<br />
around the world – as well as the general neglect of pedestrian needs in roadway<br />
design and land-use planning – pedestrians are increasingly susceptible to road traffic<br />
injury (4). <strong>Pedestrian</strong> vulnerability is further heightened in settings where traffic laws<br />
are inadequately enforced (5).<br />
© David Schwebel<br />
4
<strong>Pedestrian</strong> <strong>safety</strong>: a road <strong>safety</strong> manual for decision-makers and practitioners<br />
A road traffic crash is a collision or incident involving at least one road<br />
vehicle in motion, on a public road or private road to which the public has<br />
right of access, resulting in at least one injured or killed person. Included are:<br />
collisions between road vehicles; between road vehicles and pedestrians;<br />
between road vehicles and animals or fixed obstacles or with one road vehicle<br />
alone. Included are collisions between road and rail vehicles (6).<br />
Reduction or elimination of the risks faced by pedestrians is an important and<br />
achievable policy goal. <strong>Pedestrian</strong> collisions, like other road traffic crashes, should<br />
not be accepted as inevitable because they are, in fact, both predictable and<br />
preventable (7). There is a close association between the walking environment<br />
and pedestrian <strong>safety</strong>. Walking in an environment that lacks pedestrian<br />
infrastructure and that permits use of high-speed vehicles increases the risk of<br />
pedestrian injury. The risk of a motor vehicle colliding with a pedestrian increases<br />
in proportion to the number of motor vehicles interacting with pedestrians (8,9).<br />
1: Why is addressing pedestrian <strong>safety</strong> necessary?<br />
<strong>Pedestrian</strong> <strong>safety</strong> measures improve walking environments and contribute to<br />
urban renewal, local economic growth, social cohesion, improved air quality<br />
and reduction in the harmful effects of traffic noise (10–13). They also have<br />
supplementary benefits for other road users, such as motorists and cyclists.<br />
Implementation of <strong>safety</strong> measures requires commitment and informed<br />
decision-making by government, industry, nongovernmental organizations and<br />
international organizations. Effective measures to improve pedestrian traffic<br />
<strong>safety</strong> are described in Module 4.<br />
1.1.2 The Safe System approach and pedestrian <strong>safety</strong><br />
Conventional analysis of road traffic injury risk has considered road users,<br />
vehicles and the road environment separately (14). There is also a tendency<br />
among researchers and practitioners to focus on one or few factors, when<br />
in reality several interacting factors typically define any specific road traffic<br />
context (14,15). This uneven focus can limit the effectiveness of road traffic<br />
injury prevention efforts and may lead to an emphasis on interventions that leave<br />
pedestrians at risk.<br />
The Safe System approach (see Figure 1.1) addresses risk factors and interventions<br />
related to road users, vehicles and the road environment in an integrated manner,<br />
allowing for more effective prevention measures (16, 17). This approach has been<br />
shown to be appropriate and effective in several settings around the world, in<br />
some cases facilitating road <strong>safety</strong> gains where further progress had proved to be a<br />
challenge (18).<br />
5
Why is addressing pedestrian <strong>safety</strong> necessary?<br />
Figure 1.1 Safe system approach<br />
Admittance<br />
to system<br />
Safer travel<br />
Understanding<br />
crashes and risks<br />
Alert and compliant road users<br />
Safer speeds<br />
(lower speeds more<br />
forgiving of human error)<br />
Human<br />
tolerance<br />
Safer<br />
vehicles<br />
Safer roads<br />
and roadsides<br />
(more forgiving<br />
of human error)<br />
Education and<br />
information<br />
supporting<br />
road users<br />
Enforcement<br />
of road rules<br />
Source: 16<br />
The Safe System approach to road <strong>safety</strong> recognizes that transport is important to<br />
society, and advances the view that travel should be safe for all road users as they<br />
interact with roads and vehicles to facilitate movement. The aim of the Safe System<br />
approach is the elimination of fatal crashes and reduction of serious injuries through<br />
provision of a safe transport system that is forgiving of human error and takes into<br />
account people’s vulnerability to serious injury. This is done through a policy focus<br />
on road infrastructure, vehicles and travel speeds, supported by a range of activities in<br />
education, behaviour change, regulation, enforcement and penalties.<br />
The key principles of the Safe System approach are summarized as follows (16):<br />
• Recognition of human error in the transport system: People will make mistakes in<br />
traffic that can easily lead to injuries and death. The Safe System approach does not<br />
ignore road user behaviour interventions but emphasizes that behaviour is just one<br />
of many necessary elements to promote <strong>safety</strong> on the road.<br />
• Recognition of human physical vulnerability and limits: People have a limited<br />
tolerance to violent force, beyond which serious injury or death occurs.<br />
• Promotion of system accountability: Responsibility for traffic <strong>safety</strong> must be shared<br />
between road users and system designers. While road users are expected to comply<br />
6
<strong>Pedestrian</strong> <strong>safety</strong>: a road <strong>safety</strong> manual for decision-makers and practitioners<br />
with traffic regulations, system designers and operators have a responsibility to<br />
develop a transport system that is as safe as possible for users.<br />
• Promotion of ethical values in road <strong>safety</strong>: The ethical value underlying the Safe<br />
System approach is that any level of serious trauma arising from the road transport<br />
system is unacceptable. Humans can learn to behave more safely, but errors will<br />
inevitably occur on some occasions. The errors may lead to crashes, but death and<br />
serious injury are not inevitable consequences.<br />
• Promotion of societal values: In addition to ensuring <strong>safety</strong>, the road transport<br />
system is expected to contribute to overall societal values, particularly in three<br />
areas – economic development, human and environmental health, and individual<br />
choice.<br />
The Safe System approach has several benefits as a framework for pedestrian <strong>safety</strong>:<br />
• Examination of a range of risk factors. <strong>Pedestrian</strong> <strong>safety</strong> should be researched<br />
from a systems point of view to allow for consideration of the many factors that<br />
expose pedestrians to risk, such as vehicle speed, poor road design, and inadequate<br />
enforcement of traffic laws and regulations. Effective planning for pedestrian <strong>safety</strong><br />
requires a comprehensive understanding of the risk factors involved. It is difficult<br />
to achieve this understanding, however, when research focuses only on one or<br />
two risk factors. The Safe Systems framework moves pedestrian <strong>safety</strong> research<br />
away from a narrow focus on a single or a few risk factors. Module 3 describes the<br />
development of data sources in Addis Ababa, Ethiopia, which together provide a<br />
thorough picture of the extent of injuries and risk factors for pedestrians and other<br />
road users.<br />
• Integration of comprehensive interventions. Improving pedestrian <strong>safety</strong> requires<br />
attention to vehicle design, road infrastructure, traffic controls such as speed<br />
limits, and enforcement of traffic laws and regulations – the focus areas that<br />
comprise the Safe System approach. A narrow focus on any single aspect is less<br />
effective than taking an integrated approach to the multiple factors involved in<br />
pedestrian <strong>safety</strong>.<br />
• Assimilation of lessons learned. The Safe System approach provides a basis for<br />
low- and middle-income countries to avoid mistakes that were made by a number<br />
of high-income countries that designed roads mainly with motor vehicles in<br />
mind, and without adequate attention to pedestrian needs. As countries witness<br />
increasing numbers of motor vehicles, improvements are needed to infrastructure<br />
for pedestrians as well as for vehicles, rather than focusing solely on pedestrian<br />
behaviour as the key factor influencing pedestrian <strong>safety</strong>. A common feature of<br />
pedestrian travel environments in low- and middle-income countries is mixed<br />
traffic where pedestrians, vehicles and bicycles share the same road space, with<br />
few or no dedicated infrastructural facilities for pedestrians. Some progress in<br />
addressing the neglect of pedestrians in road design has been observed in China<br />
and India (4). Modules 2 and 4 provide examples of road design measures aimed<br />
at improving pedestrian <strong>safety</strong> in low- and middle-income countries.<br />
1: Why is addressing pedestrian <strong>safety</strong> necessary?<br />
7
Why is addressing pedestrian <strong>safety</strong> necessary?<br />
• Collaboration with partners. <strong>Pedestrian</strong> <strong>safety</strong> is a multi-dimensional problem<br />
that requires a comprehensive view when examining determinants, consequences<br />
and solutions. While different agencies may have responsibility for specific<br />
aspects of pedestrian <strong>safety</strong>, the reality is that a coordinated approach – involving<br />
collaboration among policy-makers, decision-makers, researchers, political leaders,<br />
civil society and the public – is required in order to improve pedestrian <strong>safety</strong>,<br />
especially in low- and middle-income countries. Collaboration may take many<br />
forms, one of them being sharing responsibilities or activities in a pedestrian <strong>safety</strong><br />
programme (see Box 1.1). Collaboration among various agencies and sectors is a<br />
cornerstone of the Safe System approach.<br />
BOX 1.1: Sharing responsibilities in a pedestrian <strong>safety</strong> programme in<br />
São Paulo<br />
In 2010, Companhia de Engenharia de Tráfego (CET), the agency responsible for managing transport in the Brazillian<br />
city of São Paulo, launched a pedestrian <strong>safety</strong> programme aimed at reducing the number of pedestrians<br />
killed by 50% by the end of 2012. Interventions included media campaigns and awareness raising, engineering<br />
measures and traffic law enforcement. To coordinate implementation, various agencies were brought together<br />
and assigned responsibility for specific activities: The City Transportation Secretariat coordinated the overall<br />
implementation of the programme; CET was responsible for engineering, education and enforcement measures;<br />
the Municipal Government of São Paulo, through the Department of Communication, was responsible<br />
for media campaigns; the Labour Secretariat was in charge of supervisors at pedestrian crossings; the traffic<br />
police was responsible for law enforcement; and São Paulo Transporte (SPTrans) – the company that manages<br />
bus transportation – was responsible for supervising and training bus drivers.<br />
© Marcelo Fortin<br />
8
<strong>Pedestrian</strong> <strong>safety</strong>: a road <strong>safety</strong> manual for decision-makers and practitioners<br />
1.2 Magnitude of the pedestrian injury problem<br />
This section describes the global magnitude of the pedestrian injury problem,<br />
including the proportion of pedestrian fatalities in relation to other road users, the<br />
demographic and socioeconomic characteristics of people who are killed or injured<br />
as pedestrians, and the places and times that pedestrian collisions occur.<br />
1.2.1 <strong>Pedestrian</strong>s killed in road traffic crashes<br />
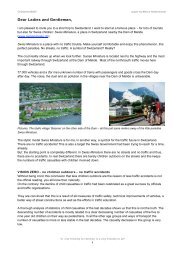
Based on estimated global road traffic fatalities, about 273 000 pedestrians were<br />
killed in road traffic crashes in 2010 (19). This represents around 22% of all road<br />
traffic deaths (see Figure 1.2 and Table 1.1). There is a clear geographic distribution of<br />
pedestrian mortality, with the proportion of pedestrians killed in relation to other<br />
road users being highest in the African Region (38%) and lowest in the South-East<br />
Asia Region (12%).<br />
1: Why is addressing pedestrian <strong>safety</strong> necessary?<br />
Figure 1.2 Distribution of road traffic deaths by type of road user, global, 2010<br />
Car occupants<br />
31% Motorized<br />
2–3 wheelers<br />
23%<br />
Cyclists<br />
5%<br />
Others/<br />
unspecified<br />
19%<br />
<strong>Pedestrian</strong>s<br />
22%<br />
Source: 19<br />
9
Why is addressing pedestrian <strong>safety</strong> necessary?<br />
In many countries, crashes involving pedestrians are poorly reported in<br />
official road traffic injury statistics. The actual number of pedestrian fatalities<br />
and injuries is probably higher than what the official statistics show. <strong>Global</strong><br />
data on injured pedestrians are not readily available. For this reason, this section<br />
presents only data on pedestrian fatalities. It should be noted that the<br />
data on pedestrian fatalities represent only a part of the problem. <strong>Pedestrian</strong><br />
collisions also result in non-fatal injuries, some slight and some serious, and<br />
some requiring long-term care and rehabilitation.<br />
Table 1.1<br />
<strong>Road</strong> users killed in various modes of transport as a proportion (%) of<br />
global road traffic deaths, 2010*<br />
World Health<br />
Organization<br />
Region<br />
Car<br />
occupants<br />
Motorized<br />
2–3 wheelers<br />
<strong>Road</strong> users (%)<br />
Cyclists <strong>Pedestrian</strong>s Other/<br />
unspecified<br />
African LIC 35 11 7 38 9<br />
MIC 51 4 4 37 4<br />
All 43 7 5 38 7<br />
Americas MIC 31 16 3 27 23<br />
HIC 70 13 2 12 3<br />
All 42 15 3 23 17<br />
Eastern MIC 36 14 3 28 19<br />
Mediterranean<br />
HIC 63 3 2 27 5<br />
All 37 14 3 28 18<br />
European LIC 32 0 2 26 40<br />
MIC 52 7 3 32 6<br />
HIC 49 19 7 19 6<br />
All 50 12 4 27 7<br />
South-East Asia LIC 25 19 6 34 16<br />
MIC 15 34 4 11 36<br />
All 15 33 4 12 36<br />
Western Pacific LIC 12 66 4 12 6<br />
MIC 22 38 8 24 8<br />
HIC 33 18 10 33 6<br />
All 23 36 8 25 8<br />
World LIC 31 15 6 36 12<br />
MIC 27 25 4 22 22<br />
HIC 56 16 5 18 5<br />
All 31 23 5 22 19<br />
Note: The World Bank (Atlas method) gross income per capita for 2010 was used to categorize countries into:<br />
LIC (low-income countries) = US $1005 or less; MIC (middle-income countries) = US $1006 to 12 275; and<br />
HIC (high-income countries) = US $12 276 or more. Source: 19.<br />
* These data were not provided by all countries in the survey.<br />
10
<strong>Pedestrian</strong> <strong>safety</strong>: a road <strong>safety</strong> manual for decision-makers and practitioners<br />
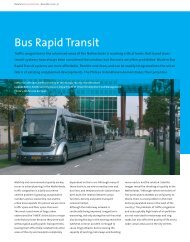
Figure 1.3 shows data from selected countries on the distribution of road traffic<br />
deaths by road user category, and highlights the variation between countries.<br />
<strong>Pedestrian</strong>s are disproportionately represented in road traffic fatalities in Bangladesh,<br />
El Salvador, Ghana and the Republic of Korea, while they form a smaller proportion<br />
in the Netherlands, Thailand and the United States, for example. Although Table 1.1<br />
shows that the proportion of pedestrians killed is lowest in South-East Asia,<br />
Bangladesh – a country in this region – has a substantially higher share of pedestrian<br />
fatalities indicating intra-regional differences.<br />
With the exception of the Eastern Mediterranean and Western Pacific Regions,<br />
pedestrians tend to account for a much greater proportion of road traffic injury<br />
deaths in low- and middle-income countries than in high-income countries (see<br />
Table 1.1). City-level studies further confirm that pedestrians form a high proportion<br />
of those killed in road traffic crashes in countries. For example, in India, pedestrians<br />
comprise 78% of people killed in road traffic crashes in Mumbai, and 53% in Delhi<br />
but only 10% at country level (20). While official statistics suggest that pedestrians<br />
account for around 29% in Mexico, other studies have placed this as high as 48% (21).<br />
The wide variation in pedestrian deaths between and within countries underscores<br />
the need for a comprehensive analysis of existing road traffic injury data at country,<br />
city and institutional (e.g. hospital) level to generate an accurate picture of the<br />
magnitude of pedestrian fatalities and injuries in the local setting (see Module 3).<br />
1: Why is addressing pedestrian <strong>safety</strong> necessary?<br />
Figure 1.3 <strong>Road</strong> users killed by different modes of transport as a proportion of<br />
national road traffic deaths, 2010<br />
Bangladesh<br />
Brazil<br />
China<br />
El Salvador<br />
France<br />
Ghana<br />
India<br />
Mexico<br />
Morocco<br />
Netherlands<br />
Republic of Korea<br />
Singapore<br />
Thailand<br />
United Arab Emirates<br />
United Kingdom<br />
United States<br />
0% 10% 20% 30% 40% 50% 60% 70% 80% 90% 100%<br />
<strong>Pedestrian</strong>s Cyclists Motorized 2–3 wheelers Motorized 4-wheelers Other<br />
Source: 19<br />
11
Why is addressing pedestrian <strong>safety</strong> necessary?<br />
Some pedestrian risks and challenges are not necessarily included in<br />
the definition of a road traffic collision and are therefore omitted from<br />
official road incident data, for example, obstructions on roads, falls, trips and<br />
slips, stumbling, animal bites and personal security. These hazards can lead<br />
to serious injury and even death. For example, in Sweden, pedestrians who are<br />
seriously injured following falls in the road traffic environment are not reported<br />
in official road traffic injury statistics (22). However, in 2011, the number of<br />
seriously injured pedestrians in the country was estimated to be 4500. If pedestrians<br />
who were seriously injured due to falling in the road environment had also<br />
been considered, the number of seriously injured would have been more than<br />
8400. One in every two people seriously injured in the road transport system<br />
in 2011 in Sweden was a pedestrian who fell. In this light, it is evident that<br />
several aspects of safe walking are omitted from official road traffic crash data.<br />
1.2.2 The cost of pedestrian fatalities and injuries<br />
<strong>Pedestrian</strong> collisions, like other road traffic collisions, have psychological,<br />
socioeconomic and health costs. <strong>Road</strong> traffic injuries consume financial resources<br />
that are needed for countries’ development. There is no global estimate of the<br />
economic impact of pedestrian road traffic crashes, but road traffic crashes in general<br />
are estimated to cost between 1 and 2% of gross national product (7). Survivors of<br />
pedestrian crashes, their families, friends and other caregivers often suffer adverse<br />
social, physical and psychological effects (see Box 1.2).<br />
BOX 1.2: Effect of a pedestrian death on a family, friends and community<br />
The incident described shows the impact of a pedestrian fatality on the victim’s immediate family members and<br />
also on their friends and the broader community:<br />
“Deana is my daughter. She was 17<br />
years old when her life was cut short.<br />
The crash occurred on 9 October 2003,<br />
at 22:30. Deana was with four friends<br />
going to a birthday party. They had just<br />
got out of a taxi and were trying to cross<br />
the Nile Corniche in Maadi. The taxi<br />
driver had let them off on the wrong<br />
side of the road. It is an extremely busy<br />
street. The traffic is heavy, chaotic. There are no<br />
traffic lights, no pedestrian crossings, just a constant<br />
stream of speeding weaving cars, trucks and buses.<br />
There is really nowhere to cross. You have to dart<br />
across several lanes of traffic to get to the other<br />
side. Deana was hit and killed by a speeding bus<br />
as she tried to cross the road. The bus driver didn’t<br />
even slow down.<br />
I was in Damascus at the time, travelling<br />
for my work. My brother-in-law called<br />
me to tell me the terrible news that my<br />
baby girl had been hit. You can imagine<br />
my guilt. I should have been in Cairo. I<br />
could have driven her to the party.<br />
Deana was beautiful. She had an infectious<br />
smile. She always had time for<br />
other people more than for herself. She had so many<br />
friends I could not count them all. She enjoyed life<br />
so much. Many of her friends still stay in touch with<br />
us. Everyone was deeply affected by her death: her<br />
family, her friends, the entire community, even people<br />
we didn’t know. I think of ripples of pain, an everwidening<br />
circle of those who were affected.”<br />
Source: 23.<br />
Association for Safe International <strong>Road</strong> Travel (ASIRT)<br />
12
<strong>Pedestrian</strong> <strong>safety</strong>: a road <strong>safety</strong> manual for decision-makers and practitioners<br />
1.2.3 Who are killed and injured as pedestrians?<br />
<strong>Pedestrian</strong>s form a mixed group of people with respect to age, gender and<br />
socioeconomic status. Characteristics of killed or injured pedestrians vary widely<br />
across countries and sub-national areas, underscoring the necessity of local data<br />
collection and analysis to develop a thorough understanding of the problem at the<br />
local level (see Module 3).<br />
Age<br />
<strong>Pedestrian</strong> crashes affect people from different age groups, though some age groups<br />
may be represented more than others in certain settings. For example:<br />
• About 57% of pedestrians killed in road traffic crashes in four South African cities<br />
were found to be aged from 20 to 44 years (24).<br />
• In the United States in 2009, the fatality rate for pedestrians older than 75 years<br />
was 2.28 per 100 000, higher than the fatality rate of any other age group (25).<br />
• In Hyderabad, India, 61% of pedestrians involved in road traffic crashes were<br />
between 21 and 40 years (26).<br />
• In New South Wales, Australia, in 2010, 20% of pedestrians killed were less than 21<br />
years old, and 29% were aged between 21 and 40 years (27).<br />
• A study of road traffic injuries among children and adolescents in urban Africa<br />
found that 68% of the cases were pedestrians (28).<br />
• A survey conducted in Dar es Salaam, Tanzania, found that 45% of those injured<br />
as pedestrians were adults (29).<br />
1: Why is addressing pedestrian <strong>safety</strong> necessary?<br />
Sex<br />
Male pedestrians, both children and adults, have been found to be over-represented<br />
in pedestrian collisions. For example, a study conducted in the United States found<br />
that males accounted for 70% of pedestrian deaths, with a fatality rate of 2.19 deaths<br />
per 100 000 population, compared to a female fatality rate of 0.91 per 100 000 (30).<br />
A study conducted in Mexico found the pedestrian mortality rate to be higher<br />
among males (10.6 per 100 000 population) than females (4 per 100 000) (31). A<br />
study of alcohol-impaired pedestrian patients in a South African hospital showed a<br />
male: female ratio of 2.3:1 (32).<br />
Socioeconomic status<br />
Socioeconomic status is a significant determinant of pedestrian injury. In general,<br />
people from poorer communities tend to be at a higher risk of pedestrian injuries.<br />
For example:<br />
• The risk of pedestrian injury for children in the lowest socioeconomic stratum was<br />
more than twice that of children of higher socioeconomic status categories in the<br />
United Kingdom (33).<br />
• <strong>Pedestrian</strong> crashes were four times more frequent in poor neighbourhoods of<br />
Orange County in California, United States (34).<br />
13
Why is addressing pedestrian <strong>safety</strong> necessary?<br />
• Children from the highest household income quartile were significantly less likely<br />
to sustain pedestrian road traffic injuries in Hyderabad, India (35).<br />
• Low income and poverty were associated with the largest numbers of child<br />
pedestrian crashes in the city of Memphis, United States (36).<br />
1.2.4 Where do pedestrian collisions occur?<br />
Overall, there is wide variation in locations of pedestrian collisions from one country<br />
to another. While pedestrian collisions occur more in urban areas than rural settings<br />
in high-income countries, the opposite is true in some low- and middle-income<br />
countries. For example, about 70% of all pedestrian fatalities in the European Union<br />
and 76% in the United States occur in urban areas (25,37). In the United Kingdom,<br />
young pedestrians from urban areas were involved in crashes five times more<br />
frequently than those in rural areas, and their death rate was twice as high (38). This<br />
is in contrast to a Chinese study, which found that pedestrians who commute in rural<br />
areas were more likely to suffer injuries than pedestrians who commuted in urban<br />
areas (39). A study of university students in Cairo, Egypt, found that participants<br />
who resided in rural areas were significantly more likely to suffer pedestrian injuries<br />
than those who resided in urban areas (40).<br />
Most pedestrian collisions occur when pedestrians are crossing the road (41). For<br />
example, a study in Ghana found that 68% of the pedestrians killed were knocked<br />
down by a vehicle when they were in the middle of the roadway (42). Information<br />
provided by 73 pedestrians in a study in Kenya showed that 53 (72.6%) were<br />
injured when crossing the road, 8 (11%) when standing by the road, 6 (8.2%) while<br />
© Hans-joachim Vollpracht<br />
14
<strong>Pedestrian</strong> <strong>safety</strong>: a road <strong>safety</strong> manual for decision-makers and practitioners<br />
walking along the road and 6 (8.2%) while engaging in other activities, including<br />
hawking (43). The reasons for the patterns summarized in this section are covered<br />
in Section 1.3 on risk factors and Module 2 on roadway design and land-use<br />
planning factors.<br />
1.2.5 When do pedestrian collisions occur?<br />
Night-time travel is one of the greatest risk factors for pedestrians (44,45). Twilight<br />
and the first hour of darkness typically see a high frequency of pedestrian collisions<br />
in the United States and in most other countries (46).<br />
In some countries, more pedestrian collisions occur during weekdays than weekends,<br />
while in others, there may be more fatal pedestrian collisions on weekends (47).<br />
During the month of December in the United States, collisions are concentrated<br />
around twilight and the first hour of darkness throughout the week. In June,<br />
however, collisions are concentrated around twilight and the first hours of darkness<br />
on Friday and Saturday (46).<br />
1: Why is addressing pedestrian <strong>safety</strong> necessary?<br />
1.3 What happens in a pedestrian collision?<br />
Most pedestrian–vehicle crashes involve frontal impacts (48). Figure 1.4 summarizes<br />
the contact points between the pedestrian and the car during a crash. It should be<br />
noted that in the course of car–pedestrian contact, the whole body wraps around the<br />
front of the car. An adult pedestrian is typically ‘run under’ rather than ‘run over’ by<br />
the striking car.<br />
The sequence of events in a frontal impact is fairly well summarized in studies (49).<br />
The starting point assumes a standing adult pedestrian who is struck by a car front:<br />
• The first contact occurs between the bumper and either the leg or knee-joint area,<br />
followed by thigh-to-bonnet edge contact.<br />
• The lower extremity of the body is accelerated forwards, and the upper body is<br />
rotated and accelerated relative to the car.<br />
• Consequently, the pelvis and thorax are struck by the bonnet edge and top,<br />
respectively.<br />
• The head will hit the bonnet or windscreen at a velocity that is at, or close to, that<br />
of the striking car.<br />
• The victim then falls to the ground.<br />
15
Why is addressing pedestrian <strong>safety</strong> necessary?<br />
Figure 1.4 Distribution of injuries on the body of a pedestrian in a frontal<br />
car–pedestrian collision<br />
Head trajectories<br />
40 km/h<br />
Small car<br />
Big car<br />
Injured body<br />
regions<br />
WAD<br />
20 km/h<br />
WAD: wrap-around distance<br />
Source: 49<br />
The point at which a vehicle hits a pedestrian will vary depending on the<br />
height of the car as well as the height of a pedestrian (50). For example,<br />
a modern raised vehicle may hit the head of a child pedestrian because he or<br />
she is short.<br />
The most serious injuries are usually caused by the direct impacts with the striking<br />
car rather than when the pedestrian is thrown to the road. The severity of injuries<br />
occurring to the head, brain, thorax, pelvis and extremities is influenced by:<br />
• car impact speed;<br />
• type of vehicle;<br />
• stiffness and shape of the vehicle;<br />
• nature of the front (such as the bumper height, bonnet height and length,<br />
windscreen frame);<br />
• age and height of the pedestrian; and<br />
• standing position of the pedestrian relative to the vehicle front (49).<br />
Motorcycles also contribute to pedestrian injuries. For example, in Brazil in<br />
2007, motorcycles were involved in 22.8% of all fatal pedestrian crashes and were<br />
responsible for the deaths of 85 pedestrians (10% of the total) (51). The mechanism<br />
of motorcycle–pedestrian collision has not been studied as extensively as the car–<br />
pedestrian one.<br />
16
<strong>Pedestrian</strong> <strong>safety</strong>: a road <strong>safety</strong> manual for decision-makers and practitioners<br />
1.4 Risk factors for pedestrian traffic injury<br />
The discussion in this section concentrates on key factors that influence the risk<br />
of pedestrian traffic injury: speed, alcohol, lack of pedestrian facilities, inadequate<br />
visibility of pedestrians and inadequate enforcement of traffic laws. These factors<br />
align well with the focus areas of a Safe Systems approach (see section 1.1.2), and<br />
correspond to the intervention measures described in Module 4.<br />
1.4.1 Speed<br />
Travelling speed and the risk of a pedestrian crash<br />
The speed at which a car is travelling influences both crash risk and crash<br />
consequences. The effect on crash risk comes mainly via the relationship between<br />
speed and stopping distance. The higher the speed of a vehicle, the shorter the<br />
time a driver has to stop and avoid a crash, including hitting a pedestrian (52)<br />
(see Figure 1.5). Taking into account the time needed for the driver to react to an<br />
emergency and apply the brakes, a car travelling at 50 km/h will typically require<br />
36 metres to stop, while a car travelling at 40 km/h will stop in 27 metres.<br />
1: Why is addressing pedestrian <strong>safety</strong> necessary?<br />
Figure 1.5 Speed and stopping distance for emergency braking<br />
50<br />
40<br />
Speed (km/h)<br />
30<br />
20<br />
10<br />
0<br />
0 5 10 15 20 25 30 35 40<br />
Distance (m)<br />
Source: 52<br />
Figure 1.5 is based on a physical representation of an average situation in which a<br />
driver takes 1.5 seconds to realize there is a risk of a collision with a pedestrian and<br />
apply the brakes. The car will then stop under braking with a deceleration of 0.7g<br />
after an initial latency period of 0.2 seconds for the brakes to be fully applied. In<br />
some situations the driver may react more quickly and the car stop more rapidly, but<br />
17
Why is addressing pedestrian <strong>safety</strong> necessary?<br />
in other situations, if the driver is not concentrating fully on the road ahead or the<br />
road is wet, the opposite will occur.<br />
If a car is travelling unusually fast, other road users such as a pedestrian waiting to cross<br />
the road may misjudge the speed of the approaching vehicle. The pedestrian may mistakenly<br />
assume it is safe to cross the road, attempt to do so and get struck by the vehicle.<br />
Impact speed and pedestrian injury severity<br />
The probability that a pedestrian will be fatally injured if hit by a motor vehicle<br />
increases markedly with impact speed (50,53,54). Research in the 1990s showed that<br />
pedestrians had a 90% chance of surviving car crashes at speeds of 30 km/h or lower,<br />
but less than a 50% chance of surviving impacts at 45 km/h (55). After adjusting for<br />
sampling and statistical analysis bias in that research, a more recent study shows<br />
an adult pedestrian has approximately a 20% risk of dying if struck by a car at<br />
60 km/h (54). It is important to note that this risk analysis is a work in progress and<br />
has not yet been corroborated by other researchers but the undisputed issue is that<br />
speed is an important risk factor for pedestrian injury and that impacts of above<br />
30 km/h increase the likelihood of severe injury or death.<br />
Impact speed is influenced by travelling speed and braking. Most speed is lost in the last<br />
few metres of braking, so that when a car travelling at 40 km/h has stopped, a car that<br />
was travelling at 50 km/h is still travelling at 41 km/h. Thus, a difference of 10 km/h in<br />
initial travelling speed can result in a difference of 41 km/h in impact speed.<br />
Factors influencing vehicle speed reveal how the interaction between the vehicle, road<br />
environment and road user create risks for pedestrians. The key aspects include (7):<br />
• driver-related factors (age, sex, alcohol level, number of people in the vehicle);<br />
• road- and vehicle-related factors (road layout, surface quality, vehicle power,<br />
maximum speed); and<br />
• traffic- and environment-related factors (traffic density and composition,<br />
prevailing speed, weather conditions).<br />
© Virot, WHO<br />
18
<strong>Pedestrian</strong> <strong>safety</strong>: a road <strong>safety</strong> manual for decision-makers and practitioners<br />
Speed management is important for addressing pedestrian <strong>safety</strong> around the world.<br />
Key measures for managing speed include setting speed limits to 30–40 km/h in<br />
residential and high pedestrian traffic areas, enforcing traffic rules on speed limits<br />
and implementing traffic-calming measures. These measures are examined in detail in<br />
Module 4.<br />
1.4.2 Alcohol<br />
Impairment by alcohol is an important factor influencing both the risk of a road<br />
traffic crash as well as the severity and outcome of injuries that result from it (7,56).<br />
Alcohol consumption results in impairment, which increases the likelihood of a<br />
crash because it produces poor judgement, increases reaction time, lowers vigilance<br />
and decreases visual acuity (56). Alcohol consumption is also associated with excessive<br />
speed (57,58). It is important to note that alcohol impairment as a risk factor is<br />
not limited to drivers of vehicles but is also important for pedestrians. Like motor<br />
vehicle drivers, a pedestrian’s risk of crash involvement increases with increasing<br />
blood alcohol content (BAC) (58).<br />
Alcohol impairment and pedestrian injury is a problem in several countries. For<br />
example:<br />
• Approximately one third of all fatally injured adult pedestrians in Australia have a<br />
BAC exceeding 0.08 to 0.1 g/dl (59).<br />
• Thirty-five per cent of fatally injured pedestrians in the United States in 2009 had<br />
a BAC above 0.08g/dl, compared to 13% of drivers involved in fatal pedestrian<br />
crashes (25).<br />
• Data from the United Kingdom show that 46% of fatally injured pedestrians had<br />
BAC in excess of 0.09g/dl in 1997 compared with 39% a decade earlier (47).<br />
• Twenty per cent of injured pedestrians treated in hospital emergency departments<br />
in Eldoret town in Kenya (n=30) had BAC exceeding the legal limit (i.e. for<br />
drivers) of 0.05g/dl (60).<br />
• Fifty-nine per cent of pedestrian patients in a hospital in South Africa were<br />
impaired above the legal limit of 0.08g/dl (32). Recent data from South Africa<br />
indicate that fatally injured pedestrians were more likely than fatally injured<br />
drivers to be blood alcohol positive. According to the South African National<br />
Injury Mortality Surveillance System, there were 31 177 fatal injuries registered in<br />
62 medico-legal laboratories in 2008. Of the 9153 cases that were fatally injured in<br />
traffic collisions, BAC values were available in 3062 (33.5%) of them. <strong>Pedestrian</strong>s<br />
had the highest proportion (63%) of those who had positive BAC, followed<br />
by drivers (58%), passengers (45%), railway cases (43%) and cyclists (43%).<br />
<strong>Pedestrian</strong>s also had the highest mean BAC (0.21 g/dl) – more than four times the<br />
legal limit of 0.05g/dl (61).<br />
1: Why is addressing pedestrian <strong>safety</strong> necessary?<br />
19
Why is addressing pedestrian <strong>safety</strong> necessary?<br />
Controlling impaired driving and walking is an important road <strong>safety</strong> strategy. Details<br />
on implementation of this strategy through setting and enforcing traffic laws, raising<br />
awareness and implementing infrastructural measures are provided in Module 4.<br />
1.4.3 Lack of pedestrian facilities in roadway design and land-use<br />
planning<br />
<strong>Pedestrian</strong> risk is increased when roadway design and land-use planning fail to plan<br />
for and provide facilities such as sidewalks, or adequate consideration of pedestrian<br />
access at intersections (4,62–64). Infrastructure facilities and traffic control<br />
mechanisms that separate pedestrians from motor vehicles and enable pedestrians<br />
to cross roads safely are important mechanisms to ensure pedestrian <strong>safety</strong>,<br />
complementing vehicle speed and road system management. These factors, along<br />
with the policy and planning reforms that support pedestrian <strong>safety</strong>, are discussed in<br />
detail in Module 2 and examples of their implementation are given in Module 4.<br />
1.4.4 Inadequate visibility of pedestrians<br />
The issue of pedestrians not being properly visible is frequently cited in literature as a<br />
risk for pedestrian injury. Inadequate visibility of pedestrians arises from (7):<br />
• inadequate, or lack of, roadway lighting;<br />
• vehicles and bicycles not equipped with lights;<br />
• pedestrians not wearing reflective accessories or brightly coloured clothes,<br />
especially at night and at dawn or dusk; and<br />
• pedestrians sharing road space with fast-moving vehicles.<br />
Measures for improving pedestrian visibility are discussed in Module 4.<br />
1.4.5 Other risk factors<br />
Several other factors that contribute to pedestrian injury include (4,7,9,48,51,65):<br />
• inadequate enforcement of traffic laws;<br />
• unsafe driving practices;<br />
• driver distraction, including mobile phone use;<br />
• driver fatigue;<br />
• pedestrian–vehicle conflict at pedestrian crossing points;<br />
• reduced reaction time and reduced walking speed for the elderly;<br />
• inability of children to gauge vehicle speed and other relevant information in<br />
order to cross the street safely alone;<br />
• lack of supervision of children who are too young to make safe judgements;<br />
• pedestrian distraction, including mobile phone use (see Box 1.3);<br />
• attitudes of drivers and pedestrians;<br />
20
<strong>Pedestrian</strong> <strong>safety</strong>: a road <strong>safety</strong> manual for decision-makers and practitioners<br />
• failure of drivers to respect right-of-way for pedestrians, including failure to yield<br />
at pedestrian crossings;<br />
• vehicle condition and defects (e.g. brakes, lighting, windscreen); and<br />
• quiet (electric) vehicles, whose presence cannot be detected by normal auditory<br />
means.<br />
BOX 1.3: Talking and walking: an emerging problem<br />
The use of mobile phones and other smartphones is<br />
growing exponentially worldwide. An estimated 77%<br />
of the world’s population owns a mobile phone (66).<br />
While the risk of talking and texting while driving a<br />
vehicle is now well documented (67) much less is<br />
known about walking and distraction.<br />
Since 2005, a number of studies, conducted primarily<br />
in the United States and among young adults,<br />
have been published that suggest pedestrians who<br />
are distracted by phone conversations, or other<br />
distracting activities such as listening to music<br />
or texting, take greater risks when crossing roads<br />
(66,68–72). These results can probably be generalized<br />
to pedestrians in other high-income countries.<br />
The contribution of distracted walking will most likely<br />
be higher in countries where there is a greater mix<br />
of traffic, less controlled crossings or where awareness<br />
of the risks is low because these pedestrians<br />
are at greater risk in the first place. A concerted,<br />
combined approach needs to be used in all countries.<br />
Hard-hitting social marketing campaigns are<br />
needed to educate pedestrians, while policy-makers<br />
and engineers need to consider alternative ways to<br />
protect those ‘talking and walking’, including modifying<br />
the environment.<br />
© Margie Peden<br />
1: Why is addressing pedestrian <strong>safety</strong> necessary?<br />
1.5 Summary<br />
The information presented in this module can be summarized as follows:<br />
• <strong>Pedestrian</strong> fatalities comprise about one fifth of the annual global road traffic<br />
injury deaths.<br />
• Male pedestrians tend to be over-represented in pedestrian collisions.<br />
• The characteristics of pedestrians killed in collisions – and the proportion of pedestrian<br />
traffic fatalities out of all road traffic fatalities – vary widely between and<br />
within countries. Effective interventions require collection and analysis of local data.<br />
21
Why is addressing pedestrian <strong>safety</strong> necessary?<br />
• The Safe System approach provides a viable, comprehensive framework to examine<br />
risk factors for pedestrians and to develop integrated interventions that address the<br />
road environment, road users and vehicles, and that maximize pedestrian <strong>safety</strong>.<br />
• The key risk factors for pedestrian road traffic injury are speed, alcohol, lack of<br />
infrastructure facilities for pedestrians and inadequate visibility of pedestrians.<br />
References<br />
1. Basset Jr DR, et al. Walking, cycling, and obesity rates in Europe, North America, and Australia. Journal of<br />
Physical Activity and Health, 2008, 5: 795–814.<br />
2. <strong>Global</strong> recommendations on physical activity for health. Geneva, World Health Organization, 2010.<br />
3. Rabl A, de Nazelle A. Benefits of shift from car to active transport. Transport Policy, 2012, 19: 121–131.<br />
4. Zegeer CV, Bushell M. <strong>Pedestrian</strong> crash trends and potential countermeasures from around the world.<br />
Accident Analysis & Prevention, 2012, 44:3–11.<br />
5. Job RFS. Overcoming barriers to pedestrian <strong>safety</strong>. In: Proceedings of the Australasian College of <strong>Road</strong> <strong>Safety</strong><br />
National Conference: A Safe Systems Approach: Expanding the Reach, Sydney, 9–10 August 2012. Canberra,<br />
Australasian College of <strong>Road</strong> <strong>Safety</strong>, 2012: 1–8 (http://acrs.org.au/events/acrs-past-conferences/2012-acrsconference/program/papers/,<br />
accessed 31 December 2012).<br />
6. Economic Commission for Europe Intersecretariat Working Group on Transport Statistics. Glossary for transport<br />
statistics, 3rd ed. New York, United Nations, 2003.<br />
7. Peden M et al., eds. World report on road traffic injury prevention. Geneva, World Health Organization, 2004.<br />
8. Jacobsen PL. <strong>Safety</strong> in numbers: more walkers and bicyclists, safer walking and bicycling. Injury Prevention,<br />
2003, 9: 205–209.<br />
9. Elvik R, et al. The handbook of road <strong>safety</strong> measures, 2nd ed. Bingley, Emerald Group Publishing Limited, 2009.<br />
10. Job RFS. The influence of subjective reactions to noise on health effects of the noise. Environment<br />
International, 1996, 22: 93–104.<br />
11. Litman TA. Economic value of walkability. World Transport Policy & Practice, 2004, 10: 5–14.<br />
12. Kumar S, Ross W. Effects of pedestrianisation on the commercial and retail areas: study in Khao San road,<br />
Bangkok. World Transport Policy & Practice, 2006, 13: 37–47.<br />
13. Dokmeci V, Altunbas U, Yazgi B. Revitalisation of the main street of a distinguished old neighbourhood in<br />
Istanbul. European Planning Studies, 2007, 15: 153–166.<br />
14. Stigson H, Krafft M, Tingvall C. Use of fatal real-life crashes to analyze a safe road transport system model,<br />
including the road user, the vehicle, and the road. Traffic Injury Prevention, 2008, 9: 463–471.<br />
15. <strong>Road</strong> traffic injury prevention: training manual. Geneva, World Health Organization, 2006.<br />
16. Towards zero: ambitious road <strong>safety</strong> targets and the Safe System approach. Paris, Organisation for Economic<br />
Co-operation and Development, 2008.<br />
17. Belin M-A. Public road <strong>safety</strong> policy change and its implementation: Vision Zero a road <strong>safety</strong> policy innovation<br />
[unpublished thesis]. Stockholm, Karolinska Institutet, 2012.<br />
18. Mooren L, et al. Safe system – comparisons of this approach in Australia. In: A safe system – making it happen:<br />
proceedings of the Australasian College of <strong>Road</strong> <strong>Safety</strong> Conference, Melbourne, 1–2 September, 2011. Canberra:<br />
Australasian College of <strong>Road</strong> <strong>Safety</strong> (http://acrs.org.au/wp-content/uploads/Mooren-et-al-Safe-System-<br />
%E2%80%93-Comparisons-of-this-Approach-in-Australia.pdf, accessed 1 January 2013).<br />
19. <strong>Global</strong> status report on road <strong>safety</strong> 2013: supporting a decade of action. Geneva, World Health Organization, 2013.<br />
20. Mohan D, et al. <strong>Road</strong> <strong>safety</strong> in India: challenges and opportunities. Ann Arbor, The University of Michigan<br />
Transportation Research Institute, 2009 (Report No. UMTRI-2009–1).<br />
21. Bartels D, et al. Incidence of road injuries in Mexico: country report. International Journal of Injury Control<br />
and <strong>Safety</strong> Promotion, 2010, 1–8.<br />
22. Analysis of road <strong>safety</strong> trends 2011, management by objectives for road <strong>safety</strong> work, towards the 2020 interim<br />
targets. Roda vagen, The Swedish Transport Administration, 2012.<br />
22
<strong>Pedestrian</strong> <strong>safety</strong>: a road <strong>safety</strong> manual for decision-makers and practitioners<br />
23. Faces behind the figures: voices of road traffic crash victims and their families. Geneva, World Health<br />
Organization, 2007.<br />
24. Mabunda MM, Swart LA, Seedat M. Magnitude and categories of pedestrian fatalities in South Africa.<br />
Accident Analysis & Prevention, 2008, 40: 586–593.<br />
25. Karsch HM, et al. Review of studies on pedestrian and bicyclist <strong>safety</strong>. Washington, D.C., National Highway<br />
Traffic <strong>Safety</strong> Administration, 2012 (DOT HS 811 614).<br />
26. Dandona R, et al. Patterns of road traffic injuries in a vulnerable population in Hyderabad, India. Injury<br />
Prevention, 2006, 12: 183–188.<br />
27. <strong>Road</strong> traffic crashes in NSW: statistical statement for the year ended December 31, 2010. Sydney, Australia, <strong>Road</strong>s<br />
& Traffic Authority of New South Wales, 2011.<br />
28. Hyder AA, Labinjo M, Muzaffar SF. A new challenge to child and adolescent survival in urban Africa: an<br />
increasing burden of road traffic injuries. Traffic Injury Prevention, 2006, 7: 381–388.<br />
29. Zimmerman K, et al. <strong>Road</strong> traffic injury incidence and crash characteristics in Dar es Salaam: a population<br />
based study. Accident Analysis & Prevention, 2012, 45:204–210.<br />
30. Clifton K, Livi A. Gender differences in walking behavior, attitudes about walking, and perceptions of the<br />
environment in three Maryland communities. In: Transportation Research Board, ed. Research on women’s issues<br />
in transportation: conference proceedings 35, Washington, D.C., Transportation Research Board, 2005: 79–88.<br />
31. Hijar MC, et al. Analysis of fatal pedestrian injuries in Mexico City, 1994–1997. Injury: International Journal<br />
of the Care of the Injured, 2001, 32: 279–284.<br />
32. Peden M, et al. Injured pedestrians in Cape Town – the role of alcohol. South African Medical Journal, 1996,<br />
86: 1103–1105.<br />
33. Roberts I, et al. Effect of environmental factors on risk of injury of child pedestrians by motor vehicles: a casecontrol<br />
study. British Medical Journal, 1995, 310: 91–94.<br />
34. Chakravarthy B, et al. The relationship of pedestrian injuries to socioeconomic characteristics in a large<br />
Southern California County. Traffic Injury Prevention, 2010, 11: 508–513.<br />
35. Dandona R, et al. Incidence and burden of road traffic injuries in urban India. Injury Prevention, 2008, 14:<br />
354–359.<br />
36. Rivara F, Barber M. Demographic analysis of childhood pedestrian injuries. Pediatrics, 1985, 76: 375–381.<br />
37. Community database on Accidents on the <strong>Road</strong>s in Europe. Fatalities at 30 days in EU countries: 2010 [website]<br />
(http://ec.europa.eu/transport/road_<strong>safety</strong>/pdf/statistics/2010_user.pdf, accessed 19 November 2012).<br />
38. Petch RO, Henson RR. Child road <strong>safety</strong> in the urban environment. Journal of Transport Geography,2000, 8:<br />
197–211.<br />
39. Ma WJ, et al. Socioeconomic status and the occurrence of non-fatal child pedestrian injury: results from a<br />
cross-sectional survey. <strong>Safety</strong> Science, 2010, 48: 823–828.<br />
40. Ibrahim JM, et al. <strong>Road</strong> risk-perception and pedestrian injuries among students at Ain Shams University,<br />
Cairo, Egypt. Journal of Injury and Violence Research, 2012, 4: 65–72.<br />
41. Vanderslice E. Why did the pedestrian cross the road? A global survey of technical, historical and philosophical<br />
issues around crossing the street. [Paper presented to Women’s Transportation Seminar National Conference,<br />
Portland, Oregon, 16–18 May 2001].<br />
42. Damsere-Derry J, et al. <strong>Pedestrian</strong>s’ injury patterns in Ghana. Accident Analysis & Prevention, 2010, 42:<br />
1080–1088.<br />
43. Ogendi J, et al. Pattern of pedestrian injuries in the city of Nairobi: implications for urban <strong>safety</strong> planning.<br />
Journal of Urban Health (in press).<br />
44. Kwan I, Mapstone J. Interventions for increasing pedestrian and cyclist visibility for the prevention of death and<br />
injuries (review). The Cochrane Collaboration, 2009, (4).<br />
45. Ackaah W, Adonteng DO. Analysis of fatal road traffic crashes in Ghana. International Journal of Injury<br />
Control and <strong>Safety</strong> Promotion, 2011, 18: 21–27.<br />
46. Griswold J, et al. Visual assessment of pedestrian crashes. Accident Analysis & Prevention, 2011, 43: 301–306.<br />
47. Martin A. Factors influencing pedestrian <strong>safety</strong>: a literature review. Crowthorne, Transport Research<br />
Laboratory and Transport for London, 2006 (PPR 241).<br />
48. Crandall JR, Bhalla KS, Madeley NJ. Designing road vehicles for pedestrian protection. British Medical<br />
Journal, 2002, 324: 1145–1148.<br />
49. Yang J. Review of injury biomechanics in car-pedestrian collisions. Report to European Passive <strong>Safety</strong> Network,<br />
2002.<br />
1: Why is addressing pedestrian <strong>safety</strong> necessary?<br />
23
Why is addressing pedestrian <strong>safety</strong> necessary?<br />
50. Tefft. B. Impact speed and a pedestrian’s risk of severe injury or death. Accident Analysis & Prevention, 2013,<br />
50: 871–878.<br />
51. Vasconcellos, EA. <strong>Road</strong> <strong>safety</strong> impacts of the motorcycle in Brazil. International Journal of Injury Control and<br />
<strong>Safety</strong> Promotion, 2012, 1–8.<br />
52. McLean AJ, et.al. Vehicle travel speeds and the incidence of fatal pedestrian collisions (Vol. 1). Canberra, Federal<br />
Office of <strong>Road</strong> <strong>Safety</strong>, 1994 (CR 146).<br />
53. Davis GA. Relating severity of pedestrian injury to impact speed in vehicle pedestrian crashes. Transportation<br />
Research Record, 2001, 1773: 108–113.<br />
54. Rosén E, Stigson H, Sander U. Literature review of pedestrian fatality risk as a function of car impact speed.<br />
Accident Analysis & Prevention, 2011, 43: 25–33.<br />
55. Pasanen E. Ajonopeudet ja jalankulkijan turvallisuus [Driving speeds and pedestrian <strong>safety</strong>]. Espoo, Teknillinen<br />
korkeakoulu, Liikennetekniikka, 1991.<br />
56. Drinking and driving: a road <strong>safety</strong> manual for decision-makers. Geneva, <strong>Global</strong> <strong>Road</strong> <strong>Safety</strong> <strong>Partnership</strong>, 2007.<br />
57. Stübig T, et al. Alcohol intoxication in road traffic accidents leads to higher impact speed difference, higher<br />
ISS and MAIS, and higher preclinical mortality. Alcohol, 2012, 46: 681–686.<br />
58. Phillips DP, Brewer KM. The relationship between serious injury and blood alcohol concentration (BAC)<br />
in fatal motor vehicle accidents: BAC=0.01% is associated with significantly more dangerous accidents than<br />
BAC=0.00%. Addiction, 2011, 106: 1614–1622.<br />
59. Cairney P, et al. Preventing crashes involving intoxicated pedestrians. Sydney, Aust<strong>Road</strong>s, 2004.<br />
60. Odero W. Alcohol-related road traffic injuries in Eldoret, Kenya. East African Medical Journal, 1998, 75:<br />
708–711.<br />
61. Donson H. A profile of fatal injuries in South Africa 2008: Annual report for South Africa based on the National<br />
Injury Mortality Surveillance System, Johannesburg, Medical Research Council, 2009.<br />
62. Tiwari G. Reducing pedestrian risk at junctions. In: Volvo Research and Educational Foundations, ed. 10 years<br />
with the FUT programme. Goteborg, Volvo Research and Educational Foundations, 2011: 126–135.<br />
63. Ewing R, Dumbaugh E. The built environment and traffic <strong>safety</strong>: a review of empirical evidence. Journal of<br />
Planning Literature, 2009, 23: 347–367.<br />
64. Sleet DA, Naumann RB, Rudd RA. Injuries and the built environment. In: Dannenberg AL et al. eds. Making<br />
healthy places: designing and building for health, well-being and sustainability. Washington, DC, Island Press,<br />
2011: 77–79.<br />
65. Hatfield J et al. Misunderstanding of right-of-way rules at various pedestrian crossing types: observational<br />
study and survey. Accident Analysis & Prevention, 2007, 39: 833–842.<br />
66. Schwebel DC, et al. Distraction and pedestrian <strong>safety</strong>: How talking on the phone, texting, and listening to<br />
music impact crossing the street. Accident Analysis & Prevention, 2012,45: 266–271.<br />
67. Mobile phone use: a growing problem of driver distraction. Geneva, World Health Organization, 2011.<br />
68. Bungum TJ, Day C, Henry LJ. The association of distraction and caution displayed by pedestrians at a lighted<br />
crosswalk. Journal of Community Health, 2005,30: 269–279.<br />
69. Hatfield J, Murphy S. The effect of mobile phone use on pedestrian crossing behaviour at signalized and<br />
unsignalized intersections. Accident Analysis & Prevention, 2007: 197–205.<br />
70. Nasar J, Hecht P, Werner R. Mobile telephones, distracted attention, and pedestrian <strong>safety</strong>. Accident Analysis<br />
& Prevention, 2008,40: 69–75.<br />
71. Stavrinos D, Byington KW, Schwebel DC. The effects of cell phone distraction on pediatric pedestrian injury<br />
risk. Pediatrics, 2009,123: e179–e185.<br />
72. Stavrinos D, Byington KW, Schwebel DC. Distracted walking: cell phones increase injury risk for college<br />
pedestrians. Journal of <strong>Safety</strong> Research, 2011,42: 101–107.<br />
24
2<br />
<strong>Pedestrian</strong> <strong>safety</strong> in roadway<br />
design and land-use planning
2<br />
2.1 How roadway design contributes to pedestrian injury...... 27<br />
<strong>Pedestrian</strong> <strong>safety</strong> in roadway<br />
design and land-use planning<br />
2.1.1 Traffic mix. ............................................. 29<br />
2.1.2 The width of roads and lanes, and road design speed ............ 31<br />
2.1.3 <strong>Pedestrian</strong> crossings. ..................................... 32<br />
2.1.4 High traffic volume roads. ................................. 33<br />
2.1.5 Perception of <strong>safety</strong> and security of the travel environment. ....... 34<br />
2.2 How land-use planning factors affect pedestrian <strong>safety</strong>..... 34<br />
2.3 Policy and planning reforms that support pedestrian <strong>safety</strong>. . 35<br />
2.4 Summary............................................... 37<br />
References ................................................. 38
<strong>Pedestrian</strong> <strong>safety</strong>: a road <strong>safety</strong> manual for decision-makers and practitioners<br />
<strong>Pedestrian</strong> <strong>safety</strong> requires that road design and land-use planning include<br />
safe, accessible and comprehensive facilities prioritizing the needs of pedestrians.<br />
This module examines the ways in which the design of roadways and the entire built<br />
environment can either prevent pedestrian traffic injuries or magnify pedestrian risk.<br />
The sections in this module are structured as follows:<br />
2.1 How roadway design contributes to pedestrian injury: This section discusses<br />
how inadequate consideration of pedestrian <strong>safety</strong> needs in roadway design can<br />
contribute to pedestrian traffic injury and provides examples of design features that<br />
improve pedestrian <strong>safety</strong>.<br />
2.2 How land-use planning contributes to pedestrian injury: This section<br />
discusses how land-use planning can contribute to pedestrian traffic injury and<br />
presents land-use plans that can reduce dangers to pedestrians.<br />
2.3 Policy and planning reforms that support pedestrian <strong>safety</strong>: This section<br />
summarizes policy and planning approaches that improve pedestrian <strong>safety</strong>.<br />
2: <strong>Pedestrian</strong> <strong>safety</strong> in roadway design and land-use planning<br />
2.1 How roadway design contributes to pedestrian injury<br />
<strong>Road</strong>way design has generally catered for the needs of motorized traffic, neglecting<br />
the needs of pedestrians (1–3). <strong>Road</strong>way designs in which facilities such as sidewalks<br />
and signalized crossings are missing, inadequate or in poor condition create risk<br />
for pedestrians (4–6). The provision of arterial roadways, intersections and fastspeed<br />
lanes without adequate attention to pedestrian facilities results in increased<br />
likelihood that pedestrians will be killed or injured when walking alongside or<br />
crossing the road (7–9). An assessment conducted in New Delhi showed that<br />
footpaths are either non-existent or poorly maintained (10). This study also revealed<br />
that road network designs did not include approaches on roads to bus shelters, bus<br />
priority lanes, continuous pedestrian paths, or lanes for slow vehicles like bicycles<br />
and rickshaws. There has been a recent effort to improve roadway design to cater for<br />
the <strong>safety</strong> needs of pedestrians in New Delhi (see Box 2.1).<br />
An assessment of roads in low- and middle-income countries in Asia,<br />
Africa, Eastern Europe and Latin America revealed that 84% of the roads<br />
surveyed had no pedestrian footpaths though they carried motor vehicle traffic<br />
moving at 40km/h or more (11).<br />
27
<strong>Pedestrian</strong> <strong>safety</strong> in roadway design and land-use planning<br />
BOX 2.1: <strong>Road</strong> design and pedestrian <strong>safety</strong> in New Delhi<br />
New Delhi has an approximate area of 1500 km 2 and a population of more than 14 million people. Nearly one<br />
third of all daily trips in New Delhi are made on foot (10). A similar proportion of trips are made by bus, and<br />
only about 9% of trips are on the bus rapid transit system. Though pedestrians and public transport users<br />
together form the largest group of road users, pedestrians have the largest share in road traffic fatalities,<br />
varying between 45% and 51%. From 2001 to 2009, an estimated 36 376 crashes involving pedestrians<br />
occurred in New Delhi, resulting in 8697 pedestrian deaths.<br />
<strong>Pedestrian</strong> fatalities as a proportion of all road traffic deaths,<br />
New Delhi, India, 2001–2009<br />
<strong>Pedestrian</strong> fatalities (%)<br />
51<br />
50<br />
49<br />
48<br />
47<br />
46<br />
45<br />
44<br />
43<br />
42<br />
2001 2002 2003 2004 2005 2006 2007 2008 2009<br />
Year<br />
One of the features of the pedestrian travel environment<br />
in New Delhi and several cities in low- and<br />
middle-income countries is the existence of ‘mixed<br />
traffic’ where pedestrians, bicycles and vehicles<br />
share the same road space, with no or very few<br />
facilities for pedestrians. Recommendations on how<br />
to improve road design in order to ensure <strong>safety</strong> of<br />
pedestrians in New Delhi were made for several<br />
years (11–13). In 2006, the New Delhi City Government<br />
introduced a 5.8-kilometre bus rapid transit<br />
system with detailed designs for exclusive bicycle<br />
lanes and pedestrian-friendly raised crossings and<br />
markings on the road, with the aim of reducing conflicts<br />
between pedestrians, cyclists and buses.<br />
The following features were introduced:<br />
• Using automatic signals to control all traffic movements<br />
at intersections.<br />
• Providing continuous footpaths, wide enough to<br />
support existing pedestrian traffic, on both sides<br />
of the road.<br />
• Providing adjoining footpaths at marked crossings<br />
at intersections, maintaining a continuous path for<br />
pedestrians.<br />
• Providing pedestrian holding areas at the roadside,<br />
at each intersection, where pedestrians can<br />
wait before crossing the road. This area is also<br />
designed for street vendors.<br />
• Providing a five-metre wide zebra strip across all<br />
intersection arms at pedestrian crossings. This is<br />
preceded by a stop line three metres away, providing<br />
a safe zone for pedestrians to cross in front of<br />
the stopped vehicular traffic.<br />
• Installing ‘rumble strips’ to reduce the speed of<br />
buses.<br />
• Providing parking bays for bicycles, bicycle rickshaws,<br />
three-wheelers and other vehicles.<br />
Preliminary analyses of pedestrian crashes and<br />
travel behaviour show the following (13):<br />
• The number of pedestrians freely crossing the<br />
road at any point was only reduced marginally,<br />
especially after installing the pedestrian fences.<br />
This finding shows that the fences did not make<br />
much difference.<br />
• The speed of buses was lowered after installing<br />
rumble strips in December 2008, and pedestrian<br />
incidents involving speeding buses have been<br />
reduced.<br />
• A 60–90% reduction in pedestrian fatalities was<br />
observed in 10 high-risk locations after installing<br />
traffic signals and rumble strips in 2011.<br />
28
• About 80% of bus commuters and bicycle users<br />
are satisfied with the bus rapid transit corridor<br />
design and would like the corridor to be extended.<br />
In addition to improving <strong>safety</strong> and the walking<br />
environment for pedestrians along the bus rapid<br />
transit corridor, there is an ongoing effort by<br />
researchers and practitioners to revise urban road<br />
standards for New Delhi, paying attention to the<br />
<strong>Pedestrian</strong> <strong>safety</strong>: a road <strong>safety</strong> manual for decision-makers and practitioners<br />
<strong>safety</strong> of pedestrians. The proposed revisions<br />
include guidelines for urban roads, intersections<br />
and roundabouts, and dedicated facilities for<br />
pedestrians, bicycles and buses (13). In 2012, the<br />
Unified Traffic and Transportation Infrastructure<br />
Planning and Engineering Centre, part of the<br />
Delhi Development Authority, released pedestrian<br />
and street design guidelines to ensure <strong>safety</strong> for<br />
pedestrians when planning road infrastructure.<br />
© WHO – T. Pietrasik<br />
2: <strong>Pedestrian</strong> <strong>safety</strong> in roadway design and land-use planning<br />
Specific aspects of roadway design that are most likely to influence pedestrian risk are<br />
discussed below.<br />
2.1.1 Traffic mix<br />
The risk of pedestrian injury is high when pedestrians share the road with vehicles<br />
travelling at fast speeds (14–16). Increased vehicle speeds are associated with increased<br />
injury severity and death for pedestrians and cyclists (17,18). Vehicle–pedestrian<br />
collisions are 1.5 to 2 times more likely to occur on roadways without sidewalks (19).<br />
In low- and middle-income countries, mixed use of the road space is common in both<br />
rural and urban areas. People stand and walk on the road carriageway, cross the street<br />
29
<strong>Pedestrian</strong> <strong>safety</strong> in roadway design and land-use planning<br />
at many points, and pedestrian facilities are lacking on many roads and/or ignored<br />
by vehicle drivers. In high-income countries, separation of slow and fast modes of<br />
transport and implementation of traffic-calming measures have become common<br />
practices in roadway design since the 1970s and 1980s. Some low- and middle-income<br />
countries face a serious problem where settlements flourish along national roads.<br />
Many of these settlements and roads lack sidewalks and other measures for pedestrian<br />
<strong>safety</strong> (see Box 2.2). Improving pedestrian <strong>safety</strong> in mixed traffic environments may<br />
utilize several measures such as sidewalks, raised crossings, reducing legal speed limits<br />
and road narrowing. These measures are discussed in Module 4.<br />
BOX 2.2: Planning for <strong>safety</strong> of settlements along national roads<br />
<strong>Road</strong> infrastructure is important for the economic<br />
development of low- and middle-income countries.<br />
Movement of goods and people within and between<br />
these countries requires a road network. These<br />
countries are building and improving roads to facilitate<br />
this movement, but inter-urban roads often pass<br />
through villages, towns and cities without adequate<br />
traffic-calming measures and sufficient separation of<br />
residential roads from fast-speed, inter-urban road<br />
networks. Inadequate foresight and <strong>safety</strong> planning<br />
in road network development creates risks for settlements<br />
along national roads.<br />
The mixing of human settlements and roads of various<br />
speeds increases the road traffic injury risk in<br />
villages and towns. In some cases, existing roads<br />
that pass through settlements are widened, often<br />
taking up the space meant for sidewalks. In other<br />
cases, human settlements and commercial activities<br />
commonly develop along inter-urban roads. The planning<br />
of these settlements does not often take into<br />
consideration the <strong>safety</strong> of pedestrians and other<br />
road users. Beginning with small markets along the<br />
road for agricultural products, these settlements<br />
grow into cottages and shops, and finally large<br />
buildings along both sides of the road. Commerce,<br />
residences and the road network combine in a way<br />
that increases risk as outlined below:<br />
• Intersections between local and national roads<br />
that create hazardous spots in a village. All types<br />
of road users, travelling at widely varying speeds,<br />
converge on a single intersection, causing conflicts<br />
and hazards.<br />
• Shops and other businesses generate traffic that<br />
further complicates the traffic flow.<br />
• Mini-buses worsen the situation by stopping wherever<br />
passengers and drivers desire, without due<br />
regard to safe pedestrian crossing.<br />
It is necessary to address road traffic injury risk at<br />
locations where residential areas and businesses<br />
develop along inter-urban roads. Master plans for<br />
appropriate land use and urban development need<br />
to be coordinated among different governmental and<br />
private agencies. Specific measures to improve road<br />
<strong>safety</strong> – in particular, pedestrian <strong>safety</strong> – in these<br />
situations include:<br />
• Separating traffic: Placing local distributor or agricultural<br />
roads alongside or parallel to high-speed<br />
roads effectively separates cyclists and pedestrians<br />
from dangerous traffic.<br />
• Reducing speed: Reducing the number of lanes<br />
to slow down vehicles when entering a settled<br />
© Hans-joachim Vollpracht<br />
30
area, for example, narrowing from a four-lane road<br />
to a two-lane road through the settlement. Other<br />
measures to slow traffic entering a settlement<br />
include speed bumps and rumble strips, which<br />
can be installed at the village entrance. Posting<br />
and enforcing speed limits for driving in settlements<br />
is also necessary.<br />
<strong>Pedestrian</strong> <strong>safety</strong>: a road <strong>safety</strong> manual for decision-makers and practitioners<br />
• Stopping buses and mini-buses: Bus stops generate<br />
flows of pedestrians and tend to be in places<br />
that are convenient to passengers and shoppers,<br />
rather than safe for pedestrians. Bus stops should<br />
be well marked and there should be a designated<br />
place for the bus or mini-bus to stop, with footpaths<br />
and safe pedestrian crossings nearby.<br />
2.1.2 The width of roads and lanes, and road design speed<br />
Source: 20,21.<br />
<strong>Road</strong> widening increases pedestrian injury risk (22–25). Wider lanes and roads, and<br />
higher design speed tend to increase motor vehicle traffic speed, which increases<br />
pedestrian risk. Wider roads with more traffic lanes and higher traffic speeds are also<br />
more dangerous for pedestrians to cross.<br />
<strong>Road</strong> design speed is the initial speed limit for a section of road at the<br />
planning stage. Factors considered when determining design speed are<br />
sight distance, radius, elevation and friction of the road (26). The design speed<br />
is determined before the road is built, implying that it may have to be adjusted<br />
to take into account the actual conditions when the road becomes operational,<br />
for example, adjacent land-uses and traffic mix.<br />
2: <strong>Pedestrian</strong> <strong>safety</strong> in roadway design and land-use planning<br />
Reducing the number of lanes appears to improve traffic <strong>safety</strong>, particularly for<br />
pedestrians and cyclists (27,28). Vehicles travel more slowly on single lane roads or<br />
when streets are narrow (29,30). Drivers may drive less aggressively and generally feel<br />
less safe and thus drive more cautiously on narrow streets (31,32).<br />
In general, slow and main streets experience low rates of vehicle–pedestrian crashes,<br />
while downtown areas with wide travel lanes and higher operating speeds experience<br />
higher rates (33). For this reason, a number of European cities have moved towards<br />
designing roads for lower vehicle operating speeds (31). For example, Freiburg in<br />
southern Germany has lowered the speed limit to 30 km/h on 90% of its streets and<br />
provided car-free residential areas for 15 000 people. The effect of this strategy is that<br />
24% of trips every day are on foot, 28% by bicycles, 20% by public transport and 28%<br />
by car (34).<br />
The Lancashire County Council in the United Kingdom, where approximately<br />
1.2 million people live (35), has also recently decided to implement a 30 km/h speed<br />
limit in all residential areas as well as outside of all schools. The 30 km/h speed limit<br />
31
<strong>Pedestrian</strong> <strong>safety</strong> in roadway design and land-use planning<br />
programme was approved in February 2011 at an estimated cost of US$ 14.9 million.<br />
It involves working with schools and communities to change driver attitudes and,<br />
if necessary, enforcement of the 30 km/h limit by working with the police. The first<br />
stage of the programme involving the introduction of 30 km/h speed limits with<br />
the associated sign and speed limit orders will be completed by December 2013. The<br />
programme has only commenced implementation and thus it is too early to evaluate<br />
it thoroughly. However, early indications are that the overall approach to road <strong>safety</strong><br />
is working since deaths and serious injuries fell by 4% between 2010 and 2011 and the<br />
proportion of children killed and seriously injured fell by over 11% during the same<br />
period.<br />
The Freiburg and Lancashire comprehensive approaches to speed limits for entire<br />
geographical areas is likely to be more effective than the fragmented approach of<br />
home zones or individual streets where one car trip can involve streets with three or<br />
four different speed limits. Consistency, complete geographical coverage and total<br />
commitment to pedestrian <strong>safety</strong> are essential. Furthermore, design features such<br />
as narrow lanes or traffic-calming enhance roadway <strong>safety</strong> performance for all road<br />
users when compared to more conventional roadway designs (36).<br />
2.1.3 <strong>Pedestrian</strong> crossings<br />
<strong>Pedestrian</strong>s cross one or more roads at some point in their journey, whether at an<br />
intersection or not. In many situations, crossing the road increases their risk of traffic<br />
injury. Intersections are associated with high rates of pedestrian collisions and injuries<br />
because they include a large number of pedestrian and vehicle conflict points (37,38).<br />
Uncontrolled intersections exacerbate such conflicts, as pedestrians may encounter<br />
oncoming vehicles travelling at elevated speeds that are not required to stop or yield.<br />
In some situations, the only way pedestrians can signal their intent to cross is to stand<br />
in the pedestrian crossing (39,40). Situations where drivers must yield to pedestrians<br />
in, rather than at an intersection, tend to be more risky for pedestrians.<br />
The place where two or more roads meet or cross each other is called a<br />
junction or intersection. Intersections with traffic controls such as stop<br />
signs, markings or managed by authorized personnel are referred to as controlled<br />
intersections. Intersections controlled by automatic traffic signals are<br />
called signalized intersections. Intersections that are not controlled by traffic<br />
signs, markings, authorized personnel or automatic traffic signals – leaving<br />
priority and traffic flow at the discretion of the road user – are referred to as<br />
uncontrolled intersections.<br />
32
<strong>Pedestrian</strong> <strong>safety</strong>: a road <strong>safety</strong> manual for decision-makers and practitioners<br />
Although signalized intersections appear to be safer for pedestrians than<br />
uncontrolled intersections, they are still dangerous environments for pedestrians. A<br />
major issue at signalized intersections is the conflict between left- or right-turning<br />
vehicles, which require a larger turning radius, as well as the fact that crossing<br />
pedestrians, may be obscured from the driver’s view. The length of time allowed<br />
for pedestrians to complete crossing is also a factor. Though motorists are required<br />
to give priority to pedestrians at signalized intersections, vehicles sometimes start<br />
turning while pedestrians are still crossing (41).<br />
A pedestrian crossing is a point on a road where pedestrians traverse<br />
the road. <strong>Pedestrian</strong> crossings, sometimes referred to as crosswalks,<br />
may be found at intersections or along road stretches. Marked crossings are<br />
designated by markings on the road, commonly white stripes. Signalized crossings<br />
include automatic traffic signals that indicate to pedestrians when they<br />
should cross.<br />
2: <strong>Pedestrian</strong> <strong>safety</strong> in roadway design and land-use planning<br />
Evidence to date indicates that marked pedestrian crossings should not be<br />
implemented without additional <strong>safety</strong> measures. <strong>Pedestrian</strong>s may falsely believe they<br />
are safer – that motorists are more likely to see them and stop – at marked pedestrian<br />
crossings, and therefore attempt crossing without due caution increasing their<br />
chance of being hit by a motor vehicle (42). A study of 1000 marked crossings and<br />
1000 unmarked comparison sites, all at uncontrolled crossings, found no significant<br />
difference in <strong>safety</strong> performance unless additional <strong>safety</strong> features such as automatic<br />
signals were used (43). This study also found that on multi-lane roads carrying over<br />
12 000 vehicles per day, a marked crossing was more likely to increase pedestrian<br />
risk compared to a similar unmarked crossing, unless <strong>safety</strong> features such as raised<br />
median refuge islands or pedestrian beacons were also installed. On multi-lane roads<br />
carrying over 15 000 vehicles per day, marked crossings were more likely to increase<br />
pedestrian risk even if raised median refuges were provided (43).<br />
2.1.4 High traffic volume roads<br />
<strong>Road</strong> environments with high traffic volume and inadequate attention to pedestrian<br />
<strong>safety</strong> have been found to exacerbate pedestrian collisions. One study in Ontario,<br />
Canada, found that the probability of a pedestrian collision with a left-turning<br />
vehicle was influenced by traffic volume (44), while another in a town in China<br />
found that high volumes of traffic, the presence of bus stops and high volumes of<br />
pedestrians crossing all led to increased collision risk for pedestrians (45).<br />
33
<strong>Pedestrian</strong> <strong>safety</strong> in roadway design and land-use planning<br />
Studies show that the number of pedestrian crashes increases with the volume of<br />
traffic, but the relationship is not always linear (5,46). Crash rates relative to exposure<br />
may actually decline with higher traffic volumes, and the severity of injury may also<br />
decline. In addition, in environments where there are many pedestrians or cyclists,<br />
motorists may be more aware of them and adjust their driving behaviour, thereby<br />
reducing risk (5,46).<br />
2.1.5 Perception of <strong>safety</strong> and security of the travel environment<br />
Understanding people’s perceptions of security in the walking environment is an<br />
important element for improving pedestrian <strong>safety</strong> (47). People may choose to avoid<br />
walking altogether if they perceive too great a risk of traffic injury or other threats<br />
to personal security. <strong>Pedestrian</strong>s’ perceptions of risk in the broader environment<br />
influence their road use behaviour, including whether or not they choose to use<br />
certain roads and pedestrian facilities.<br />
<strong>Pedestrian</strong>s will generally avoid both well known and unfamiliar streets, deserted<br />
public spaces and dark underpasses if they believe they will be at risk of harm,<br />
such as assault, in these locations. They might choose to cross a road in a location<br />
with higher traffic risk to avoid the risk of interpersonal violence. For example, a<br />
Colombian study found that the use of pedestrian bridges was influenced by the<br />
quality of illumination and pedestrians’ perception of security; bridges or road<br />
segments with traffic-calming treatments were avoided in areas where muggings<br />
were more prevalent (48). In both Mexico and South Africa, for example, reasons<br />
for avoiding the use of crossing facilities included lack of lighting at night and the<br />
perceived risk of assault (16,49).<br />
<strong>Pedestrian</strong>-friendly road design is necessary but not sufficient to ensure pedestrian<br />
<strong>safety</strong>. Other aspects related to perceived risk and road use behaviour must be<br />
considered and addressed, such as making streets more aesthetically pleasing,<br />
widening sidewalks, separating pedestrians from motor vehicles, providing street<br />
lighting, lowering vehicle speeds, and making streets safer from interpersonal violence.<br />
2.2 How land-use planning factors affect pedestrian <strong>safety</strong><br />
Beyond design elements of the roadway itself, the design and use of the broader<br />
land for commercial, industrial, recreational, transport, conservation, agricultural,<br />
or a mix of purposes, can contribute to the occurrence of pedestrian injuries and<br />
fatalities (4,5). The extent to which land-use planning provides facilities and services<br />
to ensure continuous, safe pedestrian access constitutes a major influence on<br />
pedestrian traffic risk.<br />
34
<strong>Pedestrian</strong> <strong>safety</strong>: a road <strong>safety</strong> manual for decision-makers and practitioners<br />
Land-use planning factors that affect pedestrian traffic risk include the following:<br />
• Population density: The frequency of pedestrian crashes in a given area is strongly<br />
influenced by the density of the resident population and the total population<br />
exposed to risk (50).<br />
• Land-use mix: Land-use planning policies and strategies that encourage a greater<br />
mix of land-uses and shorter trip distances make walking more feasible, and safer,<br />
if measures for safe walking have been considered (51,52).<br />
• City structure: There are wide variations in road traffic fatality rates, including<br />
pedestrian rates, across cities with different income levels and even within cities<br />
with similar income levels, implying that city structure, modal share and exposure<br />
of motorists and pedestrians may have a significant role in determining fatality<br />
rates, along with road design, vehicle design and income (2).<br />
Modal share is the proportion of travellers using different modes of transport:<br />
walking, bicycle, motorcycle, car, bus, tram and train.<br />
2: <strong>Pedestrian</strong> <strong>safety</strong> in roadway design and land-use planning<br />
2.3 Policy and planning reforms that support<br />
pedestrian <strong>safety</strong><br />
Land-use planning and roadway design should accommodate the specific needs of<br />
pedestrians not only to improve their <strong>safety</strong>, but also to increase pedestrian access<br />
to local services including shops, schools, hospitals, farms, neighbours, public<br />
transportation stops and social meetings (34). Worldwide, pedestrian needs are<br />
increasingly recognized in land-use, public space and transport planning, with an<br />
increasing number of countries making substantial investments in pedestrian <strong>safety</strong> in<br />
recent years. While some countries, such as China and India, are beginning to increase<br />
their efforts to address pedestrian <strong>safety</strong>, others such as the Netherlands and Denmark<br />
have already invested in pedestrian <strong>safety</strong> and walking for a relatively long time (18).<br />
A wide range of land-use planning and road design strategies to improve pedestrian<br />
<strong>safety</strong> have been developed and implemented in different countries (18,53,54).<br />
Effectiveness of these, and other measures, is discussed and examples of<br />
implementation provided in Module 4 but they generally include:<br />
• controlling vehicle speed;<br />
• developing traffic-calming measures;<br />
• restricting vehicle traffic in residential areas;<br />
• building sidewalks;<br />
• enforcing traffic laws;<br />
• pedestrianizing city centres;<br />
• installing pedestrian signals;<br />
35
<strong>Pedestrian</strong> <strong>safety</strong> in roadway design and land-use planning<br />
• constructing under- and over-passes;<br />
• creating a road network that separates access roads from through-roads and<br />
ensures that traffic volume on access roads is as small as possible;<br />
• reducing unnecessary travel;<br />
• encouraging walking and cycling;<br />
• designing pedestrian pathways to facilitate movement of people with mobility<br />
impairments;<br />
• locating roads, residential areas, workplaces and other industries in such a way that<br />
traffic volume and travel distances are minimized;<br />
• redesigning public spaces to cater for pedestrian <strong>safety</strong> needs, and to encourage<br />
walking;<br />
• integrating transportation planning with health issues, for example, active<br />
transport and design programmes; and<br />
• developing and implementing pedestrian <strong>safety</strong> policies.<br />
<strong>Pedestrian</strong>ization is the process of removing vehicular traffic from city<br />
streets or restricting vehicular access to streets for use by pedestrians.<br />
<strong>Pedestrian</strong>ization improves not only <strong>safety</strong> and accessibility for pedestrians but<br />
also contributes to reducing noise and air pollution, and creates more livable<br />
environments. <strong>Pedestrian</strong>ization schemes have also been associated with economic<br />
benefits with reported increases in visitors to commercial establishments.<br />
There are four main pedestrianization schemes:<br />
a) full-time pedestrian streets in which vehicular traffic is excluded or prohibited<br />
except for emergency vehicles;<br />
b) part-time pedestrian streets in which vehicular traffic is eliminated for certain<br />
hours of the day or certain days of the week;<br />
c) partial pedestrian streets that restrict vehicle access to slow public transport<br />
vehicles only; and<br />
d) partial pedestrian streets or traffic-calming measures that allow a mix of<br />
pedestrians and motor vehicles moving at a low speed (55).<br />
When many of the above-listed strategies are implemented in an integrated manner,<br />
the effect is to create healthy, efficient and sustainable communities where people may<br />
choose to walk in <strong>safety</strong> (see Figure 2.1). The eight strategic principles guiding this<br />
framework – increased inclusive mobility, well designed and managed spaces and places<br />
for people, improved integration of networks, supportive land-use and spatial planning,<br />
reduced road danger, less crime and fear of crime, more supportive authorities and a<br />
culture of walking – are described in Appendix 1. Developing and implementing these<br />
measures require planning and policy reforms from vehicle-dependent to a multi-modal<br />
and inclusive roadway design, land-use and public space planning approach (3,56–58).<br />
36
Figure 2.1 A comprehensive framework for safe walking<br />
Connected,<br />
safe, functional<br />
walking networks<br />
Integrated public transport<br />
Improved integration of networks<br />
Streets for people with priority,<br />
space and facilities for pedestrians<br />
Well designed and managed<br />
Reduced road danger<br />
High-quality and fully accessible<br />
urban green spaces and waterways<br />
<strong>Pedestrian</strong> <strong>safety</strong>: a road <strong>safety</strong> manual for decision-makers and practitioners<br />
<strong>Pedestrian</strong>-friendly<br />
driving culture<br />
Slower speeds<br />
Safer crossings<br />
Manage traffic and<br />
enforce laws<br />
Healthy, efficient and sustainable communities<br />
where people choose to live<br />
Local<br />
walking<br />
action plans<br />
Consultation<br />
Staff training<br />
Planning gives<br />
priority to people on foot<br />
<strong>Pedestrian</strong> access for<br />
new developments<br />
Accessible<br />
streets<br />
Accessible squares<br />
Accessible public<br />
buildings<br />
Supportive land-use<br />
and spatial planning<br />
Buildings<br />
with views<br />
onto and activity<br />
at street level<br />
Brighter, lighter streets<br />
with clear sightlines<br />
<strong>Safety</strong> awareness, training and<br />
education for all ages<br />
Financial incentives for<br />
people who walk more<br />
Collaboration and<br />
promotion of walking<br />
Information and<br />
sign systems<br />
Less crime and fear of crime<br />
A culture of walking<br />
2: <strong>Pedestrian</strong> <strong>safety</strong> in roadway design and land-use planning<br />
spaces and places for people<br />
Resources<br />
Monitoring and<br />
evaluation<br />
More supportive authorities<br />
Accessible public<br />
transport systems<br />
Increased inclusive mobility<br />
Source: 59.<br />
2.4 Summary<br />
The content of this module is summarized as follows:<br />
• <strong>Road</strong>way design can both increase and reduce traffic risk for pedestrians through<br />
presence or absence of pedestrian facilities such as sidewalks and signalized crossings.<br />
Land-use development factors such as population density, land-use diversity or<br />
mix and the location of activities can affect pedestrian accessibility and risks.<br />
• Several strategies exist to incorporate specific attention to pedestrian <strong>safety</strong> needs<br />
in road design and land-use planning.<br />
37
<strong>Pedestrian</strong> <strong>safety</strong> in roadway design and land-use planning<br />
References<br />
1. Hook W. Counting on cars, counting out people: a critique of the World Bank’s economic assessment procedures<br />
for the transport sector and their environmental implications, New York, Institute for Transportation and<br />
Development Policy, 1994.<br />
2. Mohan D. Traffic <strong>safety</strong> and city structure: lessons for the future. Salud Pública México, 2008, 50: S93–S100.<br />
3. Khayesi M, Monheim H, Nebe J. Negotiating “streets for all” in urban transport planning: the case for<br />
pedestrians, cyclists and street vendors in Nairobi, Kenya. Antipode, 2010, 42: 103–126.<br />
4. Peden M et al., eds. World report on road traffic injury prevention. Geneva, World Health Organization, 2004.<br />
5. Elvik R, et al. The handbook of road <strong>safety</strong> measures, 2nd ed. Bingley, Emerald Group Publishing Limited, 2009.<br />
6. Ernst M, Shoup L. Dangerous by design: solving the epidemic of preventable pedestrian deaths and making great<br />
neighborhoods. Washington, D.C., Transportation for America, 2009.<br />
7. Vanderslice E. Why did the pedestrian cross the road? A global survey of technical, historical and philosophical<br />
issues around crossing the street. [Paper presented to Women’s Transportation Seminar National Conference,<br />
Portland, Oregon, 16–18 May 2001].<br />
8. McMahon P. J. et al. An analysis of factors contributing to “walking along roadway” crashes: Research study and<br />
guidelines for sidewalks and walkways. Chapel Hill, University of North Carolina Highway <strong>Safety</strong> Research<br />
Center, 2002 (FHWA-RD-01–101).<br />
9. Rothman L, et al. <strong>Pedestrian</strong> crossing location influences injury severity in urban areas. Injury Prevention,<br />
2012, 18: 365–370.<br />
10. Tiwari G. <strong>Pedestrian</strong> infrastructure in the city transport system: A case study of Delhi. Transport Policy &<br />
Practice, 2001, 7: 13–18.<br />
11. Vaccines for roads, 2nd edition. Hampshire, United Kingdom, International <strong>Road</strong> Assessment Programme, 2012.<br />
12. Tiwari G, et al. Survival analysis: pedestrian risk exposure at signalized intersections. Transportation Research<br />
Part F, 2007, 10: 77–89.<br />
13. Tiwari G. Reducing pedestrian risk at junctions. In: Volvo Research and Educational Foundations, ed. 10 years<br />
with the FUT programme. Göteborg, Volvo Research and Educational Foundations, 2011: 126–135.<br />
14. Mohan D, Tiwari G. Traffic <strong>safety</strong> in low-income countries: issues and concerns regarding tech nology transfer<br />
from high-income countries. In: Reflections on the transfer of traffic <strong>safety</strong> knowledge to motorising nations.<br />
Melbourne, <strong>Global</strong> Traffic <strong>Safety</strong> Trust, 1998: 27–56.<br />
15. Police enforcement strategies to reduce traffic casualties in Europe. Brussels, European Transport <strong>Safety</strong> Council,<br />
1999.<br />
16. Híjar M, Trostle J, Bronfman M. <strong>Pedestrian</strong> injuries in Mexico: a multi-method approach. Social Science and<br />
Medicine, 2003, 57: 2149–2159.<br />
17. Rosén E, Stigson H, Sander U. Literature review of pedestrian fatality risk as a function of car impact speed.<br />
Accident Analysis & Prevention, 2011, 43: 25–33.<br />
18. Zegeer CV, Bushell M. <strong>Pedestrian</strong> crash trends and potential countermeasures from around the world.<br />
Accident Analysis & Prevention, 2012, 44: 3–11.<br />
19. Knoblauch RL, et al. Investigation of exposure-based pedestrian accident areas: crosswalks, sidewalks, local streets,<br />
and major arterials. Washington, D.C., Federal Highway Administration, 1988.<br />
20. Vollpracht HJ. They call them coffin roads. Routes-<strong>Road</strong>s, 2010, 347: 43–53.<br />
21. Diallo B. <strong>Road</strong>s that serve the neediest users, yet all too often kill them in the process. Routes-<strong>Road</strong>s, 2010,<br />
347: 55–57.<br />
22. Hummer JE, Lewis CF. Operational capacity of three-lane cross-sections. Raleigh, Center for Transportation<br />
Engineering Studies, North Carolina State University, 2000 (Report FHWA/NC/2000–003).<br />
23. Sawalha Z, Sayed T. Evaluating <strong>safety</strong> on urban arterial roadways. Journal of Transportation Engineering, 2001,<br />
127: 151–158.<br />
24. Noland RB, Oh L. The effect of infrastructure and demographic change on traffic-related fatalities and<br />
crashes: A case study of Illinois county-level data. Accident Analysis & Prevention, 2004, 36: 525–532.<br />
25. Dumbaugh E. Safe streets, liveable streets. Journal of the American Planning Association, 2005, 71: 283–298.<br />
26. Faghri A, Capparuccini D, Cvetek T. Design speed selection recommendations. Newark, Delaware Center for<br />
Transportation, University of Delaware, 2004.<br />
38
<strong>Pedestrian</strong> <strong>safety</strong>: a road <strong>safety</strong> manual for decision-makers and practitioners<br />
27. Knaap KK, Giese K. Guidelines for the conversion of urban four-lane undivided roadways to three-lane two-way<br />
left-turn facilities. Ames, Center for Transportation Research and Education, Iowa State University, 2001.<br />
28. Huang HF, Stewart J R, Zegeer CV. Evaluation of lane reduction “road diet” measures on crashes and injuries.<br />
Transportation Research Record, 2002, 1784: 80–90.<br />
29. Gattis JL. Urban street cross section and speed issues. Transportation Research E-Circular, 2000 (http://trid.<br />
trb.org/view.aspx?id=686641, accessed 29 December 2012).<br />
30. Fitzpatrick K, et al. Design factors that affect driver speed on suburban streets. Transportation Research<br />
Record, 2001, 1751:18–25.<br />
31. Mahalel D, Szternfeld Z. <strong>Safety</strong> improvements and driver perception. Accident Analysis & Prevention, 1986,<br />
18: 37–42.<br />
32. Untermann RK. Street design – reassessing the function, <strong>safety</strong>, and comfort of streets for pedestrians. In:<br />
Proceedings of the 11th International <strong>Pedestrian</strong> Conference: The <strong>Road</strong> Less Traveled: Getting There by Other<br />
Means, Boulder, 3–6 October 1990. Boulder, The Division, 1990: 19–26.<br />
33. Garder PE. The impact of speed and other variables on pedestrian <strong>safety</strong> in Maine. Accident Analysis &<br />
Prevention, 2004, 36: 533–542.<br />
34. Whitelegg J. Quality of life and public management: redefining development in the local environment. Oxon,<br />
Routledge, 2012.<br />
35. Lancashire County Council. Slow down to 20mph – you could save a life [website] (http://www3.lancashire.<br />
gov.uk/corporate/web/?siteid=6030&pageid=34830, accessed 27 December 2012).<br />
36. Ewing R, Dumbaugh E. The built environment and traffic <strong>safety</strong>: a review of empirical evidence. Journal of<br />
Planning Literature, 2009, 23: 347–367.<br />
37. Lane PL, et al. <strong>Pedestrian</strong>s in real world collisions. The Journal of Trauma, 1994, 36: 231–236.<br />
38. Lord D, et al. A strategy to reduce older driver injuries at intersections using more accommodating<br />
roundabout design practices. Accident Analysis & Prevention, 2007, 39: 427–432.<br />
39. Guth D, et al. Blind and sighted pedestrians’ judgments of gaps in traffic at roundabouts. Human Factors: The<br />
Journal of the Human Factors and Ergonomics Society, 2005, 47: 314–331.<br />
40. Crowley-Koch BJ, Houten VR, Lim E. Effects of pedestrian prompts on motorist yielding at crosswalks.<br />
Journal of Applied Behavior Analysis, 2011, 44: 121–126.<br />
41. Lord DA, Smiley A, Haroun A. <strong>Pedestrian</strong> accidents with left-turning traffic at signalized intersections:<br />
characteristics, human factors and unconsidered issues [website] (http://www.walkinginfo.org/library/details.<br />
cfm?id=3581, accessed 5 January 2013).<br />
42. Koepsell T. Crosswalk markings and the risk of pedestrian-motor vehicle collisions in older pedestrians.<br />
Journal of American Medical Association, 2002, 288: 2136–2143.<br />
43. Zegeer CV. <strong>Safety</strong> effects of marked vs. unmarked crosswalks at uncontrolled locations: Executive summary<br />
and recommended guidelines. Washington, D.C., Federal Highway Administration (Report No. FHWA-<br />
RD-01–075), 2002.<br />
44. Quaye K, et al. <strong>Pedestrian</strong> accidents and left-turning traffic at signalized intersections. Washington, D.C., AAA<br />
Foundation for Traffic <strong>Safety</strong>, 1993.<br />
45. Chen Y, Meng H, Wang Z. <strong>Safety</strong> improvement practice for vulnerable road users in Beijing intersections.<br />
TRB 88th Annual Meeting Compendium of Papers. Washington D.C., Transportation Research Board, 2009.<br />
46. Jacobsen PL. <strong>Safety</strong> in numbers: more walkers and bicyclists, safer walking and bicycling. Injury Prevention,<br />
2003, 9:205–209.<br />
47. Methorst R, et al. <strong>Pedestrian</strong>s’ quality needs: final report. Cheltenham, Walk21, 2010.<br />
48. Villaveces A, et al. <strong>Pedestrian</strong>s’ perceptions of walkability and <strong>safety</strong> in relation to the built environment in<br />
Cali, Colombia, 2009–10. Injury Prevention, 2012, 18: 291–297.<br />
49. Behrens R, Jobanputra R. The impact of traffic <strong>safety</strong> and crime on travel behaviour and attitudes in Cape Town:<br />
a review of empirical evidence. [Paper presented to International Workshop on <strong>Safety</strong>, Sustainability and the<br />
Future of Urban Transport, Delhi, 9–12 March, Delhi, 2012].<br />
50. McLean J. The man in the street: pedestrian accidents in the Empire State’. In: Proceedings of 15th Annual<br />
Conference, American Association for Automotive Medicine, 1972: 97–121.<br />
51. Buehler R. Determinants of transport mode choice: a comparison of Germany and the USA. Journal of<br />
Transport Geography, 2011, 19: 644–657.<br />
52. Dumbaugh E, Li W. Designing for the <strong>safety</strong> of pedestrians, cyclists, and motorists in the built<br />
environment. Journal of the American Planning Association, 2011, 77:69–88.<br />
2: <strong>Pedestrian</strong> <strong>safety</strong> in roadway design and land-use planning<br />
39
<strong>Pedestrian</strong> <strong>safety</strong> in roadway design and land-use planning<br />
53. Retting R, Ferguson S, McCartt A. A review of evidence-based traffic engineering measures designed to<br />
reduce pedestrian–motor vehicle crashes. American Journal of Public Health, 2003, 93: 1456–1463.<br />
54. Sleet DA, Naumann RB, Rudd RA. Injuries and the built environment. In: Dannenberg AL et al, eds. Making<br />
healthy places: designing and building for health, well-being and sustainability. Washington, D.C., Island Press,<br />
2011: 77–79.<br />
55. Monheim R. Parking management and pedestrianisation as strategies for successful city centres. In: European<br />
Conference of Ministers of Transport, ed. Sustainable transport in central and eastern European cities. Paris,<br />
Organisation for Economic Co-operation and Development, 1996: 45–135.<br />
56. Take back your streets: how to protect communities from asphalt and traffic. Boston, Conservation Law<br />
Foundation, 1995.<br />
57. Monheim H. Efficient mobility without private cars: a new transport policy for Europe. In: Ramos MJ and<br />
Alves MJ, eds. The walker and the city. Lisbon, Associacao de Cidadaos Auto-mobilizados, 2010: 19–39.<br />
58. Litman T. Toward more comprehensive and multi-modal transport evaluation. Victoria, Victoria Transport<br />
Policy Institute, 2012.<br />
59. Walk21. International Charter for Walking: Creating healthy, efficient and sustainable communities where people<br />
choose to walk [website] (http://www.walk21.com/charter/default.asp, accessed 9 January 2013).<br />
40
3<br />
Prioritizing pedestrian<br />
<strong>safety</strong> interventions and<br />
preparing a plan of action
3<br />
3.1 Why assess the pedestrian <strong>safety</strong> situation? ............... 43<br />
Prioritizing pedestrian <strong>safety</strong><br />
interventions and preparing<br />
a plan of action<br />
3.2 How to assess the pedestrian <strong>safety</strong> situation.............. 44<br />
3.2.1 Assessing the magnitude, trends and patterns of pedestrian<br />
fatalities and injuries..................................... 44<br />
3.2.2 Assessing risk factors for pedestrian injury..................... 48<br />
3.2.3 Assessing the policy environment and existing initiatives on<br />
pedestrian <strong>safety</strong> ........................................ 51<br />
3.3 Preparing a pedestrian <strong>safety</strong> action plan ................. 53<br />
3.3.1 Mobilizing stakeholders ................................... 54<br />
3.3.2 Core components of an action plan .......................... 56<br />
3.4 Summary. .............................................. 58<br />
References ................................................. 59
<strong>Pedestrian</strong> <strong>safety</strong>: a road <strong>safety</strong> manual for decision-makers and practitioners<br />
Modules 1 and 2 provided a global picture of pedestrian traffic injury,<br />
discussed several factors that influence pedestrian traffic risk, and underscored<br />
the necessity of understanding the local situation when planning and adapting<br />
effective interventions. This module provides information on how to assess the<br />
pedestrian <strong>safety</strong> situation, with the aim of prioritizing interventions as well as how<br />
to prepare a corresponding plan of action. The content in this module is organized<br />
according to three themes:<br />
3.1 Why assess pedestrian <strong>safety</strong>? This section shows that assessing the pedestrian<br />
<strong>safety</strong> situation provides vital information to guide decision-making on prioritizing<br />
interventions.<br />
3.2 How to assess pedestrian <strong>safety</strong>: This section discusses assessment of the<br />
magnitude and pattern of pedestrian traffic injuries, the risk factors, stakeholders,<br />
and existing initiatives and policy environment. The section provides essential details<br />
on aspects to be assessed and methods for conducting assessments.<br />
3.3 Preparing a plan of action: This section explains the preparation of a plan<br />
of action to address the pedestrian <strong>safety</strong> problems identified in the situational<br />
assessment.<br />
3.1 Why assess the pedestrian <strong>safety</strong> situation?<br />
As discussed in Modules 1 and 2, the characteristics of pedestrian crashes vary<br />
tremendously across different communities and countries. A situational assessment<br />
constitutes an essential step to facilitate understanding of the local pedestrian <strong>safety</strong><br />
situation. The information gathered during a situational assessment is used to make<br />
decisions on priority focus areas, the best approaches to improve pedestrian <strong>safety</strong>,<br />
and whether to strengthen existing plans and programmes or develop new initiatives.<br />
A situational assessment should be conducted prior to initiating a new pedestrian<br />
<strong>safety</strong> programme. A community cannot assume another community’s solutions will<br />
be effective for its specific pedestrian <strong>safety</strong> problems. Effective interventions depend<br />
on the dynamics relevant to the local situation, and understanding this local situation<br />
is important for planning appropriate solutions.<br />
3: Prioritizing pedestrian <strong>safety</strong> interventions and preparing a plan of action<br />
Although a situational assessment is typically conducted prior to initiating<br />
a programme, emphasis also needs to be given to occasional assessments<br />
of the pedestrian <strong>safety</strong> situation as the transport, socioeconomic and<br />
environmental situation changes in a given setting.<br />
43
Prioritizing pedestrian <strong>safety</strong> interventions and preparing a plan of action<br />
3.2 How to assess the pedestrian <strong>safety</strong> situation<br />
The pedestrian <strong>safety</strong> situational assessment should cover a range of topics related<br />
to the magnitude of the problem, risk factors and existing policies and programmes<br />
(see also Modules 1 and 2). The assessment must take care to identify issues that<br />
are hidden or require deeper analysis, as well as those that are obvious or easy to<br />
discover (1). This section provides information on how to conduct a situational<br />
assessment by suggesting methods for specific aspects to be assessed.<br />
A situational assessment of pedestrian <strong>safety</strong> entails the following activities:<br />
• describing the magnitude, trends and patterns of pedestrian fatalities and injuries;<br />
• analysing risk and protective factors for pedestrian injuries and fatalities;<br />
• examining the times and places where pedestrian injuries and fatalities occur;<br />
• describing the modes of transport involved in conflicts with pedestrians;<br />
• identifying and assessing existing pedestrian <strong>safety</strong> programmes and institutions to<br />
identify gaps and areas to improve as well as those to maintain; and<br />
• identifying contextual factors related to politics, environment, economics and<br />
capacity that may facilitate or hinder the implementation of pedestrian <strong>safety</strong><br />
measures.<br />
Key contributions to the situational assessment will come from various existing<br />
data sources, including from agencies responsible for roads and transportation,<br />
law enforcement, urban and regional planning, public health, finance, as well as<br />
from road <strong>safety</strong> nongovernmental organizations. Additional data in the form<br />
of observational studies, surveys and/or road <strong>safety</strong> audits may be required to<br />
supplement existing data sources.<br />
3.2.1 Assessing the magnitude, trends and patterns of pedestrian<br />
fatalities and injuries<br />
Accurate data on the extent of the pedestrian <strong>safety</strong> problem are essential to define<br />
the problem and develop appropriate measures. The types of data needed for the<br />
assessment can be grouped into minimum and complementary data (see Table 3.1).<br />
The minimum data set includes information on the what, where, when and why<br />
dimensions of pedestrian injuries (2). In addition, it is important to have background<br />
information on population, transport and socioeconomic indicators of the<br />
setting under investigation. These additional data provide information needed for<br />
computing indicators for comparison.<br />
Police departments and health facilities provide most of the data used in pedestrian<br />
injury analysis and prevention. There may be other data sources such as vital<br />
registration records, insurance companies, nongovernmental organizations, academic<br />
institutions, scientific studies, hospital-based injury surveillance systems or the<br />
ministry of health, each with its own type of data and quality issues. The situational<br />
44
Table 3.1<br />
<strong>Pedestrian</strong> <strong>safety</strong>: a road <strong>safety</strong> manual for decision-makers and practitioners<br />
assessment should identify all data sources for the minimum data requirements and<br />
make some assessment of their quality and reliability. Discrepancies in the number,<br />
severity and patterns of pedestrian injuries across data sources should be explored<br />
and, if possible, explained.<br />
For further information on assessing data quality and data systems, please consult<br />
Data systems: a road <strong>safety</strong> manual for decision-makers and practitioners, a companion<br />
document in this series (2).<br />
Minimum data<br />
Minimum and complementary data for assessing the pedestrian<br />
<strong>safety</strong> situation<br />
How big is the problem?<br />
• Number of crashes involving pedestrians.<br />
• Number of pedestrians killed in road traffic crashes.<br />
• Number of pedestrians injured in road traffic crashes.<br />
• Total number of road traffic fatalities and injuries,<br />
preferably disaggregated by road user types.<br />
What type of traffic conflicts lead to pedestrian crashes?<br />
• Involvement of cars, trucks, motorcycles, bicycles and<br />
animal-drawn carts, etc.<br />
• Vehicle manoeuvres (e.g. turning).<br />
On what day of the week and at what time do pedestrian<br />
collisions occur?<br />
• Date and time of injuries.<br />
How serious are the injuries?<br />
• Severity of pedestrian injuries.<br />
Which type of crashes lead to disability or life-threatening<br />
outcomes?<br />
• Outcome following collisions.<br />
Who is involved in pedestrian collisions?<br />
• Age and sex of those killed or injured as pedestrians.<br />
Where do pedestrian crashes occur?<br />
• Place of crash (specific location such as urban, rural<br />
and type of road).<br />
• Dangerous road locations.<br />
Complementary data<br />
How many people live in the area being<br />
assessed?<br />
• Total number of people in the<br />
population under study (including<br />
disaggregation by urban and non-urban,<br />
by age and income).<br />
How and why do people typically travel<br />
around the area?<br />
• Origins and destinations of trips.<br />
• Transport modes used.<br />
• Trip distances.<br />
• Trip purposes.<br />
What is the socioeconomic condition of<br />
the area under assessment?<br />
• Gross domestic product.<br />
• Proportion of adults employed.<br />
• Household income.<br />
3: Prioritizing pedestrian <strong>safety</strong> interventions and preparing a plan of action<br />
In many settings, the minimum data components listed in Table 3.1 can be found<br />
in an official road traffic injury database that draws on police reports, and possibly<br />
other data sources. Data sources other than police statistics generally do not include<br />
information about crash location, crash type and vehicle involvement. Police data, on<br />
the other hand, may not include reliable information regarding injury severity. The<br />
questions posed in Table 3.1 should be answered using the best available data sources.<br />
In countries where there are no official national statistics on a given complementary<br />
data indicator, most recent estimates or projections by the national census or<br />
45
Prioritizing pedestrian <strong>safety</strong> interventions and preparing a plan of action<br />
statistical authority can be used. Gathering all the data proposed usually requires<br />
examination of multiple data sources.<br />
If there are no official road <strong>safety</strong> statistics, or if official statistics do not cover the<br />
minimum points fully or with adequate reliability, additional data collection such<br />
as a hospital-based study (see Box 3.1) or a road <strong>safety</strong> audit (see Box 3.2) may be<br />
considered. However, it is important to assess the costs of additional data collection<br />
and the value added by the information obtained.<br />
BOX 3.1: The Addis Ababa Hospital Injury Surveillance System<br />
Ethiopia is an African country that has made significant<br />
investment in improving its injury surveillance<br />
capacity. Initial work on injury surveillance started<br />
in 2000 with the support of WHO, followed by the<br />
government’s efforts to strengthen the Traffic Police<br />
Department’s road traffic injury data management<br />
capacity and to expand data collection nationally.<br />
The hospital injury surveillance system was<br />
established in 2000. It was implemented in all six<br />
government hospitals in the capital city, Addis Ababa.<br />
At the start of the project, detailed data on all injury<br />
cases were collected using a pre-defined data collection<br />
form. Data collection has since been integrated<br />
into the national health information system, and<br />
data on injury cases are collected and recorded as<br />
part of routine health statistics. The hospital injury<br />
surveillance system collects the following data for<br />
road traffic injury cases:<br />
• age and sex of injured people;<br />
• where the injury happened;<br />
• date and time of injury;<br />
• type of road user(s) involved;<br />
• types of vehicles colliding with pedestrians;<br />
• pre-hospital care received; and<br />
• injury severity.<br />
Traffic police data system strengthening efforts<br />
started in Addis Ababa in 2002. Previously the traffic<br />
police documented information about crashes using<br />
a paper data collection form. The information was<br />
then transferred to a log book for manual tabulation<br />
and reporting. The strengthening effort, supported by<br />
WHO, revised data collection and entry procedures<br />
so that data are collected in the field using a predesigned<br />
form and later entered into a computer<br />
database for further analysis. In later years the government<br />
expanded the system to six major regions in<br />
the country. The traffic police data system captures<br />
the following data for road traffic crashes:<br />
• site and location of collision;<br />
• vehicles/road users involved;<br />
• number of people injured or killed at the scene;<br />
• demographic data of casualties (for example,<br />
name, age, sex, occupation);<br />
• known factors contributing to the crash; and<br />
• whether pre-hospital care was provided.<br />
Data from these systems have been used by the<br />
national road <strong>safety</strong> council to identify high risk areas<br />
and to inform a policy development process around<br />
interventions for pedestrians and other road users,<br />
as well as other risk factors such distracted driving<br />
and access to care for victims of road traffic crashes.<br />
Source: 2,3.<br />
© Kidist Bartolomeos<br />
46
A road <strong>safety</strong> audit is a formal systematic road<br />
<strong>safety</strong> assessment or ‘checking’ of a road or a road<br />
scheme (4). The audit is generally conducted by an<br />
independent, multidisciplinary team. A pedestrian<br />
<strong>safety</strong> audit can be conducted as part of the broader<br />
road <strong>safety</strong> audit. It can also be conducted only for<br />
pedestrians. Whatever the scope, the essence of<br />
conducting a road <strong>safety</strong> or pedestrian <strong>safety</strong> audit<br />
is to examine the potential <strong>safety</strong> issues for any type<br />
of road, throughout the construction period, and on<br />
completed roads (5). A road <strong>safety</strong> audit seeks to<br />
ensure <strong>safety</strong> to all users, including pedestrians, by<br />
proactively and continuously identifying <strong>safety</strong> issues<br />
and making suggestions on measures and facilities<br />
to improve road <strong>safety</strong>.<br />
There is no standard method or approach for conducting<br />
pedestrian or road <strong>safety</strong> audits but the<br />
following questions are key for checking the <strong>safety</strong><br />
of vulnerable road users, including pedestrians, on<br />
new projects and existing roads (6):<br />
• Have the requirements of pedestrians and cyclists<br />
been considered?<br />
• Have the needs of public transport and its users<br />
been taken into consideration?<br />
• Are public transport stops planned at intersections?<br />
• Are stops easily accessible by pedestrians?<br />
• Are further crossing aids required to reach the<br />
public transport stops?<br />
• Are public transport stops easily recognizable?<br />
• Are special measures required for particular<br />
groups, e.g. for young people, older people, sick<br />
people, physically handicapped, hearing-impaired<br />
or blind people?<br />
• Is lighting required and, if so, is it appropriately<br />
designed?<br />
• Is sight obstructed, for example, by <strong>safety</strong> barriers,<br />
fences, road equipment, parking areas, traffic<br />
signs, landscaping, greenery, bridge abutments,<br />
buildings?<br />
• Is cyclist routing safely designed in the area near<br />
public transport stops?<br />
<strong>Pedestrian</strong> <strong>safety</strong>: a road <strong>safety</strong> manual for decision-makers and practitioners<br />
BOX 3.2: Assessing pedestrian risk using a road <strong>safety</strong> audit<br />
• Are vulnerable road users separated from motorized<br />
traffic?<br />
• Have pedestrian crossings been designated in<br />
such a way that collective use is guaranteed and<br />
pedestrians will not cross the road at other points?<br />
• Are crossings safe?<br />
• Are the pedestrian crossings located where they<br />
are most required by pedestrian traffic?<br />
• Is there a risk of pedestrian underpasses and<br />
bridges being bypassed?<br />
• Are crossings over special railway structures of a<br />
safe design?<br />
• Is two-way visual contact ensured between pedestrians<br />
and motorists?<br />
• Have cyclists’ requirements been considered (e.g.<br />
route across central refuges, bottlenecks)?<br />
• Is the transition safely designed if footpaths and<br />
cycle paths end on a road or are directed across<br />
the road?<br />
• Are further crossing aids required?<br />
• Are areas for pedestrians and cyclists sufficiently<br />
large and wide enough for them to stand and wait<br />
before crossing a street?<br />
• Are the islands clearly visible and of a suitable<br />
design?<br />
The following eight steps are generally followed in<br />
conducting a road <strong>safety</strong> audit (5):<br />
1. Identify a project or an existing road for road <strong>safety</strong><br />
audit.<br />
2. Select a multidisciplinary road <strong>safety</strong> audit team.<br />
3. Conduct a start-up meeting to exchange information.<br />
4. Perform field reviews under various conditions.<br />
5. Conduct a road <strong>safety</strong> analysis and prepare a<br />
report of findings.<br />
6. Present road <strong>safety</strong> audit findings to project owner<br />
or design team.<br />
7. Prepare a formal response.<br />
8. Incorporate findings into project when appropriate.<br />
3: Prioritizing pedestrian <strong>safety</strong> interventions and preparing a plan of action<br />
Continued…<br />
47
Prioritizing pedestrian <strong>safety</strong> interventions and preparing a plan of action<br />
Continued from previous page<br />
A recent assessment of pedestrian facilities of a 24-kilometre road in the state of Kerala in India revealed a<br />
glaring absence of pedestrian facilities in road design (7). The picture below shows the situation at one of the<br />
sites that were assessed.<br />
No footpaths<br />
Without footpaths<br />
it is more likely that<br />
pedestrians will walk on<br />
the road, especially when<br />
it is raining<br />
Parked cars<br />
‘Side friction’ means that<br />
pedestrians need to walk<br />
on the road to go around<br />
parked cars<br />
Street lights<br />
<strong>Pedestrian</strong>s are more<br />
visible at night with<br />
street lighting<br />
Skid resistance<br />
In an emergency, vehicles<br />
can stop faster on skidresistant<br />
roads<br />
© iRAP<br />
No crossing facilities<br />
<strong>Pedestrian</strong>s who need<br />
to cross the road<br />
have no choice but to<br />
share the space with<br />
motorized traffic<br />
Two lanes in each<br />
direction<br />
A pedestrian’s risk<br />
increases with each additional<br />
lane they must cross<br />
Narrow median<br />
<strong>Pedestrian</strong>s are offered<br />
some opportunity to cross<br />
the road in two stages<br />
when there is a median<br />
3.2.2 Assessing risk factors for pedestrian injury<br />
Several factors influence pedestrian traffic risk. In most cases it is impossible to<br />
identify and include every risk factor in the situational assessment. This section<br />
describes key questions about risk factors and suggested methods for obtaining<br />
answers to them. This process of assessment yields information on the role of roadway<br />
design, pedestrian facilities, speed, alcohol and visibility of pedestrians in the local<br />
travel environment. Further information on sources of data for analysing risk factors is<br />
available in Data systems: a road <strong>safety</strong> manual for decision-makers and practitioners (2).<br />
What are the available pedestrian facilities and general road transport infrastructure?<br />
The influence of various roadway design elements on pedestrian risk was described<br />
in Module 2. While the situational assessment may not be able to cover all of these<br />
elements, it should at least address the following points (8–10):<br />
• <strong>Road</strong>way design characteristics: For roads in the area under assessment, describe<br />
road classifications, design speeds, posted speed limits, and number and width of<br />
lanes. Describe the presence or lack of medians, traffic control devices, pedestrian<br />
crossings, kerb ramps, and pedestrian-directed signs and signals. Describe the<br />
presence or lack of streetlights, bicycle lanes, parked cars adjacent to the traffic<br />
lane, and other hazards to safe walking.<br />
48
<strong>Pedestrian</strong> <strong>safety</strong>: a road <strong>safety</strong> manual for decision-makers and practitioners<br />
• Sidewalks: Describe the presence and quality of sidewalks, including width, surface<br />
condition, separation from motorized traffic and accessibility as well as whether<br />
these are dedicated for pedestrians or shared, for instance, with cyclists or hawkers.<br />
• <strong>Pedestrian</strong> traffic-generating and attracting sites: Identify and map sites such<br />
as health facilities, parks, libraries, religious buildings, museums, educational<br />
institutions, community centres, residential areas, shops and resorts, that generate<br />
and attract pedestrian and other traffic.<br />
Data on pedestrian facilities and general road infrastructure may come from the<br />
following sources (8–10):<br />
• roadway or street inventories or road <strong>safety</strong> audits (see Box 3.2);<br />
• pedestrian facility inventories or audits;<br />
• road infrastructure audits and field reviews;<br />
• analysis of aerial photographs of streets; and<br />
• public feedback on conditions of roads or pedestrian facilities.<br />
Additional data collection, for example conducting a pedestrian <strong>safety</strong> audit, is advisable<br />
if none of these sources are available at the time of the situational assessment.<br />
© Eugenia Rodrigues<br />
3: Prioritizing pedestrian <strong>safety</strong> interventions and preparing a plan of action<br />
49
Prioritizing pedestrian <strong>safety</strong> interventions and preparing a plan of action<br />
What is the travel behaviour of pedestrians and other road users?<br />
The travel behaviour of pedestrians and other road users is useful in understanding<br />
local pedestrian traffic activity and associated risk. The situational assessment needs<br />
to establish (8):<br />
• the number of pedestrians in a given area, on specific streets or in key pedestrian<br />
zones;<br />
• pedestrian speeds;<br />
• pedestrian road-crossing behaviour, including running or hesitating;<br />
• pedestrian–motorist interaction, including pedestrian–vehicle conflicts;<br />
• profile of vehicle fleet;<br />
• vehicular traffic volumes and speeds, including assessment of compliance with<br />
speed limits;<br />
• alcohol involvement for both pedestrians and motorists (see Box 3.3); and<br />
• pedestrian use of clothes or materials to enhance visibility, especially at dawn, dusk<br />
and dark night-time hours.<br />
Information on pedestrian and other road user behaviour can be collected using the<br />
following methods (8,11):<br />
• pedestrian counts;<br />
• vehicle counts;<br />
• observational studies;<br />
• surveys, for example, on risk factor or knowledge, attitudes and perceptions;<br />
• speed cameras and speed measuring radar units; and<br />
• continuous video recording at intersections.<br />
BOX 3.3: Assessing the alcohol-relatedness of crashes<br />
Data on alcohol-involved (i.e. positive blood alcohol<br />
content (BAC)) or alcohol-impaired (i.e. BAC above a<br />
predetermined limit, e.g. 0.05 g/dl) vehicle–pedestrian<br />
crashes give an indication of the role of alcohol<br />
impairment in pedestrian traffic risk, though this<br />
information does not necessarily function as a proxy<br />
for impaired walking and driving in the general road<br />
user population. To address alcohol-related crashes,<br />
it is important to establish the locations where<br />
impaired driving and walking occur most frequently,<br />
the time of day and day of week when impaired driving<br />
and walking are most likely to occur, and the age, sex<br />
and socioeconomic status of impaired drivers and<br />
pedestrians. However, since in most jurisdictions<br />
testing for BAC has privacy and legal rights implications,<br />
routine monitoring is not always possible.<br />
The following methods may be used to gather information<br />
on alcohol and pedestrian traffic risk:<br />
• Review police statistics on alcohol-related vehicle–pedestrian<br />
crashes. Depending on the legal<br />
requirements for alcohol testing in the jurisdiction<br />
under consideration, data may be available only<br />
for fatal crashes or only for drivers.<br />
• Examine admission data from hospital emergency<br />
departments.<br />
• Review data from random breath-testing operations<br />
or sobriety checkpoints.<br />
• Conduct a roadside survey (self-reported<br />
behaviour).<br />
• Review research reports and papers on BAC<br />
analysis.<br />
Source: 12.<br />
50
<strong>Pedestrian</strong> <strong>safety</strong>: a road <strong>safety</strong> manual for decision-makers and practitioners<br />
What is the current enforcement of traffic regulations?<br />
A number of interventions that are known to reduce pedestrian injuries and deaths<br />
depend on effective enforcement of the traffic rules and regulations (see also<br />
Module 4). Driver violations include speeding, alcohol-impaired driving, mobile<br />
phone use while driving, and traffic signal violations (such as failing to stop at a<br />
red light). <strong>Pedestrian</strong> violations include crossing against the signal or outside of<br />
designated crossing points, alcohol impairment and distracted walking. Both driver<br />
and pedestrian compliance with traffic laws is critical to pedestrian <strong>safety</strong>, and<br />
effective law enforcement is a key aspect of ensuring compliance.<br />
A situational assessment should gather information on both traffic law compliance<br />
and traffic law enforcement. The assessment needs to gather information on:<br />
• pedestrian understanding and compliance with traffic control devices;<br />
• motorist behaviour at pedestrian crossings, for example, do they yield if required<br />
by law to do so?<br />
• motorist compliance with speed limits;<br />
• driver compliance with drink–driving laws; and<br />
• law enforcement methods and their effectiveness, for example, speed radars,<br />
random breath testing and/or sobriety checkpoints, ticketing, fines and licence<br />
suspension.<br />
Information on levels of enforcement and compliance of pedestrians, motorists<br />
and cyclists with traffic regulations (e.g. speeding, alcohol-impaired driving) can be<br />
gathered by the following methods:<br />
• Review police statistics on pedestrian <strong>safety</strong> regulation violations.<br />
• Review court records for violations of pedestrian <strong>safety</strong> regulations, noting the<br />
types and number of violations and fines or other punishments issued.<br />
• Review media reports and public complaints about enforcement and compliance<br />
with pedestrian <strong>safety</strong> regulations.<br />
• Review reports, studies and even conduct surveys or interviews to identify types of<br />
traffic law enforcement strategies in use in the setting under consideration.<br />
• Conduct observational studies and surveys on compliance with pedestrian <strong>safety</strong><br />
regulations.<br />
• Review existing studies on enforcement and compliance with pedestrian <strong>safety</strong><br />
regulations.<br />
3: Prioritizing pedestrian <strong>safety</strong> interventions and preparing a plan of action<br />
3.2.3 Assessing the policy environment and existing initiatives on<br />
pedestrian <strong>safety</strong><br />
The first two components of the situational assessment (Sections 3.2.1 and 3.2.2)<br />
provide information about the magnitude and patterns of pedestrian traffic<br />
injury in the area under assessment, as well as an understanding of the key risk<br />
factors involved. This information naturally leads to ideas for interventions. To<br />
avoid duplication of efforts and to maximize impact, it is important to take stock<br />
51
Prioritizing pedestrian <strong>safety</strong> interventions and preparing a plan of action<br />
of existing policies and programmes, roles of stakeholders, and the wider policy<br />
environment before prioritizing interventions and creating a plan of action.<br />
The main methods to obtain the relevant information include (2,13):<br />
• Review government policy documents in the areas of transport and road <strong>safety</strong>.<br />
• Conduct interviews with representatives of agencies affected by or committed to<br />
pedestrian <strong>safety</strong>.<br />
• Conduct interviews with members of communities where pedestrian <strong>safety</strong><br />
interventions have been implemented or where pedestrian injuries are most<br />
frequent. Include drivers, cyclists and pedestrians in these interviews.<br />
• Conduct a stakeholder analysis.<br />
• Review research reports and papers assessing pedestrian <strong>safety</strong> in the setting under<br />
consideration.<br />
• Investigate pedestrian crashes at the scene of the crash, as resources permit.<br />
Leadership and stakeholder engagement<br />
The following issues should be examined to identify the focus areas, interests,<br />
resources and relationships of various stakeholders, and their current and potential<br />
roles in pedestrian <strong>safety</strong> (2):<br />
• Government leadership: Is there a lead agency responsible for road <strong>safety</strong>? What<br />
is it and what is its main function? Does its mandate include a clear focus on<br />
pedestrian <strong>safety</strong>?<br />
• Government stakeholders: What government agencies have a road <strong>safety</strong> function,<br />
including broad activities in road design and land-use planning? Do any of these<br />
agencies have a specific pedestrian <strong>safety</strong> focus? How is responsibility for road<br />
<strong>safety</strong> shared among government ministries? What is the relationship between the<br />
various government agencies involved in road <strong>safety</strong> and health?<br />
• Nongovernmental stakeholders: What other people or institutions<br />
(nongovernmental) are working on pedestrian <strong>safety</strong>? What are their main<br />
activities? What is the nature of the collaboration between these stakeholders and<br />
government agencies?<br />
• <strong>Partnership</strong>s: What are the foci, interests and resources of different agencies and<br />
individuals working on pedestrian <strong>safety</strong>?<br />
Existing plans, policies and programmes<br />
It may not be possible to identify every pedestrian <strong>safety</strong> programme currently being<br />
implemented in the jurisdiction, but it is important to identify the major initiatives.<br />
The following questions can help to clarify the situation:<br />
• Is there an official pedestrian <strong>safety</strong> plan of action or strategy for the jurisdiction<br />
under assessment, or are there multiple plans? What resources are dedicated to the<br />
implementation of this plan?<br />
• Do the transport, land-use and public space policies promote safe walking?<br />
52
<strong>Pedestrian</strong> <strong>safety</strong>: a road <strong>safety</strong> manual for decision-makers and practitioners<br />
• Do road <strong>safety</strong> audits of major new road infrastructure projects include<br />
pedestrian needs and ensure that pedestrian <strong>safety</strong> measures are taken into<br />
account? Do road <strong>safety</strong> audits of existing road infrastructure and planned repairs/<br />
modifications include pedestrian needs and ensure that pedestrian <strong>safety</strong> measures<br />
are taken into account?<br />
• Does the transport and/or road <strong>safety</strong> budget have dedicated segments for<br />
pedestrian <strong>safety</strong>?<br />
• Are the local authorities allowed to modify laws such as speed limits or drink–<br />
driving laws, which give additional protection to pedestrians, e.g. reducing speed<br />
limits around schools?<br />
• What pedestrian <strong>safety</strong> programmes are currently implemented, including those<br />
conducted by nongovernmental organizations? What agency is responsible for<br />
each programme, and what are its strengths and weaknesses?<br />
• Are existing pedestrian <strong>safety</strong> programmes evaluated? Is there evidence of impact?<br />
• Do local and national government agencies have sufficient human capacity to<br />
implement pedestrian <strong>safety</strong> programmes?<br />
The information described in this section assists with the identification of gaps in<br />
policy, programming and decision-making about action needed to move pedestrian<br />
<strong>safety</strong> policy forward. For example, is there a need for a new initiative or can existing<br />
initiatives be strengthened? What strategies can maximize available resources<br />
and reduce duplication of effort? The stakeholder analysis provides information<br />
regarding the roles of key people and institutions currently involved in pedestrian<br />
<strong>safety</strong>. This information is valuable for identifying which agencies must be involved,<br />
could be involved, and which may resist action for pedestrian <strong>safety</strong>. It can also help<br />
with identification of possibilities to combine resources, as well as potential conflicts<br />
of interest and ways to minimize them.<br />
3: Prioritizing pedestrian <strong>safety</strong> interventions and preparing a plan of action<br />
3.3 Preparing a pedestrian <strong>safety</strong> action plan<br />
The situational assessment described in section 3.2 provides an understanding of<br />
the local pedestrian <strong>safety</strong> situation – the extent and pattern of pedestrian traffic<br />
injuries, relevant risk factors, and the people, institutions, policies, programmes and<br />
resources that are currently (or could be) involved in pedestrian <strong>safety</strong> initiatives.<br />
The information helps prioritize risk factors and target groups, and to identify<br />
gaps in existing initiatives. The next step in improving pedestrian <strong>safety</strong> is to use<br />
this information, alongside the information on effective interventions presented in<br />
Section 4.1 of Module 4, to create a plan of action.<br />
A plan of action sets out a strategy for improving pedestrian <strong>safety</strong> in the setting<br />
under consideration. It provides a framework to organize interventions in a<br />
strategic manner that minimizes duplication of work and facilitates evaluation<br />
53
Prioritizing pedestrian <strong>safety</strong> interventions and preparing a plan of action<br />
of progress over time. It may be part of a broader road <strong>safety</strong> plan or it may stand<br />
alone. It may focus on different geographical units, ranging from a specific street,<br />
to a neighbourhood, to a district or be countrywide. The plan may be developed to<br />
strengthen existing pedestrian <strong>safety</strong> initiatives or to create something new. Whatever<br />
the nature and focus of the plan, it should be tailored to the specific problems and<br />
needs of the local setting (8).<br />
Once the focus of the plan is agreed, planned actions need to be prioritized in a way<br />
that is both systematic and locally relevant. The data gathered through the situational<br />
assessment, together with information on the effectiveness of various interventions<br />
(see Module 4), provides the evidence to inform the prioritization process. Relevant<br />
considerations include what risk factors or issues to address, public support, funding,<br />
<strong>safety</strong> benefits and responsible agency (8). In addition to strategies to influence the<br />
key risk factors and address gaps in programming, the plan might include strategies<br />
to address gaps in data needed to measure the burden of pedestrian traffic injury and<br />
evaluate the impact of interventions.<br />
3.3.1 Mobilizing stakeholders<br />
The preparation and subsequent implementation of a pedestrian <strong>safety</strong> plan<br />
requires input and support from a variety of stakeholders. The stakeholder and<br />
institutional analysis indicated in Section 3.2 should help with identification of the<br />
lead agency responsible for road <strong>safety</strong> in the setting under consideration. Ideally,<br />
this agency should convene a working group and coordinate the development<br />
of the pedestrian <strong>safety</strong> plan. If there is no lead agency, a multisectoral working<br />
group or committee on pedestrian <strong>safety</strong> can be established to coordinate the<br />
preparation and implementation of the action plan. If road <strong>safety</strong> working groups<br />
or committees already exist, advocacy work may be required to ensure a specific<br />
pedestrian <strong>safety</strong> focus.<br />
“Stakeholder involvement is an essential element in creating publicly<br />
supported and trusted policies, programmes, and projects that reduce<br />
pedestrian crashes while creating liveable, walkable communities” (8).<br />
Who should be involved in the working group?<br />
<strong>Pedestrian</strong> fatalities and injuries, as shown in Modules 1 and 2, have multiple<br />
determinants, affect diverse people, and require action by several sectors. The<br />
working group should consist of representatives from government and other agencies<br />
that have a common interest in improving pedestrian <strong>safety</strong>. These may include<br />
agencies or people that have political and economic interests in the issue, not just<br />
54
<strong>Pedestrian</strong> <strong>safety</strong>: a road <strong>safety</strong> manual for decision-makers and practitioners<br />
those that have administrative responsibility for <strong>safety</strong>. The working group should<br />
also include members who are not convinced about the importance or desirability of<br />
safe walking and pedestrian <strong>safety</strong> measures. The goal is to create a diverse group that<br />
draws on varying – even opposing – perspectives and strengths. Composition of the<br />
working group may vary depending on whether the plan will be set at the national,<br />
provincial or municipal level.<br />
The key stakeholders identified in the situational assessment should constitute a<br />
core working group. Working groups function best when they are smaller, but it is<br />
also important to develop a mechanism to facilitate involvement of as wide a group<br />
of stakeholders as possible, even if it is just for information sharing. High-level<br />
political commitment from the government facilitates successful implementation<br />
of the planned activities and high-level government representation may thus be<br />
important for the working group. Government ownership of the action plan creates<br />
opportunities for implementation and sustainability.<br />
What should the working group do?<br />
The working group should define its duties early in the process, in order to increase<br />
the effectiveness of its operations. Basic issues the group will address as soon as it is<br />
created include identifying a coordinator, defining an operational framework for the<br />
group, creating a management committee and specific sub-groups as necessary, and<br />
assigning responsibilities to members.<br />
The critical strategic duties of the working group include the following (8):<br />
• Setting the goals and objectives of the pedestrian action plan.<br />
• Examining data or information available and prioritizing concerns.<br />
• Coordinating the development and possibly implementation of the<br />
pedestrian <strong>safety</strong> action plan. In some cases the working group may be tasked<br />
with development of the action plan but not responsibility to oversee its<br />
implementation. In other cases the working group may be assigned responsibility<br />
to oversee both the development and implementation of the action plan.<br />
• Mobilizing support and resources for the pedestrian <strong>safety</strong> action plan. The working<br />
group should design strategies for raising funds and garnering financial and human<br />
resources to provide some working capital to undertake planned activities.<br />
• Coordinating and integrating the action plan into government road <strong>safety</strong>,<br />
transport and/or urban development programmes at the national and local levels.<br />
A pedestrian <strong>safety</strong> initiative has jurisdictional, resource and infrastructural issues<br />
that require involvement of government.<br />
• Defining performance measures and targets for implementation.<br />
3: Prioritizing pedestrian <strong>safety</strong> interventions and preparing a plan of action<br />
55
Prioritizing pedestrian <strong>safety</strong> interventions and preparing a plan of action<br />
3.3.2 Core components of an action plan<br />
Strong plans of action have several components in common:<br />
A well-defined problem<br />
The main purpose of the situational assessment is to provide a comprehensive picture<br />
of the local pedestrian traffic injury situation. Without this assessment, the plan of<br />
action may not be focused on the most important issues and solutions.<br />
Clear objectives<br />
The action plan may be comprehensive, addressing a wide range of risk factors, or<br />
it may start with a more focused approach, covering a few very specific objectives.<br />
The experience of cities such as Curitiba, Brazil, and Copenhagen, Denmark, shows<br />
that even action plans with only a few goals, such as creating a pedestrian street<br />
or implementing speed control measures on a busy street, can yield significant<br />
results (14). Plans can be expanded over time to include other issues if resources and<br />
political commitment permit.<br />
General principles to consider in defining objectives include:<br />
• Objectives should be clear and specify a measurable outcome in a defined time<br />
period. Keep the objectives SMART: specific, measurable, achievable, relevant and<br />
time-bound.<br />
• Objectives should be evidence-informed, deriving from the situational assessment<br />
as well as available literature.<br />
• Objectives should include pedestrian fatality and injury reductions and also<br />
reductions in other risks that may result from improving conditions for walking.<br />
Changing attitudes of the public towards the rights of pedestrians and the need<br />
to protect their <strong>safety</strong>, and incorporating pedestrian <strong>safety</strong> into decision-making<br />
processes should also be considered.<br />
• Both short-term and medium- to long-term objectives are desirable.<br />
Realistic targets<br />
Targets specify the improvements expected within a certain time period, and<br />
setting targets has been shown to strengthen commitment to improve road<br />
<strong>safety</strong> (15). Targets provide a benchmark to monitor ongoing progress in achieving<br />
objectives. They enable better use of resources and better management of road <strong>safety</strong><br />
programmes by providing an opportunity to adjust activities along the way and<br />
therefore increase the likelihood of achieving specified objectives (15,16).<br />
Targets can be set based on the objectives of the plan and/or the historical experience<br />
of results achieved during the implementation of pedestrian <strong>safety</strong> measures. General<br />
principles to consider in setting targets include the following:<br />
• Set specific and realistic targets.<br />
• Set quantified targets as much as possible.<br />
56
<strong>Pedestrian</strong> <strong>safety</strong>: a road <strong>safety</strong> manual for decision-makers and practitioners<br />
• Targets should be set in consultation with government agencies responsible for<br />
taking action on pedestrian <strong>safety</strong>.<br />
• Baseline measures for targets should be indicated and/or collected.<br />
Ambitious targets may sometimes be appropriate, for example, to raise public<br />
awareness of the road <strong>safety</strong> problem in order to increase pressure on stakeholders to<br />
strengthen their efforts (16).<br />
Performance indicators<br />
Performance indicators are used to measure progress towards the objectives. They<br />
indicate changes and improvements in the baseline conditions being addressed, for<br />
example, the number of pedestrian fatalities and injuries or the amount of funding<br />
allocated to pedestrian <strong>safety</strong>. Performance indicators help to define key activities,<br />
deliverables and outcomes for the action plan. Each performance indicator should<br />
have specific targets, either quantitative or qualitative.<br />
A realistic timeline and milestones<br />
A plan of action needs to indicate the timeline for executing different activities<br />
and milestones that can be used to measure progress. Some flexibility is required,<br />
however, to adjust the timeline as needed to accommodate changes that may occur<br />
during implementation.<br />
Adequate resources<br />
Successful implementation of the action plan depends on adequate resource<br />
allocation. The plan should identify and when possible allocate funding for each<br />
component. Resources may come from reallocation of existing funds or mobilization<br />
of new funds at the local, national and/or international levels.<br />
3: Prioritizing pedestrian <strong>safety</strong> interventions and preparing a plan of action<br />
A monitoring and evaluation system<br />
Continuous assessment of progress requires definition of a monitoring and<br />
evaluation system that incorporates the performance indicators and targets. The plan<br />
should specify data collection and analysis methods, dissemination channels, and a<br />
framework for utilization of the results to adjust pedestrian <strong>safety</strong> activities.<br />
Sustainability<br />
In addition to considering immediate resource allocation priorities, the plan will<br />
be most effective if it includes mechanisms to ensure adequate funding levels<br />
on an ongoing basis. Public demand for pedestrian <strong>safety</strong> can put pressure on<br />
politicians and government officials to demonstrate long-term political and financial<br />
commitment, which can in turn strengthen the sustainability of the action plan. The<br />
plan might therefore include some indicators to gauge public demand for pedestrian<br />
<strong>safety</strong> and government response.<br />
An example of a pedestrian <strong>safety</strong> plan of action is presented in Box 3.4.<br />
57
Prioritizing pedestrian <strong>safety</strong> interventions and preparing a plan of action<br />
BOX 3.4: <strong>Pedestrian</strong> <strong>safety</strong> plan, Montgomery County, Maryland, USA<br />
In 2007, the Montgomery County City Council prepared<br />
a pedestrian <strong>safety</strong> strategic plan to address<br />
the problem of pedestrian fatalities and injuries:<br />
14 pedestrian deaths and 430 collisions involving<br />
pedestrians per year in the period 2003–2006 (17).<br />
The objectives of the plan were to reduce pedestrian-related<br />
crashes, injuries, fatalities, and their<br />
associated social and economic costs; and to<br />
ensure that all areas of the county provide safe and<br />
convenient travel options for pedestrians.<br />
The plan focused on seven strategic areas: improving<br />
pedestrian <strong>safety</strong> in high incidence areas;<br />
assessing and improving pedestrian network<br />
and connectivity needs; increasing emphasis on<br />
pedestrians and cyclists in the planning process;<br />
identifying and implementing intersection modifications<br />
and traffic calming treatments; upgrading<br />
pedestrian signals; assessing and enhancing<br />
street lighting; and modifying pedestrian and driver<br />
behaviour through enhanced enforcement and educational<br />
efforts (17). The plan included a budget,<br />
showing the amount of funding required, the source<br />
and whether the funds which existed were one-time<br />
or recurring funds.<br />
The plan defined several performance indicators:<br />
• Reduce pedestrian collisions in each of the targeted<br />
high incidence areas by 20% following<br />
completion of improvements.<br />
• Reduce average traffic travel speeds in targeted<br />
high incidence areas.<br />
• Increase perception of pedestrian <strong>safety</strong> and<br />
‘walkability’ in targeted high incidence areas using<br />
an annual county survey of residents and visitors<br />
to assess results.<br />
• Increase the annual sidewalk construction effort<br />
to 17 kilometres of new sidewalks each year.<br />
• Complete ‘Safe Routes to Schools’ improvements<br />
at 29 schools per year, completing the remainder<br />
of county schools in a six-year timeframe.<br />
• Review and update pedestrian signal timings at a<br />
rate of 250 per year for three years.<br />
• Upgrade all county-owned traffic signals to current<br />
accessible pedestrian signal standards, adding<br />
pedestrian countdown features, at a rate of five<br />
per year.<br />
• Complete improvements to 13 identified lighting<br />
projects within six years.<br />
3.4 Summary<br />
The content of this module is summarized as follows:<br />
• A comprehensive understanding of the local pedestrian <strong>safety</strong> situation is essential<br />
to effective action.<br />
• The situational assessment should cover the magnitude and nature of pedestrian<br />
traffic injuries, the key risk factors, stakeholders in pedestrian <strong>safety</strong>, existing<br />
programmes and the current policy environment.<br />
• Development of an action plan for pedestrian <strong>safety</strong> requires collaboration across a<br />
wide range of stakeholders and different levels of government.<br />
• Core components of the action plan include a well-defined problem, clear<br />
objectives, realistic targets, performance indicators, timeline and milestones,<br />
adequate resources, monitoring and evaluation, and sustainability options.<br />
58
References<br />
<strong>Pedestrian</strong> <strong>safety</strong>: a road <strong>safety</strong> manual for decision-makers and practitioners<br />
1. Rumar K. Past, present and future road <strong>safety</strong> work in ECMT. Brussels, European Conference of Ministers of<br />
Transport, 2002.<br />
2. Data systems: a road <strong>safety</strong> manual for decision-makers and practitioners. Geneva, World Health Organization,<br />
2010.<br />
3. Kebede T, et al. Injury surveillance in six hospitals of Addis Ababa, Ethiopia. Ethiopian Medical Journal,<br />
2008, 46: 383–390.<br />
4. <strong>Road</strong> <strong>safety</strong> audit for road projects: an operational kit. Manila, Asian Development Bank, 2003.<br />
5. Nabors D, et al. <strong>Pedestrian</strong> road <strong>safety</strong> audit guidelines and prompt lists. Washington, DC, Federal Highway<br />
Administration, 2007 (FHWA-SA-07–007).<br />
6. <strong>Road</strong> <strong>safety</strong> audit guideline for <strong>safety</strong> checks of new road projects. Paris, World <strong>Road</strong> Association, 2011.<br />
7. iRAP India phase 2: road <strong>safety</strong> summary report and design analysis: Kerala State Transport Project: Kasaragod<br />
to Kanjanghad. London, International <strong>Road</strong> Assessment Programme, 2012.<br />
8. Zegeer CV, Sandt L, Scully M. How to develop a pedestrian <strong>safety</strong> action plan. Washington, Federal Highway<br />
Administration, 2009 (FHWA-SA-05–12).<br />
9. Litman T, et al. <strong>Pedestrian</strong> and bicycle planning: a guide to best practices. Victoria, British Columbia, Victoria<br />
Transport Policy Institute, 2012.<br />
10. International benchmarking to make walking count. Walk21, 2009 [website] (http://www.measuring-walking.<br />
org, accessed 31 December 2012).<br />
11. Tiwari G, et al. Survival analysis: pedestrian risk exposure at signalized intersections. Transportation Research<br />
Part F, 2007, 10: 77–89.<br />
12. Drinking and driving: a road <strong>safety</strong> manual for decision-makers and practitioners. Geneva, <strong>Global</strong> <strong>Road</strong> <strong>Safety</strong><br />
<strong>Partnership</strong>, 2007.<br />
13. Belin M-A. Public road <strong>safety</strong> policy change and its implementation: Vision Zero a road <strong>safety</strong> policy innovation<br />
[unpublished thesis]. Stockholm, Karolinska Institutet, 2012.<br />
14. Khayesi M, Amekudzi A. Kingdon’s multiple streams model and automobile dependence reversal path: the<br />
case of Curitiba, Brazil. Journal of Transport Geography, 2011, 19: 1547–1552.<br />
15. Elvik R, et al. The handbook of road <strong>safety</strong> measures, 2nd ed. Bingley, Emerald Group Publishing Limited, 2009.<br />
16. Belin MA. Theory and practice in Sweden: a case study of setting quantified road <strong>safety</strong> targets. Health and<br />
Medical Informatics, 2010, 1: 1–5.<br />
17. <strong>Pedestrian</strong> <strong>safety</strong> initiative. Montgomery County, Maryland, USA, 2007.<br />
3: Prioritizing pedestrian <strong>safety</strong> interventions and preparing a plan of action<br />
59
60<br />
Prioritizing pedestrian <strong>safety</strong> interventions and preparing a plan of action
4<br />
Implementing pedestrian<br />
<strong>safety</strong> interventions
4<br />
4.1 An overview of effective pedestrian <strong>safety</strong> interventions....63<br />
Implementing pedestrian<br />
<strong>safety</strong> interventions<br />
4.2 Implementing pedestrian <strong>safety</strong> interventions. ............ 70<br />
4.2.1 Reducing pedestrian exposure to vehicular traffic ............... 70<br />
4.2.2 Reducing vehicle speeds................................... 75<br />
4.2.3 Improving the visibility of pedestrians ........................ 78<br />
4.2.4 Improving pedestrian and motorist <strong>safety</strong> awareness and behaviour. . 79<br />
4.2.5 Improving vehicle design for pedestrian protection .............. 83<br />
4.2.6 Providing care for injured pedestrians ........................ 85<br />
4.3 Summary............................................... 90<br />
References ................................................. 90
<strong>Pedestrian</strong> <strong>safety</strong>: a road <strong>safety</strong> manual for decision-makers and practitioners<br />
Module 3 provided guidance on conducting a situational assessment and<br />
preparing an action plan for pedestrian <strong>safety</strong>. This module discusses various<br />
pedestrian <strong>safety</strong> measures and key issues to consider regarding their implementation.<br />
The module is divided into two sections:<br />
4.1 An overview of effective pedestrian <strong>safety</strong> interventions: This section provides<br />
a summary of key interventions that can be implemented to improve pedestrian<br />
<strong>safety</strong>, and provides principles to guide decision-making regarding the optimal choice<br />
of interventions.<br />
4.2 Implementing effective pedestrian <strong>safety</strong> interventions: This section<br />
provides details on specific pedestrian <strong>safety</strong> interventions and examples of their<br />
implementation.<br />
4: Implementing pedestrian <strong>safety</strong> interventions<br />
4.1 An overview of effective pedestrian <strong>safety</strong> interventions<br />
Institutions and people working in pedestrian <strong>safety</strong> may tend to favour either<br />
engineering measures or behaviour-change measures, depending on their training<br />
and experience, but significant improvement to pedestrian <strong>safety</strong> requires a balanced<br />
approach that includes both perspectives (1).<br />
“Many pedestrian <strong>safety</strong> problems cannot be solved simply by addressing<br />
one of the 'three Es' (engineering, education, enforcement) in isolation.<br />
Engineers, law enforcement, designers, planners, educators, and citizens<br />
should all play a role in identifying and implementing effective countermeasures<br />
for improving pedestrian <strong>safety</strong>” (2).<br />
Several engineering and behavioural interventions have been evaluated and found to<br />
be effective in improving pedestrian <strong>safety</strong>. A summary of the key pedestrian <strong>safety</strong><br />
measures is presented in Table 4.1. Each broad category of measures is associated<br />
with a number of specific interventions. While some interventions have been found<br />
to be effective in multiple settings, others have insufficient evidence regarding their<br />
effectiveness.<br />
Effectiveness of the measures is assessed by reduction of fatalities and injuries, as well<br />
as changes in behaviour, attitudes and knowledge. Table 4.1 categorizes pedestrian<br />
<strong>safety</strong> strategies as follows:<br />
• Proven: Evidence from robust studies such as randomized controlled trials,<br />
systematic reviews or case–control studies show that these interventions are<br />
63
Implementing pedestrian <strong>safety</strong> interventions<br />
effective in reducing pedestrian fatalities and injuries, or in bringing about desired<br />
behaviour change.<br />
• Promising: Evidence from robust studies show that some pedestrian <strong>safety</strong><br />
benefits have resulted from these interventions, but further evaluation from<br />
diverse settings is required and caution is thus needed when implementing these<br />
interventions.<br />
• Insufficient evidence: Evaluation of an intervention has not reached a firm<br />
conclusion about its effectiveness (2).<br />
Table 4.1<br />
Focal measures and specific interventions for improving<br />
pedestrian <strong>safety</strong><br />
Key measures Examples of interventions Effectiveness<br />
Proven Promising Insufficient<br />
evidence<br />
Reduce Provide sidewalks<br />
pedestrian<br />
Install and/or upgrade traffic and<br />
exposure to<br />
pedestrian signals<br />
vehicular traffic<br />
Construct pedestrian refuge islands and<br />
raised medians<br />
Construct enhanced marked crossings<br />
Provide vehicle restriction/diversion<br />
measures<br />
Install overpasses/underpasses<br />
Improve mass transit route design<br />
Reduce traffic volumes by switching<br />
journeys from the car to public transport,<br />
walk and cycle for distances and<br />
purposes where these options work well<br />
Reduce vehicle Reduce speed limit<br />
speeds<br />
Implement area-wide lower speed limit<br />
programmes, for example, 30 km/h<br />
Implement road-narrowing measures<br />
Install speed management measures at<br />
road sections<br />
Install speed management measures at<br />
intersections<br />
Provide school route improvements<br />
Improve sight<br />
distance<br />
and/or visibility<br />
between motor<br />
vehicles and<br />
pedestrians<br />
Provide crossing enhancements<br />
Implement lighting/crossing illumination<br />
measures<br />
Reduce or eliminate obstruction by<br />
physical objects including parked<br />
vehicles<br />
Install signals to alert motorists that<br />
pedestrians are crossing<br />
Improve visibility of pedestrians<br />
64
<strong>Pedestrian</strong> <strong>safety</strong>: a road <strong>safety</strong> manual for decision-makers and practitioners<br />
Key measures Examples of interventions Effectiveness<br />
Improve<br />
pedestrian and<br />
motorist <strong>safety</strong><br />
awareness and<br />
behaviour<br />
Improve<br />
vehicle design<br />
for pedestrian<br />
protection<br />
Improve<br />
vehicle design<br />
for pedestrian<br />
protection<br />
Improve care<br />
for the injured<br />
pedestrians<br />
Provide education, outreach and training<br />
Develop and/or enforce traffic laws on<br />
speed, drinking and driving, pedestrian<br />
right-of-way, red light disobedience,<br />
commercial roadside activity and traffic<br />
control<br />
Implement ‘walking school bus’<br />
programmes<br />
Develop vehicle <strong>safety</strong> standards and<br />
laws for pedestrian protection<br />
Enforce vehicle <strong>safety</strong> standards and<br />
laws for pedestrian protection<br />
Publicize consumer information on<br />
pedestrian <strong>safety</strong> by make and model<br />
of car, for example, results of New Car<br />
Assessment Programmes<br />
Organize pre-hospital trauma care<br />
systems<br />
Establish inclusive trauma care systems<br />
Offer early rehabilitation services<br />
Proven Promising Insufficient<br />
evidence<br />
4: Implementing pedestrian <strong>safety</strong> interventions<br />
Note: When the terms ‘proven’, ‘promising’ and ‘insufficient evidence’ appear highlighted in the same line, it shows that<br />
there are different measures in the same broad category at different stages of development as already explained above<br />
with respect to effectiveness.<br />
Source: 1–7.<br />
There are several important principles practitioners and decision-makers should be<br />
guided by when choosing which pedestrian <strong>safety</strong> measure(s) to implement:<br />
Conduct a situational assessment and utilize the results<br />
The findings of the situational assessment should inform the selection and<br />
prioritization of interventions to address the pedestrian <strong>safety</strong> problem in a given<br />
setting. Other considerations for intervention selection include cost, effectiveness,<br />
feasibility and acceptability.<br />
A holistic and multifaceted approach is preferable to a narrow focus<br />
A combination of the measures presented in Table 4.1 will be more effective<br />
than implementing a single strategy. Cost and feasibility should not be the only<br />
considerations when choosing interventions. Strategies that may be easier to<br />
implement may have a smaller impact. For example, installation of pedestrian<br />
warning signs may increase pedestrian awareness and reduce some risk, but a more<br />
65
Implementing pedestrian <strong>safety</strong> interventions<br />
effective approach would be substantial infrastructure changes such as the provision<br />
of sidewalks and speed management strategies. Engineering-related measures may be<br />
more expensive and may raise more resistance than behaviour change strategies, but<br />
these types of measures are essential to a balanced Safe System approach.<br />
Changes in behaviour can also be achieved through land-use planning<br />
and road design strategies, not only through the 'traditional' approaches<br />
of enforcement and education.<br />
Few jurisdictions in any country have adequate resources and/or political will<br />
to implement all, or even most, of the pedestrian <strong>safety</strong> measures presented in<br />
Table 4.1. A jurisdiction may choose to begin with a single strategy or measure while<br />
mobilizing resources and political will to implement complementary measures. This<br />
is not problematic as long as the responsible agency and/or the action plan take a<br />
broader and long-term view that incorporates other measures.<br />
Integrate pedestrian <strong>safety</strong> as an essential feature of roadway design and landuse<br />
planning<br />
A Safe Systems approach to pedestrian <strong>safety</strong> prevents the development of risky<br />
roadway environments rather than relying exclusively on interventions to reduce risk<br />
in the existing built environment (see Module 1). When decision-makers, engineers<br />
and planners routinely consider pedestrian <strong>safety</strong> as part of roadway design and landuse<br />
planning, pedestrian <strong>safety</strong> is built into the transport system.<br />
Many strategies that benefit pedestrian <strong>safety</strong> have been found to benefit other road<br />
users as well. Examples include (4,5):<br />
• Raised medians on multi-lane roads reduce pedestrian crashes and also head-on<br />
vehicle collisions.<br />
• Changing four- and five-lane to three-lane roads reduces pedestrian crashes and<br />
total roadway crashes.<br />
• Paved shoulders can reduce ‘walking along the road’ pedestrian crashes, as well as<br />
‘run-off-road’ and fixed object crashes involving motor vehicles.<br />
• Providing separate phasing at signalized intersections for left-turning vehicles 2<br />
reduces left-turn vehicle crashes involving pedestrians, and left-turn crashes<br />
involving vehicles going straight.<br />
2<br />
Applies where vehicles drive on the right side of the road. Where vehicles drive on the left, this applies to rightturning<br />
vehicles.<br />
66
<strong>Pedestrian</strong> <strong>safety</strong>: a road <strong>safety</strong> manual for decision-makers and practitioners<br />
Consider the distinct needs of various types of pedestrians<br />
<strong>Pedestrian</strong>s are a group with diverse characteristics, capabilities and needs. The specific<br />
needs of children, elderly people and people with disabilities should be considered<br />
and prioritized when designing pedestrian <strong>safety</strong> measures (see Box 4.1). More<br />
information on children and people with disabilities is provided later in this module.<br />
BOX 4.1: Considering older people in pedestrian <strong>safety</strong> measures<br />
Age is related to a variety of characteristics and skills<br />
that influence the risk of pedestrian traffic injury.<br />
These age-related characteristics can also affect the<br />
way in which people of different ages interact with<br />
pedestrian <strong>safety</strong> measures and therefore require<br />
unique attention when planning interventions.<br />
Several factors work together to increase the risk of<br />
older pedestrians:<br />
• Deterioration in visual acuity may have a negative<br />
impact on their ability to cross the road safely. In<br />
general, older pedestrians look less at traffic and<br />
accept significantly smaller gaps in traffic when<br />
crossing the road than younger pedestrians (8).<br />
• Reduced mobility can render older pedestrians<br />
unable to react quickly in imminent danger to avoid<br />
a crash.<br />
• Underlying health conditions or frailty can result in<br />
greater injury severity when a crash occurs.<br />
• Reduced speed when crossing the road. The<br />
speed of elderly pedestrians does not itself<br />
increase risk; the risk comes from the speed of<br />
the traffic and, in particular, from automated signals<br />
that do not allow sufficient time for slower<br />
pedestrians to cross safely. In many municipalities<br />
the assumed walking speed used to set crossing<br />
times at signalized crossings is faster than an<br />
older person can walk, leaving them stranded on<br />
the road when the signal phase changes to allow<br />
vehicle movement (8).<br />
• Install high-visibility crossings and advance stop<br />
bars.<br />
• Repair broken kerbs and pedestrian ramps.<br />
• Replace missing and/or upgrade existing signs.<br />
• Install pedestrian refuge islands or, preferably,<br />
raised medians.<br />
• Narrow roadways with traffic-calming techniques.<br />
• Raise public awareness about the <strong>safety</strong> needs of<br />
elderly pedestrians.<br />
• Reduce legal speed limits.<br />
• Strengthen enforcement of laws on speed limits,<br />
and drink–driving.<br />
4: Implementing pedestrian <strong>safety</strong> interventions<br />
The following measures can be implemented to<br />
improve the <strong>safety</strong> of elderly pedestrians:<br />
• Increase the time allocated to pedestrians at signalized<br />
pedestrian crossings.<br />
© Rimma Kuznetsova<br />
67
Implementing pedestrian <strong>safety</strong> interventions<br />
Even measures designed to protect pedestrians can have unintended negative<br />
impacts and cause harm to pedestrians if they are poorly implemented. For example,<br />
transforming a marked, non-signalized crossing into a signalized one might seem<br />
positive for pedestrian <strong>safety</strong> but if the crossing time is too short it can increase<br />
pedestrian risk, with pedestrians caught on the crossing when vehicles are signalled<br />
to move. Short crossing times put slower-moving pedestrians at risk (8).<br />
Adapt proven measures to local conditions<br />
Each local context has its unique political, cultural, financial and road conditions.<br />
Measures from high-income countries cannot be simply transferred to low- and<br />
middle-income countries, without due consideration of the local context (see also<br />
Module 3). Not all of the strategies listed in Table 4.1 are appropriate or necessary<br />
for every site; the package of interventions must be tailored to best fit specific site<br />
conditions, including traffic speed and volume, number of travel lanes, presence<br />
of signs, volume and characteristics of pedestrians (e.g. school children, seniors,<br />
pedestrians with disabilities), location type (downtown, suburban or rural), type<br />
of land use, and other relevant physical and location factors. Module 3 provides<br />
methods for assessing local factors for the purpose of choosing and adapting<br />
interventions.<br />
Implement the measures over time<br />
It takes a sustained effort over a period of time to improve pedestrian <strong>safety</strong><br />
(see Box 4.2). A city or a region may begin with a few measures at the highest<br />
risk locations, and over time increase the geographic coverage and number of<br />
interventions implemented.<br />
Provide supportive policies and guidelines<br />
Improving pedestrian <strong>safety</strong> requires supportive policies that may be specifically<br />
focused on pedestrian <strong>safety</strong> or be part of general transport and land use policies.<br />
Guidelines that specify design standards for pedestrian facilities help to ensure<br />
pedestrian <strong>safety</strong> in new roadways and correct deficiencies on existing roads (7).<br />
Various existing guidelines such as the High capacity manual (9) and Complete<br />
streets (10) can be adapted to the local setting. Generally, pedestrian <strong>safety</strong> policies<br />
and guidelines need to recognize pedestrians as legitimate road users and promote<br />
this recognition among planners, engineers and professionals who plan and<br />
manage the road transport system; set and enforce traffic laws that ensure <strong>safety</strong><br />
of pedestrians; encourage an inclusive approach in planning new roads and/or<br />
retrofitting existing roads; and pay attention to the specific needs of people with<br />
disabilities, children and the elderly.<br />
68
The city of The Hague is located in the west of the<br />
Netherlands in the province of Zuid-Holland. It is<br />
about 45 kilometres from Amsterdam and 15 kilometres<br />
from Rotterdam. Approximately half a million<br />
people live in this city, which has a well-developed<br />
pedestrian infrastructure network and support services.<br />
The network and support services are the<br />
result of several years of action taken by different<br />
governments, local organizations and the public.<br />
Sustained efforts towards pedestrian <strong>safety</strong> in The<br />
Hague have been characterized by the following<br />
features:<br />
• Inclusion of financial resources for pedestrian<br />
<strong>safety</strong> measures in the overall budget for infrastructure<br />
development at the local and national<br />
government level.<br />
• Decentralization of decision-making on pedestrian<br />
<strong>safety</strong> issues to the local government level. The<br />
national Ministry of Infrastructure and Environment<br />
does not have administrative responsibility<br />
for pedestrian facilities. This role has been delegated<br />
to local authorities.<br />
• Integration of pedestrian <strong>safety</strong> solutions and<br />
facilities into overall urban and transport planning<br />
at the local level. Local authorities do not see<br />
pedestrian <strong>safety</strong> and infrastructure planning as<br />
independent tasks but rather as integral components<br />
of general urban management.<br />
• Taking action whenever a need or an issue is identified.<br />
For example, local authorities repair and<br />
maintain pedestrian infrastructure whenever there<br />
<strong>Pedestrian</strong> <strong>safety</strong>: a road <strong>safety</strong> manual for decision-makers and practitioners<br />
BOX 4.2: Improving pedestrian <strong>safety</strong> in The Hague, the Netherlands<br />
is a complaint from a member of the public or a<br />
business.<br />
• Reviewing and implementing pedestrian <strong>safety</strong><br />
policy consistently. As part of the sustained<br />
pedestrian <strong>safety</strong> improvement effort, in 1989 The<br />
Hague City Council agreed upon De Kern Gezond<br />
(a healthy heart for the inner city) plan. The plan<br />
provided the framework for the design of public<br />
space within the inner city. It outlined a new<br />
approach towards public space. In the late 1980s,<br />
the inner city of The Hague was car-dominated,<br />
with heavy traffic passing through it. De Kern<br />
Gezond prioritized pedestrians in public space<br />
design. Streets and squares were redesigned to<br />
favour pedestrians. The municipality began by<br />
increasing pedestrian zones. A new design and<br />
new materials were used, well adapted to the<br />
scale and speed of pedestrians. The central station<br />
area was redeveloped and the busy distributor<br />
roads were placed underground. The surface level<br />
was freed up for pedestrians and cyclists to move<br />
freely and safely. In 2011, almost the entire old<br />
city was transformed to a pedestrian area. Presently,<br />
The Hague has the largest car-free zone in<br />
the Netherlands.<br />
Generally, the number of pedestrians killed in The<br />
Hague each year does not exceed 10. In some<br />
years, there has been only one pedestrian killed.<br />
This is largely due to the sustained implementation<br />
of pedestrian, transport and urban development programmes<br />
in the city. This has been also reflected in<br />
the number of serious pedestrian injuries.<br />
4: Implementing pedestrian <strong>safety</strong> interventions<br />
<strong>Pedestrian</strong> deaths and injuries in The Hague (1993–2009)<br />
9<br />
80<br />
Number of pedestrian deaths<br />
8<br />
7<br />
6<br />
5<br />
4<br />
3<br />
2<br />
1<br />
0<br />
1993<br />
1994 1995 1996 1997 1998 1999 2000 2001 2002 2003 2004 2005 2006 2007 2008 2009<br />
Year<br />
70<br />
60<br />
50<br />
40<br />
30<br />
20<br />
10<br />
0<br />
Number of serious pedestrian injuries<br />
69
Implementing pedestrian <strong>safety</strong> interventions<br />
4.2 Implementing pedestrian <strong>safety</strong> interventions<br />
This section provides further details on the pedestrian <strong>safety</strong> measures listed in<br />
Table 4.1. It discusses the effectiveness of these measures and issues that should<br />
be considered for implementation. Examples are given to illustrate how the<br />
interventions have been implemented in different settings around the world, and<br />
to highlight opportunities and challenges encountered during the implementation<br />
process. Examples range from comprehensive measures to interventions<br />
targeting high-risk sites (e.g. pedestrian crossing points) or groups (e.g. people<br />
with disabilities) as well as measures focused on specific risk factors (e.g. speed<br />
management).<br />
4.2.1 Reducing pedestrian exposure to vehicular traffic<br />
There are a number of specific engineering measures that reduce pedestrian exposure<br />
to vehicular traffic. Most of these measures involve separating pedestrians from<br />
vehicles or reducing traffic volume. This section discusses sidewalks/footpaths,<br />
marked crossings, overpasses and underpasses, and mass transport routes as key<br />
strategies to reduce pedestrian exposure to vehicular traffic. These interventions are<br />
good starting points for action, but pedestrian <strong>safety</strong> will be most improved when<br />
they are implemented in conjunction with other measures such as reducing vehicle<br />
speed (see also Section 4.2.2).<br />
Sidewalks/footpaths<br />
Sidewalks separate pedestrians from motorized vehicles as well as bicycles. They<br />
provide space for different types of pedestrians to walk, run, play, meet and talk.<br />
Studies show that sidewalks improve both pedestrian <strong>safety</strong> and increase walking:<br />
• <strong>Pedestrian</strong> crashes decrease where there are sidewalks and raised medians. A study<br />
conducted in the United States found that pedestrian crashes were more than<br />
twice as likely to occur at locations without sidewalks than would be expected<br />
on the basis of exposure. Residential areas without sidewalks had 23% of all<br />
pedestrian–vehicle crashes but only 3% of pedestrian–vehicle exposures (3).<br />
• The presence of a sidewalk has a strong beneficial effect on reducing ‘walking<br />
along roadway’ pedestrian crashes. A study in the United States found that sites<br />
with sidewalks were 88% less likely to be pedestrian crash sites than those without<br />
sidewalks (11).<br />
• Walking increases where tracks for walking are constructed (5).<br />
To maximize the benefits of footpaths/sidewalks to pedestrian <strong>safety</strong>, they should:<br />
• be part of every new and renovated roadway;<br />
• be provided on streets that currently do not have sidewalks (see Box 4.3), including<br />
providing shoulders on rural roads;<br />
70
<strong>Pedestrian</strong> <strong>safety</strong>: a road <strong>safety</strong> manual for decision-makers and practitioners<br />
• be provided on both sides of the road;<br />
• consist of a hard, level surface;<br />
• be designed according to existing local guidelines with regards to width, depth,<br />
surface type and placement;<br />
• be separated from other vehicles with a kerb, buffer zone, or both;<br />
• be continuous and accessible to all pedestrians;<br />
• be adequately maintained;<br />
• have adequate width (as narrow sidewalks may be an additional road <strong>safety</strong> hazard);<br />
• include kerb ramps (as they are important in addressing the needs of people in<br />
wheelchairs and pedestrians with mobility impairments);<br />
• be free from obstructions (e.g. lamp posts and road signs), traders and other<br />
obstructions; and<br />
• include demarcations by road user type when shared by pedestrians and cyclists.<br />
4: Implementing pedestrian <strong>safety</strong> interventions<br />
While sidewalks and walkways are important facilities for pedestrians to<br />
walk safely in urban and suburban areas, in some rural areas having a<br />
wide paved shoulder may be suitable for providing a place for pedestrians and<br />
cyclists to travel as an alternative to a sidewalk.<br />
BOX 4.3: Retrofitting sidewalks and other pedestrian <strong>safety</strong> facilities in<br />
Abu Dhabi, United Arab Emirates<br />
Addressing safe walking and pedestrian traffic <strong>safety</strong><br />
may require constructing new pedestrian facilities, or<br />
improving existing facilities that may not be safe or<br />
user-friendly. The Abu Dhabi Urban Planning Council<br />
developed a street design manual to provide<br />
guidance on addressing the needs of the growing<br />
population and improving pedestrian facilities to<br />
create more walkable and liveable communities (12).<br />
The manual was adopted in January 2010 by the<br />
Abu Dhabi Executive Council as the primary guide<br />
to be used in designing all urban streets in the Abu<br />
Dhabi Emirate.<br />
A segment of a major street, known as Salam Street,<br />
was redesigned in 2011 according to the Abu Dhabi<br />
Urban Street Design Manual principles. Before<br />
redesign, the street was characterized by significant<br />
pedestrian risk, including:<br />
• the presence of obstructions in the pedestrian<br />
path, including manholes, utility poles, signage<br />
poles, and other ill-placed street furniture;<br />
• the lack of separation between pedestrians and<br />
vehicles, in particular the absence of bollards and<br />
kerbs; and<br />
• drivers failing to yield to pedestrians at free right<br />
turn points, with vehicles sometimes queuing on<br />
the raised table.<br />
The redesigned street has improved pedestrian<br />
facilities, including wider pedestrian refuge islands<br />
and medians, median barriers, raised crossings and<br />
traffic controls. The retrofit has generally improved<br />
conditions for walking and reduced vehicular speeds<br />
by 4–10km/h, relative to a comparable nearby<br />
street. The reduced speeds are mostly attributed<br />
Continued…<br />
71
Implementing pedestrian <strong>safety</strong> interventions<br />
Continued from previous page<br />
to the smaller roundabouts and narrower lanes on<br />
Salam Street, designed according to the new manual<br />
guidelines.<br />
In addition to street redesign interventions, the following<br />
measures are also included:<br />
• Enforcement of traffic laws in order to ensure that<br />
motorists respect pedestrian right-of-way at raised<br />
pedestrian crossings.<br />
• Raising awareness and implementing education<br />
programmes to inform motorists about the new<br />
sequencing of vehicle/pedestrian movement at<br />
traffic signals as well as traffic laws for the protection<br />
of pedestrians.<br />
• Implementation of other design measures to<br />
enhance pedestrian <strong>safety</strong> such as installing bollards<br />
on right turns and redirective kerbs.<br />
• Retrofitting other streets, including sidewalks.<br />
• Evaluation of the measures.<br />
© Rudayna Abdo<br />
Marked crossings<br />
Crossings separate pedestrians from vehicular traffic for a brief time period while<br />
they cross the street. The purpose of a marked crossing is to indicate the optimal or<br />
preferred location for pedestrians to cross. Marked crossings help to indicate pedestrian<br />
right-of-way and motorists’ need to yield to pedestrians at these points. Motorist<br />
compliance with yielding at marked crossings can be improved with awareness-raising,<br />
education and enforcement. Marked crossings are commonly installed at signalized<br />
intersections, as well as other high-volume pedestrian crossing locations such as<br />
school zones. They should, however, be installed in conjunction with other physical<br />
roadway enhancements that reinforce the crossing and/or reduce vehicle speeds.<br />
There are several important issues for practitioners and decision-makers to consider<br />
when installing crossings:<br />
• Crossing markings are unlikely to increase pedestrian <strong>safety</strong>, without related<br />
enhancements such as raised crossing islands and traffic signals.<br />
• Marked crossings are not appropriate where traffic speed is high.<br />
• Marked crossings on roads with more than two lanes may increase the risk of<br />
pedestrian–vehicle crashes.<br />
• Crossing locations should be convenient for pedestrians and accessible for<br />
pedestrians in wheelchairs. <strong>Pedestrian</strong> movements and desire lines (most direct/<br />
shortest path between two locations) can be analysed to identify optimum<br />
locations for crossings.<br />
72
<strong>Pedestrian</strong> <strong>safety</strong>: a road <strong>safety</strong> manual for decision-makers and practitioners<br />
• Marked crossings should guide pedestrians to cross at locations where there is<br />
street lighting at night.<br />
• Detectable warnings should be installed to advise pedestrians with visual<br />
impairments where the kerb ramp ends and the street begins. The warnings should<br />
also indicate when the traffic light will change.<br />
• There should be adequate visibility between vehicles and pedestrians. For example,<br />
night-time pedestrian crossings should be properly illuminated in order to help<br />
drivers to see pedestrians.<br />
Overpasses and underpasses<br />
<strong>Pedestrian</strong> overpasses and underpasses are bridges and tunnels that allow for<br />
uninterrupted flow that is separate from vehicular traffic. This measure is used<br />
primarily in areas with high pedestrian volumes.<br />
Several issues arise with implementation of overpasses and underpasses:<br />
• The effectiveness of these approaches depends largely upon the likelihood that<br />
they will be used by most of the pedestrians crossing the street. In Tokyo, where<br />
this does occur, reductions in vehicle–pedestrian crashes of up to 91% were<br />
found following the implementation of overpasses and fencing (3). The level<br />
of use depends on convenience, security, and walking distances compared with<br />
alternative crossing locations. <strong>Pedestrian</strong>s generally do not use these facilities if<br />
a more direct route is available. Tall fences and other pedestrian barriers may be<br />
used to channel pedestrians to the overpass or underpass. These are not always<br />
effective, however, since pedestrians find ways to go around the barriers and cross<br />
at intersections.<br />
• Overpasses are suitable when the topography allows for a structure without ramps,<br />
for example, an overpass over a below-grade freeway. Overpasses with multiple<br />
stairs are not user-friendly for the elderly or disabled pedestrians. Underpasses<br />
need to be designed in such a way as to offer a sense of being open and accessible.<br />
• Ramps must be designed to accommodate pedestrians in wheelchairs.<br />
• Underpasses can be affected by flooding, and may quickly become dirty without<br />
regular maintenance.<br />
• Underpasses are often dark, secluded places. They may be targeted by gangs or<br />
other perpetrators of interpersonal violence, and, for this reason, people who<br />
perceive a high risk of assault avoid them. Overpasses and underpasses should be<br />
well-lit and secure, to maximize personal security and therefore utilization.<br />
4: Implementing pedestrian <strong>safety</strong> interventions<br />
Mass transport routes<br />
<strong>Pedestrian</strong> <strong>safety</strong> is a key issue to consider in the design of any mass transport system,<br />
including routes and stops (see Box 4.4). Mass transport routes are usually located on<br />
major arterial roads, which are the most dangerous types of urban streets (13). Though<br />
travelling by public transport may be one of the safest modes, transit passengers are at<br />
a high risk of crashes when walking to and from the station or stop (14).<br />
73
Implementing pedestrian <strong>safety</strong> interventions<br />
BOX 4.4: Considering pedestrian <strong>safety</strong> in the design of mass<br />
transport routes<br />
A study on high capacity bus systems revealed<br />
that pedestrians accounted for over half of all<br />
fatalities across a sample of 32 bus corridors in<br />
five countries in Latin America and Asia-Pacific (15).<br />
Most conflicts between pedestrians and vehicles<br />
occur at stations and terminals. The terminals in<br />
particular can easily become dangerous spots on<br />
bus corridors.<br />
These findings have been utilized by EMBARQ – the<br />
World Resources Institute and partners, to develop<br />
key design recommendations for integrating <strong>safety</strong><br />
into the planning, design and operation of high<br />
capacity bus systems. In Mexico City, for example,<br />
a pedestrian-friendly public transport route known<br />
as Metrobus Line 4 has been designed. This route<br />
passes through the historic centre of the city, with<br />
some of the streets having very high pedestrian traffic.<br />
Many important <strong>safety</strong> improvements have been<br />
made on this route:<br />
• Provision of safe pedestrian access across the<br />
route, as well as to and from the stations.<br />
• Addition of medians to reduce crossing distance<br />
for pedestrians.<br />
• Protected refuge islands for pedestrians, with<br />
bollards and kerbs shielding pedestrians from<br />
vehicular traffic.<br />
• Installation of pedestrian ‘countdown’ signals<br />
at signalized intersections in the historic centre.<br />
Previously, pedestrians had to rely on the vehicle<br />
signals to judge whether they had adequate<br />
time to cross the street during the green phase.<br />
The yellow light for vehicles lasted less than four<br />
seconds, which did not leave pedestrians enough<br />
time to finish crossing and consequently put<br />
them at risk. The new countdown signals have<br />
addressed this problem.<br />
The newly designed bus route became operational<br />
in April 2012. The pedestrian <strong>safety</strong> design improvements<br />
indicated above are expected to improve<br />
<strong>safety</strong> and walking conditions for pedestrians. Similar<br />
interventions will be implemented in other cities<br />
where EMBARQ and local partners are working.<br />
© Marisela Ponce de León Valdés<br />
74
4.2.2 Reducing vehicle speeds<br />
<strong>Pedestrian</strong> <strong>safety</strong>: a road <strong>safety</strong> manual for decision-makers and practitioners<br />
One of the most effective ways to improve pedestrian <strong>safety</strong> is to reduce the speed of<br />
vehicles (16). As discussed above, and in Modules 1 and 2, speed is a key risk factor<br />
for pedestrian traffic injury. If possible, speed management measures should be used<br />
alongside measures to reduce pedestrian exposure to vehicular traffic. Even if it is<br />
not possible to reduce pedestrian exposure to traffic, speed management remains an<br />
effective measure to reduce pedestrian traffic risk, and a core component of the Safe<br />
System approach.<br />
Speed management is much more than setting and enforcing appropriate speed<br />
limits. It employs a range of measures in engineering, enforcement and education<br />
with the aim of balancing <strong>safety</strong> and efficient vehicle speeds on the road network.<br />
Detailed guidance on the effectiveness and implementation of speed management<br />
strategies can be found in Speed management (17), and Speed management: A road<br />
<strong>safety</strong> manual for decision-makers and practitioners (18). As shown in Module 2, there<br />
is a growing effort to implement system-wide lower speeds of 30 km/h or even less<br />
for entire geographical areas instead of focusing on individual streets (19).<br />
4: Implementing pedestrian <strong>safety</strong> interventions<br />
The engineering approach to speed management consists of a number of specific<br />
traffic calming measures – physical treatments to roads as well as perceptual<br />
treatments and speed limit reductions aimed at reducing vehicle speeds and<br />
sometimes traffic volume (20). Traffic-calming measures are generally of two types:<br />
• those that require motorists to change their direction of travel by moving either to<br />
the left or right; and<br />
• those that require motorists to change elevation by either going up or down.<br />
Perceptual design is the use of psychological principles such as patterns<br />
painted onto road surfaces that encourage drivers to reduce<br />
their speed (21).<br />
Traffic-calming measures can vary from a few minor changes, through modifications<br />
of local streets, to area-wide changes and major rebuilds (20). Their efforts include<br />
moderate speed reductions and street design changes, with various degrees of success<br />
in reducing pedestrian crashes and traffic volume. A number of studies show a<br />
reduction in pedestrian–vehicle conflicts and crashes associated with refuge islands,<br />
marked crossings with raised median, road narrowing, staggered lanes, road humps<br />
and junction redesign (3,22–24). Box 4.5 provides an example of implementation of a<br />
variety of traffic-calming measures in a town in China.<br />
75
3<br />
Implementing pedestrian <strong>safety</strong> interventions<br />
BOX 4.5: Traffic-calming measures in Zhaitang Town, China<br />
In China, pedestrians constituted the second largest<br />
group (25%) of those killed in road traffic crashes<br />
in 2010 (25). Growth of the economy, increasing<br />
urbanization and growth of motorized traffic are<br />
underlying factors leading to the increase in travel,<br />
and traffic situations that lead to pedestrian– vehicle<br />
conflicts in China (7). Traffic law violation and inadequate<br />
enforcement also contribute to the risks<br />
facing pedestrians (26). Various provinces and cities<br />
in China are implementing measures to improve<br />
pedestrian <strong>safety</strong>.<br />
that data collection will continue for several years<br />
to confirm the initial reductions in fatalities and<br />
injuries.<br />
• Vehicle speed: Observations at three intersections<br />
and four crossings indicated that average<br />
vehicle speed was reduced by 9%.<br />
• Non-motorized transport users’ travel behaviour:<br />
Crossing use increased and 65% of people interviewed<br />
felt that the measures had reduced speed<br />
and improved <strong>safety</strong>.<br />
In Zhaitang town in the Mentougou district, Beijing<br />
region, the authorities implemented pilot trafficcalming<br />
measures on six roads in 2008 (27). The<br />
measures were aimed at reducing speed and improving<br />
<strong>safety</strong> and conditions of travel for non-motorized<br />
transport users, and consisted of speed humps,<br />
raised crosswalks, raised intersections, speed cushions,<br />
roundabouts, chicanes, neckdowns, 2 centre<br />
island narrowing, lateral shifts, median diverters,<br />
boom barrier and pedestrian refuge islands.<br />
A before-and-after evaluation conducted in October<br />
2009 showed that these interventions had an impact<br />
on three aspects of road <strong>safety</strong> (27):<br />
• <strong>Road</strong> traffic injuries: The number of all road users<br />
killed reduced from two to zero after the measures<br />
were implemented. Similarly, the number of<br />
people injured reduced from six to one. It is hoped<br />
© Jinhong Guo<br />
When choosing traffic-calming measures, it is important to bear in mind the<br />
following issues (20):<br />
• A combination of traffic-calming measures provides the greatest benefit. Ideally,<br />
they should be applied on various streets and area-wide, rather than in one or two<br />
isolated spots.<br />
• The design of traffic-calming measures tends to be context-specific, so that<br />
different measures are appropriate on different types of roads. It is therefore<br />
important to apply measures on the street types and areas (e.g. residential) for<br />
which they are designed. Some are appropriate at intersections, some in lowvolume<br />
residential areas, and others are meant to be applied area-wide. Table 4.2<br />
provides an overview of the application of various calming measures to road<br />
types – arterial and local – as well as their anticipated impact on traffic volume.<br />
3<br />
Neckdowns are kerb extensions that create a narrowing of streets at intersections.<br />
76
Table 4.2<br />
<strong>Pedestrian</strong> <strong>safety</strong>: a road <strong>safety</strong> manual for decision-makers and practitioners<br />
• Different measures are appropriate for addressing either speed or traffic volume. It<br />
is therefore important to determine whether the aim is to reduce speed or traffic<br />
volume, or both (see Table 4.2).<br />
• Speed humps, traffic circles, and other traffic calming measures are perceived<br />
by some traffic engineers, neighbourhood residents, and members of the media<br />
as obstacles in the roadway. As a result, there may be opposition to installing<br />
these measures. Resident input and consensus may be necessary when planning<br />
residential traffic-calming measures.<br />
• Traffic-calming interventions alone do not improve conditions for pedestrians.<br />
Other issues need to be addressed, such as law enforcement and provision of<br />
adequate street lighting.<br />
Traffic-calming measures, their application and impact<br />
4: Implementing pedestrian <strong>safety</strong> interventions<br />
Speed reduction can be applied to: Impact on<br />
Type<br />
Arterial roads Local roads<br />
traffic volume<br />
Speed hump No Yes Possible<br />
Speed table With caution Yes Possible<br />
Raised crosswalk Yes Yes Possible<br />
Raised intersection With caution Yes Possible<br />
Textured pavements Yes Yes Possible<br />
Speed cushion With caution Yes Possible<br />
Rumble strips Yes Yes No<br />
Traffic (mini) circle No Yes Possible<br />
Roundabout Yes Yes Not likely<br />
Chicanes No Yes Yes<br />
Realigned intersection Yes Yes Possible<br />
Tight radii Yes Yes Possible<br />
Centre island narrowing Yes Yes Possible<br />
Chokers Yes Yes Possible<br />
<strong>Road</strong> diets (i.e. lane reduction) Yes Yes Yes<br />
Speed limits Yes Yes No<br />
Speed alerts, enforcement Yes Yes No<br />
Perceptual design Yes Yes Possible<br />
Warning signs Yes Yes No<br />
Half closure Yes Yes Yes<br />
Diagonal diverters Yes Yes Yes<br />
Lateral shift Yes Yes No<br />
Median barriers Yes No Yes<br />
Gateway treatments Yes No No<br />
Traffic signal coordination Yes No No<br />
Vehicle-activated signs Yes No No<br />
Note: Most of these treatments are expected to reduce speed. A brief description of selected traffic-calming measures<br />
is provided in Appendix 2. These traffic-calming measures need to be accompanied by other measures in order to be<br />
effective. For example, speed limits need to be enforced and supported through awareness raising and campaigns.<br />
Source: 20.<br />
77
Implementing pedestrian <strong>safety</strong> interventions<br />
Two of the most commonly used traffic-calming measures are raised pedestrian<br />
crossings and road narrowing, discussed below.<br />
Raised pedestrian crossings<br />
There are two key ways to reduce fatal and serious pedestrian injuries: the first is to<br />
separate pedestrians from motorized traffic, and the second is to slow vehicle speeds<br />
to levels low enough that if a collision does occur, it will not result in fatal or serious<br />
injury. Raised pedestrian crossings force vehicles to slow to speeds low enough that<br />
a pedestrian would survive a collision. Reductions in pedestrian crashes of around<br />
40% could be expected from the installation of a raised crossing (5).<br />
The key considerations for a decision-maker and practitioner with regards to raised<br />
pedestrian crossing are as follows:<br />
• Raised crossings should be clearly marked and advance warning provided.<br />
• They are not usually suitable for very high-speed environments.<br />
• Additional benefits are likely if there are other traffic-calming devices in advance<br />
of the crossing.<br />
<strong>Road</strong> narrowing<br />
There are a number of ways to narrow roads, including providing kerb extensions,<br />
installing refuge islands, and widening footpaths by narrowing or even removing<br />
lanes. Although a high-cost intervention, treatments that include widening footpaths<br />
have the additional benefit of providing higher quality facilities for pedestrians.<br />
<strong>Road</strong> narrowing has a double benefit of reducing both vehicular traffic speeds and<br />
pedestrian crossing distances. The <strong>safety</strong> impact of road narrowing varies depending<br />
on the treatments used. For example, provision of refuge islands could be expected to<br />
reduce crashes by around 40% (5).<br />
4.2.3 Improving the visibility of pedestrians<br />
A high percentage of pedestrian collisions and deaths occur when lighting conditions<br />
are low (see Module 1). There are a number of engineering and behavioural measures<br />
that make pedestrians more visible to motorists, especially during dusk, dawn, and at<br />
night (2–4). These measures include:<br />
• Providing crossing enhancements such as raised crossing islands and traffic signals.<br />
• Implementing lighting and/or crossing illumination measures. Increasing<br />
intensity of roadway lighting increases visibility of pedestrians at night, especially<br />
at pedestrian crossings. This intervention has been associated with significant<br />
reductions in night-time pedestrian crashes. For example, a study conducted in<br />
Australia reported a 59% reduction in pedestrian crashes following improvement<br />
in roadway lighting (3).<br />
• Removing or repositioning physical objects that affect visibility, such as trees<br />
and billboards that make it difficult for drivers to see pedestrians. Alternatively,<br />
78
<strong>Pedestrian</strong> <strong>safety</strong>: a road <strong>safety</strong> manual for decision-makers and practitioners<br />
kerb extensions can be used to safely place pedestrians in a more visible location<br />
prior to crossing and to provide better sight lines to observe traffic. These have<br />
the additional advantage of reducing the crossing distance for pedestrians and<br />
narrowing the roadway, which may slow vehicle speed.<br />
• Installing signals to alert motorists that pedestrians might be crossing. <strong>Pedestrian</strong>activated<br />
signals may be appropriate at locations with sporadic pedestrian traffic (28).<br />
• Improving conspicuity of pedestrians. <strong>Pedestrian</strong>s need to be aware that drivers<br />
may not see them in low light or dark conditions, especially when they are wearing<br />
dark clothing. Selecting light-coloured clothing as well as adding reflective<br />
materials to backpacks, shoes and clothing are basic measures to increase visibility<br />
of pedestrians (see Box 4.6).<br />
• Raising awareness among pedestrians and drivers, through public service<br />
announcements and other media, about the importance of pedestrian visibility,<br />
especially at night.<br />
4: Implementing pedestrian <strong>safety</strong> interventions<br />
BOX 4.6: Advocating for increased visibility of school children on roads in<br />
Ghana and the United Republic of Tanzania<br />
The nongovernmental organization Amend advocates<br />
for increased visibility of children on Africa’s roads. At<br />
its project sites in Ghana and the United Republic of<br />
Tanzania, Amend is involved in the social marketing<br />
of its “See & Be Seen” reflector-enhanced school<br />
bags. The school bags are made to be durable and<br />
affordable while making children more visible as<br />
they walk to and from school. Amend advocates that<br />
governments and school systems encourage the use<br />
of these school bags, and promote their purchase, in<br />
particular by parents of school-age children, through<br />
social marketing campaigns. Amend manufactures,<br />
distributes and retails the school bags, but this lifesaving<br />
advocacy need not be resource-intensive:<br />
any nongovernmental organization can lobby governments,<br />
parents and the media to promote the use<br />
of reflectors and other visibility enhancements, such<br />
as wearing light-coloured clothing – a very simple<br />
measure that has been shown to increase pedestrian<br />
visibility dramatically.<br />
Source: 29.<br />
© Jeffrey Witte<br />
4.2.4 Improving pedestrian and motorist <strong>safety</strong> awareness and<br />
behaviour<br />
Changing the attitudes and behaviour of drivers and pedestrians is a complex,<br />
long-term undertaking that requires a variety of interventions to be implemented.<br />
Measures commonly used to raise awareness and modify behaviour are discussed<br />
in the following sections. These measures are most effective when implemented<br />
alongside other measures described in this module such as speed management and<br />
reducing pedestrian exposure to vehicular traffic.<br />
79
Implementing pedestrian <strong>safety</strong> interventions<br />
Education, outreach and training<br />
Safe road-user behaviour and a reduction in pedestrian fatalities depend not only on<br />
knowledge and skills but also on community support, perception of vulnerability and<br />
risk, social norms and models, engineering measures and law enforcement (1,4). It is<br />
therefore important for practitioners and decision-makers to remember that road <strong>safety</strong><br />
education is an adjunct to other measures, rather than a stand-alone intervention.<br />
<strong>Road</strong> <strong>safety</strong> educational programmes may include the following:<br />
• Raising awareness. This can include informing drivers about care, prudence,<br />
kindness, consideration, speed, pedestrian right-of-the way and traffic rules;<br />
• School-based education. Such programmes help children acquire knowledge and<br />
skills for pedestrian <strong>safety</strong> (30). While these are important life skills and all children<br />
should be taught the rules of the road, school-based traffic education will only<br />
result in reduced pedestrian collisions when combined with other interventions.<br />
• Outreach. The school–home journey is a point of considerable exposure and risk<br />
for children. An important question to consider is when – what time of the day,<br />
which day of the week, and which month of the year – children are most at risk.<br />
Child pedestrians walking alongside or among vehicular traffic are at risk for many<br />
reasons: they often lack the ability to distinguish between safe and unsafe crossing<br />
gaps and sites, putting them at risk as they cross the road; they themselves may<br />
be distracted or are at risk from distracted drivers using their mobile phones (31).<br />
One strategy to improve the <strong>safety</strong> of school-going children is the use of a walking<br />
school bus (see Box 4.7).<br />
BOX 4.7: Walking school bus<br />
Originally developed in Australia, walking school<br />
buses typically have one adult leading a parade of<br />
children, while a second adult follows the group. In<br />
the middle is a line of children who are ‘walking’ on<br />
the ‘bus’. The bus crosses a community, picking up<br />
children at their homes and arriving at a school. It<br />
takes the reverse route after school. Studies indicate<br />
that walking school buses are effective ways<br />
to maintain children’s <strong>safety</strong> and also promote an<br />
active community and physical exercise (32). Beyond<br />
safer transportation to school, children gain some<br />
minutes of walking exercise per day, which is useful<br />
for their health (33).<br />
The walking school bus concept has been implemented<br />
in many countries around the world including<br />
China, the Philippines, the Republic of South Africa,<br />
the United States and the UK. The walking school<br />
bus has a number of challenges. The first challenge<br />
is the practicality of sustaining these programmes,<br />
which rely on volunteers (34). A second challenge<br />
is that walking school buses are easier to use on<br />
the way to school, but do not seem to work well for<br />
the return trips as children leave at different times.<br />
The third challenge is that these schemes tend to<br />
concentrate in high-income neighbourhoods, and not<br />
in areas with high levels of deprivation and greater risk<br />
for children (32).<br />
© Jeffrey Witte<br />
80
<strong>Pedestrian</strong> <strong>safety</strong>: a road <strong>safety</strong> manual for decision-makers and practitioners<br />
• Mass media campaigns. These can be used to inform the public about pedestrian<br />
<strong>safety</strong> legislation, risk factors, impact of collisions and solutions available. Targeted<br />
and planned mass media and social marketing campaigns informing the public<br />
about pedestrian <strong>safety</strong> laws and risk factors are necessary to improve driver and<br />
pedestrian behaviour and enhance understanding of traffic issues such as traffic signs<br />
and right-of-way for all road users (28). Information alone is rarely sufficient to<br />
bring about changes in road user behaviour; communications should be supported<br />
by strong legislation, including targeted law enforcement operations (see Box 4.8).<br />
BOX 4.8: Prioritizing pedestrian <strong>safety</strong> measures in the Western Cape<br />
Province, South Africa<br />
4: Implementing pedestrian <strong>safety</strong> interventions<br />
The Provincial Government of the Western Cape of<br />
South Africa is implementing a road <strong>safety</strong> initiative<br />
known as Safely Home. The provincial government<br />
has set itself a target of reducing road traffic fatalities<br />
by 50% between 2009 and 2014 (35). The<br />
majority of these fatalities affect pedestrians and<br />
cyclists – 48% in the province and as high as 68% in<br />
urban areas. The pedestrian <strong>safety</strong> component of the<br />
Safely Home initiative builds on previous efforts such<br />
as the pedestrian <strong>safety</strong> action plan developed in<br />
2000, other road <strong>safety</strong> activities and non-motorized<br />
transport programmes.<br />
The city of Cape Town has a non-motorized transport<br />
committee that meets monthly to discuss and plan<br />
issues affecting this mode of transport. The Cape<br />
Town Freeway Management System also takes measures<br />
to improve pedestrian <strong>safety</strong> on the freeways<br />
based on video surveillance. Each of the districts in<br />
the province has specific pedestrian activities such<br />
as the promotion of wearing reflective bands and<br />
scholar patrols at schools.<br />
In 2010, the provincial government commissioned<br />
a study to establish a baseline to help assess<br />
medium- to long-term strategy effects of interventions<br />
(35). The study generated a comprehensive<br />
review of key <strong>safety</strong> and traffic-calming measures<br />
that could be implemented (20). It also identified 16<br />
specific actions to be pursued, a number of which are<br />
relevant to pedestrian <strong>safety</strong>. For example improved<br />
data collection and processing; auditing road markings<br />
and speed limits; analysis of hazardous location<br />
data; awareness raising and improved enforcement.<br />
In 2012, the provincial government commissioned a<br />
study to identify the six most hazardous pedestrian<br />
locations in the Western Cape Province in order to<br />
make proposals to mitigate the situation at each<br />
location (36). The sites have been identified and<br />
specific measures recommended.<br />
Measures being implemented under the Safely Home<br />
initiative are:<br />
• Introducing speed cameras along hazardous sections<br />
of provincial roads.<br />
• Establishing anti-drinking and driving operation<br />
rooms, known locally as shadow centres, on the<br />
outskirts of Cape Town. The centres conduct<br />
immediate breath alcohol analysis near the<br />
location and therefore offer a greater chance of<br />
intervention, in an effort to reduce the incidence<br />
of drinking and driving.<br />
FIA Foundation<br />
Continued…<br />
81
Implementing pedestrian <strong>safety</strong> interventions<br />
Continued from previous page<br />
• Publishing a monthly ‘name and shame’ list of<br />
individuals and their home towns, for all drinking<br />
and driving convictions, in local and provincial<br />
newspapers.<br />
• Conducting public awareness (“Crash Witness”)<br />
campaigns using footage of serious crashes on<br />
YouTube.<br />
• Using closed-circuit television images as evidence<br />
to strengthen enforcement at railway level crossings,<br />
which are sites for pedestrian fatalities in<br />
the province.<br />
• Encouraging the public to report reckless driving,<br />
especially by public transport operators, using<br />
social media platforms such as Facebook, Twitter<br />
and Mxit.<br />
• Providing pedestrian overpasses at two high-incidence<br />
locations.<br />
• Conducting random inspection of vehicles and<br />
drivers.<br />
The initial efforts have led to a 29% reduction in road<br />
fatalities in about three years (35). While availability<br />
of data has been identified as a major limitation for<br />
the evaluation of trends in road traffic fatalities in<br />
the province, it is hoped that the existing database<br />
systems and those that have been recommended for<br />
improvement or development will be useful for evaluating<br />
this initiative as implementation progresses.<br />
The initiative shows how pedestrian <strong>safety</strong> can be<br />
prioritized within an overall road <strong>safety</strong> programme.<br />
© M. Khayesi<br />
Traffic law enforcement<br />
Traffic laws affecting pedestrian <strong>safety</strong> are largely aimed at controlling pedestrian and<br />
driver behaviour at intersections, crossings and other locations (28). Comprehensive<br />
legislation is a key element of pedestrian <strong>safety</strong>, but legislation alone is not likely<br />
to facilitate behaviour change in the absence of law enforcement and adequate<br />
penalties. Driver and pedestrian compliance with laws critical to pedestrian <strong>safety</strong> –<br />
such as legal vehicle speed limits, drinking and driving regulations, red-light signal<br />
compliance and pedestrian traffic control signals – are motivated in part by the<br />
perceived risk of detection, i.e. law enforcement, and in part by the perceived severity<br />
of the penalties (1).<br />
Failure of motorists to obey posted speed regulations contributes substantially to<br />
pedestrian collisions and injuries. High pedestrian use areas may be identified and<br />
associated with a lower speed limit. In addition to enforcement of speed limits by<br />
the police, there are also physical measures related to the road and the vehicle that<br />
need to be implemented, for example speed bumps, which contribute to compliance<br />
with maximum posted speed limits (see Section 4.2.2). Consistent and highly visible<br />
law enforcement operations through a mix of visible patrols and fixed cameras are<br />
therefore essential (18). Similarly, pedestrians should also follow regulations such<br />
stopping when the traffic light is red for vehicles to move on.<br />
82
<strong>Pedestrian</strong> <strong>safety</strong>: a road <strong>safety</strong> manual for decision-makers and practitioners<br />
Alcohol-impaired drivers and pedestrians create injury risk for themselves and other<br />
road users. Strict legislation and complementary activities that can help reduce<br />
pedestrian road traffic injuries related to alcohol include the following (4,18):<br />
• Conducting mass media campaigns on drinking and driving, including informing<br />
the public about drinking and driving regulations and penalties.<br />
• Setting and enforcing BAC limits for the general driving population (0.05g/dl)<br />
and lower limits for young and inexperienced drivers.<br />
• Setting and enforcing minimum drinking-age laws.<br />
• Regulating and enforcing laws on availability of alcohol.<br />
• Enforcing BAC limits through random breath testing and sobriety checks, and<br />
implementing penalties for offenders.<br />
• Enforcing laws on being drunk in public places, which will cover drivers,<br />
pedestrians and other members of the public.<br />
• Conducting briefing interventions for injured people who come into emergency<br />
rooms with alcohol-related problems, including pedestrians, drivers and other<br />
patients.<br />
• Rehabilitating high-risk offenders, that is, those with BAC levels in excess of 0.15g/dl.<br />
4: Implementing pedestrian <strong>safety</strong> interventions<br />
4.2.5 Improving vehicle design for pedestrian protection<br />
Motor vehicles have become increasingly safer for occupants, due to improvements<br />
in vehicle design. Until recently, vehicle design incorporated few features to protect<br />
pedestrians, but there is an increasing effort to include design elements that reduce<br />
the likelihood of pedestrian collision and/or reduce the severity of pedestrian injury<br />
in the event that a vehicle–pedestrian crash does occur.<br />
Collision prevention by vehicle design<br />
The vehicle feature ‘Brake Assist’ improves emergency braking ability and reduces<br />
the chance of collision. Brake Assist activates when a sensor detects an emergency<br />
situation, indicated by unusually fast brake pedal actuation and/or unusually<br />
hard pressure on the brake pedal. Brake Assist, which is now fitted as standard to<br />
most new cars, can prevent some collisions with a pedestrian or at least reduce the<br />
impact speed of a collision. An evaluation conducted in France concluded that cars<br />
equipped with Brake Assist had a 10% lower involvement in pedestrian fatalities than<br />
cars without Brake Assist (37).<br />
Brake Assist only activates, however, if the driver attempts to brake, which may not<br />
happen if the driver does not perceive a risk. In 45% of fatal pedestrian collisions in<br />
Adelaide, Australia, for example, drivers reported that they took no evasive action,<br />
typically because they did not see the pedestrian before impact, or realize that a<br />
collision was likely (38).<br />
Autonomous Emergency Braking (AEB) is a more recent development in pedestrianprotective<br />
vehicle design. Cars with AEB have sensors, usually mounted behind the<br />
83
Implementing pedestrian <strong>safety</strong> interventions<br />
grille and/or high behind the windscreen, that scan the road and roadside ahead of<br />
the car. If the sensors detect a risk of collision with a pedestrian (or vehicle) in front<br />
of the car, the driver is warned and/or the brakes are automatically applied. AEB<br />
has only a modest market penetration at present, but this is likely to increase rapidly<br />
with the demands of European New Car Assessment Programme (Euro NCAP)<br />
and similar programmes. As with all new technologies, it will be several years before<br />
vehicles with such systems begin to noticeably affect overall crash numbers (39–41).<br />
Injury control by vehicle regulation and <strong>safety</strong> rating<br />
The New Car Assessment Programme (NCAP) concept was developed in the<br />
late 1980s by the National Highway Traffic <strong>Safety</strong> Administration in the United<br />
States to assess and publicize levels of occupant protection provided by new cars.<br />
NCAP creates vehicle <strong>safety</strong> ratings for new vehicles based on crash test data and<br />
assessment of <strong>safety</strong> features. The programme is intended to inform consumers<br />
about vehicle <strong>safety</strong> and influence consumer behaviour in a way that encourages<br />
vehicle manufacturers to improve vehicle design. NCAPs have since been established<br />
in Europe, Australia and New Zealand, Japan, the Republic of Korea and Latin<br />
America, and also by the Insurance Institute for Highway <strong>Safety</strong> in the United<br />
States (42).<br />
Since 2000, the NCAPs in Europe, Australia and Japan, and more recently in<br />
the Republic of Korea, have introduced pedestrian <strong>safety</strong> assessments based<br />
on pedestrian impact test procedures originally developed by the European<br />
Experimental Vehicles Committee Working Group in the 1980s (42,43) (see<br />
Box 4.9). The European and Australian NCAPs have recently incorporated the<br />
pedestrian <strong>safety</strong> score into the overall NCAP <strong>safety</strong> rating for a vehicle. These<br />
NCAP programmes have had a greater influence on vehicle design improvements for<br />
pedestrian <strong>safety</strong> than formal regulations, which are much slower to develop than the<br />
market forces that drive decision-making by vehicle manufacturers.<br />
Some regulation of vehicle design for pedestrian protection has been introduced<br />
in Europe and Japan. More recently a <strong>Global</strong> Technical Regulation (GTR) for<br />
pedestrian protection has been issued by the United Nations World Forum for<br />
Harmonization of Vehicle Regulations (United Nations Economic Commission<br />
for Europe Working Party 29), after extensive debate over criteria to be used in<br />
mandatory vehicle regulations for pedestrian <strong>safety</strong>. The crash test criteria of the<br />
GTR are less stringent than corresponding NCAP requirements but compulsory<br />
compliance with the GTR would be likely to facilitate improvements in current<br />
vehicle design (44). Many vehicles currently in circulation would fail even the<br />
minimum standard that it sets. Once the minimum standard is increasingly met<br />
in new vehicles, the requirements of the GTR can be revised so that they are more<br />
closely aligned with NCAP requirements. There is also a strong case for assessment<br />
of pedestrian protection to be based on integrating the effects of collision detection<br />
and injury mitigation systems (45).<br />
84
<strong>Pedestrian</strong> <strong>safety</strong>: a road <strong>safety</strong> manual for decision-makers and practitioners<br />
BOX 4.9: Crash test procedures to assess pedestrian <strong>safety</strong><br />
Test procedures to assess the extent to which a<br />
vehicle protects a pedestrian in the event of a collision<br />
are now well established in both regulation and<br />
consumer advisory programmes (46). Unlike impact<br />
tests to assess the protection of car occupants,<br />
which utilize full-scale crash test dummies, the<br />
pedestrian crash tests simulate impact between the<br />
car and the legs, hip and head of the pedestrian. This<br />
is largely because of difficulties in ensuring repeatability<br />
in full-scale collisions between a pedestrian<br />
dummy and a car, as well as concerns about the<br />
ability of a full-scale pedestrian crash test dummy to<br />
be life-like in appearance or responses (47). Current<br />
pedestrian impact test procedures are largely based<br />
on specifications presented by the European Experimental<br />
Vehicles Committee (EEVC) Working Group<br />
in 1987. In particular, 40 km/h was chosen as the<br />
vehicle test speed because it was thought in 1982<br />
that it was representative of impact speeds resulting<br />
in serious injury to the pedestrian and some doubt<br />
about the ability of car designers to satisfy the test<br />
requirements at higher speeds (48).<br />
4: Implementing pedestrian <strong>safety</strong> interventions<br />
4.2.6 Providing care for injured pedestrians<br />
The primary goal in pedestrian <strong>safety</strong> should be to prevent road crashes from<br />
happening in the first place. However, pedestrians do get injured, despite the<br />
best efforts and intentions. An efficient post-crash care response can minimize<br />
the consequences of serious injury, including long-term morbidity or mortality.<br />
<strong>Pedestrian</strong>s struck by motor vehicles with high energy transfer end up with high<br />
residual locomotion disability and also have significantly higher mortality rates<br />
than occupants of vehicles (49). Injury patterns in pedestrians are unique – in adults<br />
injuries to legs, head and pelvis are common. In children, injuries to head and neck<br />
followed by musculoskeletal injuries are commonly noted. In general, head injuries<br />
are more life-threatening while limb injuries are associated with long-term disabilities.<br />
The severity of these injuries depend upon many factors, including energy transfer<br />
(speed of the vehicle), angle of impact, the body part that first comes into contact with<br />
the vehicle and vehicle design (see Module 1). The considerations for organization and<br />
delivery of post-crash care should take into account these factors (50).<br />
Post-crash care includes a sequential set of actions and care aimed to reduce<br />
the impact of injury consequences once a road traffic crash has occurred (see<br />
Figure 4.1). Patients suffering minor injuries may not need advanced medical care<br />
or hospitalization. For victims of major injuries, a chain of care is needed, consisting<br />
of action taken by bystanders at the scene of the crash, access to the pre-hospital<br />
medical care system, emergency medical services, definitive trauma care at the<br />
hospital and rehabilitation services to re-integrate the victims into work and family<br />
life. The effectiveness of such a chain and the outcomes of the injured depend upon<br />
the strength of each of its links (51). In a fully developed trauma system, trauma care<br />
delivery is organized through its entire spectrum, from injury prevention to prehospital,<br />
hospital and rehabilitative care for the injured pedestrian and other road<br />
users in an integrated way.<br />
85
Implementing pedestrian <strong>safety</strong> interventions<br />
Figure 4.1 The chain of trauma care for injured pedestrians<br />
Bystander<br />
first aid<br />
Rehabilitation<br />
Access to<br />
emergency<br />
medical<br />
services<br />
Intensive care<br />
Prehospital<br />
care at<br />
roadside<br />
Specialist<br />
intervention<br />
Appropriate<br />
transportation<br />
to hospital<br />
Early<br />
resuscitation<br />
Rapid<br />
diagnosis<br />
Source: adapted from the Life Saving Chain (see reference 52)<br />
Pre-hospital care<br />
The majority of deaths from road traffic injuries occur prior to the patient reaching<br />
a hospital. Timely pre-hospital care and prompt transportation to an appropriate<br />
health facility or trauma centre are crucial to the outcome of injured pedestrians.<br />
Many high-income countries have developed complex and expensive systems for<br />
providing emergency medical care. A formal emergency medical service (EMS),<br />
easily accessed through an emergency telephone number, is in place, especially in<br />
urban areas, to offer pre-hospital care by professionally trained staff. The injured<br />
patient is transported by ambulance equipped with monitoring devices, a wide<br />
range of medicine and wireless communication, that is staffed by a physician or<br />
non-physician paramedics to render advanced pre-hospital trauma care. The goal of<br />
such a service is to quickly identify and treat life-threatening injuries until the patient<br />
arrives at a definitive care centre. Triage and direct transfer to a trauma centre has<br />
been shown to reduce mortality rates among severely injured patients, including<br />
pedestrians (53). In many communities, bystanders and other first responders such as<br />
police, rescue workers and firemen are trained in first aid to help such victims before<br />
the medical help arrives at the scene.<br />
It should be noted that a majority of the world’s population does not have access to<br />
such an advanced level of pre-hospital care. In many countries, few victims receive<br />
86
<strong>Pedestrian</strong> <strong>safety</strong>: a road <strong>safety</strong> manual for decision-makers and practitioners<br />
© Margie Peden<br />
4: Implementing pedestrian <strong>safety</strong> interventions<br />
treatment at the scene of the crash and fewer still can get transported to the hospital<br />
in an ambulance. As a result, many victims may needlessly die at the scene or during<br />
the first few hours following an injury. There are several ways to strengthen the prehospital<br />
care system in resource-constrained settings by building on existing systems<br />
and harnessing community resources. Many countries have trained commercial<br />
drivers, community workers and other groups to offer the post-crash care to injured<br />
pedestrians with varying degree of success. The strategy to create emergency rescue<br />
systems should aim at ensuring availability and use of equipment, supplies and<br />
organizational structures to create an effective and adaptable pre-hospital care system<br />
for injured people (54).<br />
Hospital-based trauma care<br />
An injured person will benefit most if he is promptly brought to an appropriate<br />
hospital for definitive care of injuries. Through a process of triage, the pre-hospital<br />
care providers can direct the patients to an appropriate hospital that is equipped to<br />
deal with the injuries sustained. <strong>Pedestrian</strong>s often sustain ‘polytrauma’ or multiple<br />
injuries and consequently will have better outcomes if treated at trauma centres<br />
with full capabilities to deal with such patients. Many high-income countries have<br />
designated hospitals or trauma centres with adequate physical resources and trained<br />
health care staff to treat injured patients. Such an approach has shown to improve<br />
the outcomes of the injured in several high-income countries (55). The Advance<br />
Trauma Life Support (ATLS) Guidelines of the American College of Surgeons<br />
have standardized approaches to severely injured patients and implementing such<br />
87
Implementing pedestrian <strong>safety</strong> interventions<br />
guidelines in treating the injured has shown to improve patient survival (56). Training<br />
health care staff involved in care of the injured in such protocols is important, and is<br />
a mandatory requirement in many countries. Major trauma resuscitation should be<br />
a team effort where each trained team member has a designated role in management<br />
of the patient. Such trauma teams have been shown to lead to significant reductions<br />
in resuscitation times (57). Improvements in hospital-based care do not necessarily<br />
require expensive technology or equipment. Trauma care can also be achieved in an<br />
affordable and sustainable way by imparting training, better organization, planning<br />
and simple quality improvement programmes (58).<br />
Rehabilitation<br />
Many of those who survive injuries are left with physical disabilities that limit their<br />
mobility and function (see Box 4.10). Many of these consequences are avoidable and<br />
can be minimized by early, multi-disciplinary rehabilitation services. Rehabilitation<br />
services are an essential element of trauma care and should be made available to<br />
those who need them. There is an increasing trend to offer all the above services to<br />
the injured in an integrated manner, through an inclusive trauma system, which is a<br />
comprehensive injury response network that includes all facilities with capabilities<br />
to care for the injured. For example, the United States has a vision of a future trauma<br />
system that is intended to enhance community health through an organized system<br />
of injury prevention, acute care and rehabilitation that is fully integrated with the<br />
public health system in a community. It is anticipated that trauma systems will<br />
possess the ability to identify risk factors and related interventions to prevent injuries<br />
in a community, and will maximize the integrated delivery of optimal resources for<br />
patients who ultimately need acute trauma care. It is hoped that trauma systems will<br />
address the daily demand of trauma care and form the basis for disaster preparedness.<br />
The resources required for each component of a trauma system will be clearly<br />
identified, deployed and studied to ensure that all injured patients gain access to the<br />
appropriate level of care in a timely, coordinated and cost-effective manner (59).<br />
Countries should also be prepared to deal with those who are injured by reducing<br />
their consequences and enhancing their quality of life. The way in which injured<br />
pedestrians are dealt with following a road traffic crash determines their chances and<br />
the quality of survival. The three components of care outlined above – pre-hospital,<br />
hospital and rehabilitation – are interrelated and form a chain of care.<br />
88
BOX 4.10: <strong>Pedestrian</strong>s with disabilities<br />
People with disabilities make up 15% of the world<br />
population (60) but it is unclear what proportion of<br />
these are the consequence of pedestrian collisions.<br />
What is known is that, in general, injury rates are<br />
higher among disabled children and adults (61–64).<br />
For example:<br />
• A United States study found that children with<br />
disabilities were more than five times as likely to<br />
have been hit by a motor vehicle as a pedestrian<br />
or cyclist than children without disabilities (64).<br />
• A New Zealand study found that children with<br />
abnormal vision were four times as likely as other<br />
children to have a pedestrian injury, and that children<br />
with abnormal hearing were twice as likely to<br />
have a pedestrian injury (65).<br />
<strong>Pedestrian</strong> <strong>safety</strong>: a road <strong>safety</strong> manual for decision-makers and practitioners<br />
4: Implementing pedestrian <strong>safety</strong> interventions<br />
In addition, people with disabilities, like other road<br />
users, may experience anxiety and stress when travelling<br />
on roads without adequate crossings or when<br />
using personal assistive devices (66, 67).<br />
The risk for pedestrians with disabilities is elevated<br />
because of the following reasons (64):<br />
• People with mobility impairments may cross roads<br />
more slowly and may be more at risk for falls if<br />
sidewalks or road surfaces are uneven.<br />
• Wheelchair users will be disadvantaged if kerb<br />
cuts are lacking or if accessible routes are lacking,<br />
and may find it harder to dodge traffic.<br />
• People who have sight or hearing loss may not<br />
be able to anticipate and avoid other road users.<br />
• People with intellectual disabilities may be unable<br />
to make good judgements about <strong>safety</strong> – knowing<br />
when it is safe to cross the road – or may behave<br />
in unpredictable ways.<br />
Environmental changes are likely to reduce vulnerability<br />
of people with disabilities to road traffic injury (64).<br />
For example, tactile paving can alert visually impaired<br />
people to the edges of steps and pavements, and<br />
indicate safe crossing places. Emerging research has<br />
shown some ways to better provide road <strong>safety</strong> facilities<br />
for pedestrians with disabilities. Participative<br />
research in Papua New Guinea, for example, explored<br />
the views of local road decision-makers and people<br />
with disabilities about road planning in rural and<br />
urban areas, with the aim of promoting inclusion of<br />
people with disabilities in road planning. This action<br />
research has led to a greater awareness and partnership<br />
(68). Research in the UK has investigated road<br />
<strong>safety</strong> experiences of deaf people – including drivers<br />
and pedestrians – and recommended measures to<br />
improve their <strong>safety</strong> and the police response to their<br />
needs (69, 70). However, more research is needed<br />
on the risk of injury to people with disabilities and<br />
appropriate prevention strategies.<br />
The World report on disability highlighted the importance<br />
of accessibility. The basic features of access<br />
should include (61):<br />
• provision of kerb cuts or ramps;<br />
• safe crossings across the street, with signalling<br />
that can be detected by people with sight or hearing<br />
loss, and crossing periods that enable people<br />
with mobility impairments to cross;<br />
• accessible entries to buildings;<br />
• an accessible path of travel to all spaces; and<br />
• access to public amenities, such as toilets.<br />
© Virot, WHO<br />
89
Implementing pedestrian <strong>safety</strong> interventions<br />
4.3 Summary<br />
The content of this module can be summarized as follows:<br />
• Effective interventions to improve pedestrian <strong>safety</strong> are available. Implementation<br />
should utilize a comprehensive approach that focuses on engineering, enforcement<br />
and education measures. Taking a single approach will usually be less effective. A<br />
combination of measures is needed in order to comprehensively address the range<br />
of risks to pedestrians in different settings.<br />
• Interventions that have been found effective are reducing vehicle speeds,<br />
separating pedestrians from other traffic, increasing the visibility of pedestrians,<br />
changing pedestrian and motorist behaviour through public education and law<br />
enforcement, improving vehicle design and improving care for the injured.<br />
• <strong>Pedestrian</strong>s should be seen as a group with diverse needs and capabilities. The<br />
needs of special pedestrian groups such as children, the elderly and disabled people<br />
need to be prioritized when designing and implementing measures.<br />
• The case studies provided highlight several key elements for success:<br />
▷▷the importance of political leadership at multiple administrative levels;<br />
▷▷the involvement and contribution of multiple stakeholders;<br />
▷▷the need to plan and allocate resources;<br />
▷▷the necessity of setting targets;<br />
▷▷the role of sustaining efforts over a long period of time;<br />
▷▷the importance of implementing effective interventions; and<br />
▷▷the need for evaluation (see Module 5).<br />
References<br />
1. Lonero LP, Clinton KM, Sleet D. Behavior change interventions in road <strong>safety</strong>. In: Gielen AC, Sleet DA,<br />
DiClemente RJ, eds. Injury and violence prevention: behavioral science theories, methods and applications. San<br />
Francisco, Jossey-Bass, 2006: 213–233.<br />
2. Zeeger CV et al. Guidance for implementation of AASHTO strategic highway <strong>safety</strong> plan: Volume 10: A guide<br />
for reducing collisions involving pedestrians. Washington, DC, Transportation Research Board, 2004.<br />
3. Retting R, Ferguson S, McCartt A. A review of evidence-based traffic engineering measures designed to<br />
reduce pedestrian–motor vehicle crashes. American Journal of Public Health, 2003, 93: 1456–1463.<br />
4. Peden M et al. World report on road traffic injury prevention. Geneva, World Health Organization, 2004.<br />
5. Elvik R et al. The handbook of road <strong>safety</strong> measures, 2nd ed. Bingley, Emerald Group Publishing Limited, 2009.<br />
6. Sleet DA. Naumann RB, Rudd RA. Injuries and the built environment. In: Dannenberg AL, Frumkin<br />
H, Jackson RJ. eds. Making healthy places: designing and building for health, well-being and sustainability.<br />
Washington, DC, Island Press, 2011: 77–90.<br />
7. Zegeer CV, Bushell M. <strong>Pedestrian</strong> crash trends and potential countermeasures from around the world.<br />
Accident Analysis & Prevention, 2012, 44: 3–11.<br />
8. Job RFS et al. <strong>Pedestrian</strong>s at traffic light controlled intersections: crossing behaviour in the elderly and nonelderly.<br />
In: Smith K, Aitken BG, R.H. Grzebieta RH, eds. Proceedings of the conference on pedestrian <strong>safety</strong>.<br />
Canberra: Australian College of <strong>Road</strong> <strong>Safety</strong> & Federal Office of <strong>Road</strong> <strong>Safety</strong>, 1998:3–11.<br />
9. Ryus P et al. Highway capacity manual 2010. Washington, DC, Transportation Research Board, 2011.<br />
90
<strong>Pedestrian</strong> <strong>safety</strong>: a road <strong>safety</strong> manual for decision-makers and practitioners<br />
10. LaPlante J, McCann B. Complete streets: we can get there from here. Institute of Transportation Engineers<br />
Journal, 2008, 78 (5): 24–28.<br />
11. McMahon PJ et al. An analysis of factors contributing to “walking along roadway” crashes: Research study and<br />
guidelines for sidewalks and walkways. Chapel Hill, University of North Carolina Highway <strong>Safety</strong> Research<br />
Center, 2002 (FHWA-RD-01–101).<br />
12. Abu Dhabi urban street design manual. Abu Dhabi, Abu Dhabi Urban Development Council, 2010.<br />
13. Dumbaugh E, Rae R. Safe urban form: revisiting the relationship between community design and traffic<br />
<strong>safety</strong>. Journal of the American Planning Association, 2009, 75: 3: 309–329.<br />
14. European Transport <strong>Safety</strong> Council. Transport <strong>safety</strong> performance in the EU: a statistical overview. Brussels,<br />
European Transport <strong>Safety</strong> Council, 2003.<br />
15. Duduta N et al. Understanding the road <strong>safety</strong> impact of high-performance BRT and busway design features.<br />
Transportation Research Record: Journal of the Transportation Research Board (in press).<br />
16. Davis GA. Relating severity of pedestrian injury to impact speed in vehicle pedestrian crashes. Transportation<br />
Research Record, 2001, 1773: 108–113.<br />
17. Speed management. Paris, Organisation for Economic Co-operation and Development, 2006.<br />
18. Speed management: a road <strong>safety</strong> manual for decision-makers and practitioners. Geneva, <strong>Global</strong> <strong>Road</strong> <strong>Safety</strong><br />
<strong>Partnership</strong>, 2008.<br />
19. Whitelegg J. Quality of life and public management: redefining development in the local environment. Oxon,<br />
Routledge, 2012.<br />
20. Vanderschuren M, Jobanputra R. Traffic calming measures: review and analysis. Cape Town, African Centre of<br />
Excellence for Studies in Public and Non-motorized Transport, 2009 (Working Paper 16–02).<br />
21. Charlton SG. Speed management designs for New Zealand. University of Waikato, Traffic and <strong>Road</strong> <strong>Safety</strong><br />
Research Group, 2005.<br />
22. Geddes E. <strong>Safety</strong> benefits of traffic calming. Vancouver, BC, Insurance Corporation of British Columbia, 1996.<br />
23. Ewing R. Impacts of traffic calming. Transportation Quarterly, 2001, 55: 33–45.<br />
24. Bunn F et al. Traffic calming for the prevention of road traffic injuries: systematic review and meta-analysis.<br />
Injury Prevention, 2003, 9: 200–204.<br />
25. <strong>Global</strong> status report on road <strong>safety</strong> 2013: supporting a decade of action. Geneva, World Health Organization,<br />
2013.<br />
26. Chen Y et al. <strong>Safety</strong> improvement practice for vulnerable road users in Beijing intersections. TRB 88th<br />
Annual Meeting Compendium of Papers DVD. Washington DC, Transportation Research Board, 2008.<br />
27. Changcheng L et al. First engineering practice of traffic calming in Zhaitang Town in China. In: International<br />
Conference on Optoelectronics and Image Processing, 2010, 1: 565–568.<br />
28. Karsch HM et al. Review of studies on pedestrian and bicyclist <strong>safety</strong>. Washington, D.C., National Highway<br />
Traffic <strong>Safety</strong> Administration, 2012 (DOT HS 811 614).<br />
29. Advocating for road <strong>safety</strong> and road traffic injury victims: a guide for nongovernmental organizations. Geneva,<br />
World Health Organization, 2012.<br />
30. Duperrex O, Roberts I, Bunn F. <strong>Safety</strong> education of pedestrians for injury prevention: a systematic review of<br />
randomised controlled trials. British Medical Journal, 2002, 324: 1129–1131.<br />
31. Stavrinos D, Byington KW, Schwebel DC. The effects of cell phone distraction on pediatric pedestrian injury<br />
risk. Pediatrics, 2009, 123: e179–e185.<br />
32. Collins CAD, Kearns R. Geographies of inequality: child pedestrian injury and walking school buses in<br />
Auckland, New Zealand. Social Science & Medicine, 2005, 60: 61–69.<br />
33. VicHealth. History of VicHealth walking school bus [website] (http://www.vichealth.vic.gov.au/en/Programsand-Projects/Physical-Activity/Physical-activity-programs/Active-travel-programs/Walking-School-Bus/<br />
History-of-VicHealths-WSB.aspx?p=1, accessed 21 September 2012).<br />
34. Muchaka P, Behrens R. Evaluation of a ‘walking bus’ demonstration project in Cape Town: qualitative findings,<br />
implications and recommendations. Paper presented to 31st Southern African Transport Conference, Pretoria,<br />
9–12 July 2012.<br />
35. Western Cape Provincial Government. Safely Home [website] (http://safelyhome.westerncape.gov.za/,<br />
accessed 21 September 2012).<br />
36. Council of Scientific and Industrial Research. Western Cape pedestrian hazardous location research. Cape<br />
Town, Western Cape Provincial Government, 2012.<br />
4: Implementing pedestrian <strong>safety</strong> interventions<br />
91
Implementing pedestrian <strong>safety</strong> interventions<br />
37. Page Y, Foret-Bruno JY, Cuny S. Are expected and observed effectiveness of emergency brake assist in preventing<br />
road injury accidents consistent? Washington DC, National Highway Traffic <strong>Safety</strong> Administration, 2005<br />
(Report no 05–0268).<br />
38. Anderson RWG et al. Vehicle travel speeds and the incidence of fatal pedestrian crashes. Accident Analysis &<br />
Prevention, 1997, 29 (5): 667–674.<br />
39. Anderson RWG et al. Potential benefits of forward collision avoidance technology. Department of Transport<br />
and Main <strong>Road</strong>s, Queensland, Brisbane (CASR106), 2012.<br />
40. Anderson RWG. Integrating the assessment of pedestrian <strong>safety</strong> in vehicles with collision detection and<br />
mitigation systems. Proceeding of 2012 IRCOBI Conference, Dublin, 12–14 September 2012, pp751–760.<br />
41. Rosén E et al. <strong>Pedestrian</strong> injury mitigation by autonomous braking. Accident Analysis & Prevention, 2010, 42<br />
(6): 1949–1957.<br />
42. Grover C et al. Automated emergency brake systems: Technical requirements, costs and benefits. Crowthorne,<br />
Transportation Research Laboratory, 2008 (TRL Published Project Report PPR 227).<br />
43. <strong>Global</strong> NCAP. Promoting safer cars worldwide [website] (http://www.globalncap.org/NCAPProgrammes/<br />
Pages/<strong>Global</strong>NCAP.aspx, accessed 12 October 2012).<br />
44. EuroNCAP. <strong>Pedestrian</strong> testing protocol: version 5.3.1. Brussels, European New Car Assessment Programme, 2012.<br />
45. 1998 Agreement on global technical regulations [website]. (http://www.unece.org/trans/main/wp29/<br />
wp29wgs/wp29gen/wp29glob.html, accessed 16 January 2013).<br />
46. McLean AJ. Vehicle design for pedestrian protection. Adelaide, University of Adelaide Centre for Automotive<br />
<strong>Safety</strong> Research, 2005 (CASR037).<br />
47. Long AD, Ponte G, Anderson RWG. The CASR pedestrian crash analysis: at-scene investigation, computer<br />
simulation and sub-system reconstruction. Journal of Biomechanics, 2007, 40(S2): S216.<br />
48. Improved test methods to evaluate pedestrian protection afforded by passenger cars. Geneva, UNECE, EEVC<br />
Working Group 17 Report, 1998 with 2002 updates (www.unece.org/trans/doc/2006/wp29grsp/ps-187e.doc,<br />
accessed 16 January 2013).<br />
49. Haider AH et al. Mechanism of injury predicts case fatality and functional outcomes in pediatric trauma<br />
patients: the case for its use in trauma outcomes studies. Journal of Pediatric Surgery, 2011, 46: 1557–1563.<br />
50. Chakravarthy B et al. Pediatric pedestrian injuries: emergency care considerations. Pediatric Emergency Care,<br />
2007, 23: 738–744.<br />
51. Earlam R. Trauma helicopter. [website] (http://www.richardearlam.com/TraumaHelicopter.html, accessed<br />
22 January 2013).<br />
52. European <strong>Road</strong> <strong>Safety</strong> Observatory. [website] (www.erso.eu, accessed 16 January 2013).<br />
53. Härtl R et al. Direct transport within an organized state trauma system reduces mortality in patients with<br />
severe traumatic brain injury. Journal of Trauma, 2006, 60: 1250–1256.<br />
54. Sasser S et al. Pre-hospital trauma care systems. Geneva, World Health Organization, 2005.<br />
55. Utter GH et al. Inclusive trauma systems: do they improve triage or outcomes of the severely injured? Journal<br />
of Trauma, 2006, 60: 529–535.<br />
56. Ali J et al. Trauma outcome improves following the advanced trauma life support program in a developing<br />
country. Journal of J Trauma, 1993, 34: 890–898.<br />
57. Collicott PE, Hughes I. Training in advanced trauma life support. Journal of American Medical Association,<br />
1980, 243: 1156–1159.<br />
58. Mock C et al. Essential trauma care guidelines. Geneva, World Health Organization, 2004.<br />
59. Trauma system agenda for the future [website] (http://www.nhtsa.gov/people/injury/ems/<br />
emstraumasystem03/vision.htm, accessed 21 September 2012).<br />
60. World report on disability. Geneva, World Health Organization, 2011.<br />
61. Petridou E et al. Injuries among disabled children: a study from Greece. Injury Prevention, 2003, 9: 226–230.<br />
62. Leff M et al. Disability, environmental barriers, and non-fatal injury. Injury Prevention, 2010, 16: 411–415.<br />
63. Sinclair SA, Xiang H. Injuries among US children with different types of disabilities. American Journal of<br />
Public Health, 2008, 98: 1510–1516.<br />
64. Xiang HY et al. Nonfatal injuries among US children with disabling conditions. American Journal of Public<br />
Health, 2005, 95: 1970–1975.<br />
65. Roberts I, Norton R. Sensory deficit and the risk of pedestrian injury. Injury Prevention, 1995, 1: 12–14.<br />
66. Mitullah W, Makajuma G. Analysis of non-motorised travel conditions on Jogoo road corridor in Nairobi. Cape<br />
Town, African Centre of Excellence for Studies in Public and Non-Motorised Transport, 2009 (Working Paper).<br />
92
<strong>Pedestrian</strong> <strong>safety</strong>: a road <strong>safety</strong> manual for decision-makers and practitioners<br />
67. Lundäiv J. Self-experiences of mobility and injury events in the traffic environment among physical impaired<br />
and disabled people as unprotected pedestrians and wheelchair riders in Sweden: a follow-up study.<br />
International Journal of Rehabilitation Research, 2005, 28: 349–350.<br />
68. Powaseu I, James K. Travelling together: partnering with people with disabilities on participatory research into<br />
road infrastructure in Papua New Guinea. Paper presented to University of Sydney Symposium on World<br />
Report on Disability, 6 December 2011.<br />
69. Hersh M, Ohene-Djan J, Naqvi S. Investigating road <strong>safety</strong> issues and deaf people in the United Kingdom:<br />
an empirical study and recommendations for good practice. Journal of Prevention and Intervention in the<br />
Community, 2010, 38: 290–305.<br />
70. Ohene-Djan J, Hersh M, Naqvi S. <strong>Road</strong> <strong>safety</strong> and deaf people: the role of the police. Journal of Prevention<br />
and Intervention in the Community, 2010, 38: 316–331.<br />
4: Implementing pedestrian <strong>safety</strong> interventions<br />
93
94<br />
Implementing pedestrian <strong>safety</strong> interventions
5<br />
Evaluating pedestrian<br />
<strong>safety</strong> programmes
5<br />
5.1 Evaluating pedestrian <strong>safety</strong> interventions. ............... 97<br />
Evaluating pedestrian<br />
<strong>safety</strong> programmes<br />
5.2 Advocating for pedestrian <strong>safety</strong>........................ 102<br />
5.3 Summary.............................................. 105<br />
References ................................................ 105
<strong>Pedestrian</strong> <strong>safety</strong>: a road <strong>safety</strong> manual for decision-makers and practitioners<br />
Module 4 provided a comprehensive overview and examples of the key<br />
interventions that can be implemented to improve pedestrian <strong>safety</strong>,<br />
emphasizing the need to integrate engineering, enforcement and educational<br />
approaches. This module goes on to discuss how to evaluate their impact as well as<br />
advocate for pedestrian <strong>safety</strong>.<br />
The module is divided into two sections:<br />
5.1 Evaluating pedestrian <strong>safety</strong> interventions: This section provides key principles<br />
for evaluating pedestrian <strong>safety</strong> interventions. It discusses the importance of planning<br />
in advance of evaluation and provides examples of indicators that may be used for<br />
process, output and outcome evaluation of pedestrian <strong>safety</strong> interventions.<br />
5.2 Advocating for pedestrian <strong>safety</strong>: This section presents key principles and<br />
examples of pedestrian <strong>safety</strong> advocacy. It emphasizes the need for a strategic<br />
approach that includes a sustained effort over a period of time, prioritizing focal<br />
areas, building coalitions, promoting evidence-based solutions and reviewing progress.<br />
5: Evaluating pedestrian <strong>safety</strong> programmes<br />
5.1 Evaluating pedestrian <strong>safety</strong> interventions<br />
Evaluation is a critical component of pedestrian <strong>safety</strong> interventions. A thorough<br />
evaluation, properly implemented, measures the effectiveness of the programme<br />
and assesses whether the desired outcomes are being achieved. It can enable the<br />
identification of success as well as constraints, and provide insights on how to adjust<br />
programmes so that targets are achieved. The results of evaluation are key inputs for<br />
decision-makers involved in pedestrian <strong>safety</strong> programmes. They also provide the<br />
content for dissemination and improvement of ideas and initiatives, and contribute<br />
to international learning.<br />
There may be some variation in the specific ways different agencies plan, choose<br />
evaluation methods and disseminate results, but the basic principles to bear in mind<br />
on evaluation of pedestrian <strong>safety</strong> programmes remain the same (1):<br />
Plan the evaluation. Ensure that monitoring and evaluation are included in any<br />
pedestrian <strong>safety</strong> plan (see Module 3), strategy or intervention at the national or local<br />
level. It is better to plan for evaluation from the beginning rather than doing so once<br />
implementation has begun. Determining the aims of evaluation, type of evaluation<br />
and indicators to adopt during the planning phase of a programme will improve the<br />
ultimate quality of the evaluation.<br />
Identify existing monitoring and evaluation activities in your setting, and the agencies<br />
that are responsible for these activities. This exercise helps with identification of<br />
relevant existing data and can develop partnerships with the existing agencies in<br />
monitoring and evaluation. Collect baseline data using surveys and existing databases<br />
if they exist.<br />
97
v<br />
Evaluating pedestrian <strong>safety</strong> programmes<br />
Identify suitable indicators to monitor processes, outputs and outcomes. Table 5.1<br />
presents a list of three main categories of indicators for monitoring and evaluating<br />
pedestrian <strong>safety</strong> programmes. You are encouraged to also look back at Module 3<br />
that presented a number of indicators on which data can be collected to monitor and<br />
evaluate progress in pedestrian <strong>safety</strong> programmes.<br />
Table 5.1<br />
Indicators for evaluating pedestrian <strong>safety</strong> programmes<br />
Type of indicator Purpose Examples<br />
Process<br />
To assess progress in<br />
Setting up a working group<br />
the process of change, • Conducting a situational assessment<br />
in order to show how the<br />
programme or activity<br />
has been implemented or<br />
executed<br />
• Implementing a plan of action<br />
Output<br />
To measure outputs<br />
or products that are<br />
attributable to the<br />
programme processes<br />
Outcome<br />
To measure the ultimate<br />
outcomes of implementing<br />
various activities<br />
• Preparing a pedestrian <strong>safety</strong> plan<br />
• Prioritizing pedestrian <strong>safety</strong> in national and<br />
local policies and programmes<br />
• Publishing and disseminating a pedestrian<br />
<strong>safety</strong> plan<br />
• Officially launching a pedestrian <strong>safety</strong> plan<br />
• Endorsement of a pedestrian <strong>safety</strong> plan by<br />
national or local government<br />
• Allocating human and financial resources to a<br />
pedestrian <strong>safety</strong> plan<br />
• Securing space for sidewalks<br />
• Increase in knowledge and awareness about<br />
risk factors for pedestrian injury<br />
• Change in behaviour: speed, drinking and<br />
driving, street crossing and yielding at<br />
pedestrian priority points<br />
• Reduction in pedestrian fatalities and injuries<br />
Conduct the evaluation consistently, as planned. Once the appropriate evaluation<br />
design and methods have been specified – with respect to the unit of analysis,<br />
population, sample, and methods of data collection and analysis – conduct the<br />
evaluation according to those methods. Data for evaluation can be collected by<br />
examining existing databases as well as conducting surveys, observations, testing of<br />
BAC in drivers and pedestrians, road <strong>safety</strong> audits and perception assessments (see<br />
Box 5.1). Many of the methods used for the situational assessment (see Module 3) are<br />
also applicable to evaluations.<br />
Use evaluation results to improve the programme, and inform the public and other<br />
stakeholders about successes or failures (see Box 5.2). The results of the evaluation need<br />
to be disseminated, discussed and used by programme staff, government, public and<br />
sponsors of pedestrian <strong>safety</strong> initiatives. These different groups need to consider what<br />
the programme can do better and what it can avoid in order to improve pedestrian<br />
<strong>safety</strong> in the setting of focus.<br />
98
<strong>Pedestrian</strong> <strong>safety</strong>: a road <strong>safety</strong> manual for decision-makers and practitioners<br />
BOX 5.1: <strong>Pedestrian</strong> overpass on a major highway in Kampala, Uganda<br />
Over 40% of people killed in road traffic crashes in<br />
Uganda in 2010 were pedestrians (2). Though walking<br />
is a dominant mode of transport in most African<br />
countries, road infrastructure facilities for pedestrians<br />
are generally inadequate or underdeveloped in<br />
both urban and rural areas (3,4).<br />
In an effort to address the <strong>safety</strong> of pedestrians, an<br />
overpass costing approximately US$ 100 000 was<br />
constructed at Nakawa Trading Centre, approximately<br />
six kilometres from Kampala city centre (5). This<br />
busy trading centre with many small retail shops,<br />
industries, a sports stadium, offices, low-cost residential<br />
estates and schools is on the Kampala–Jinja<br />
highway. The overpass was built in August 1998,<br />
when there was a heightened sense of the importance<br />
of road <strong>safety</strong> because the <strong>Road</strong> <strong>Safety</strong> Act<br />
had just been enacted and several crashes at the<br />
location provoked public outrage.<br />
An evaluation of the overpass conducted in 2002<br />
revealed the following results (5):<br />
• Just over one third of pedestrians used the<br />
overpass. Users were mostly female (49%) and<br />
children (79%). The low usage of the overpass<br />
reflected some of the design flaws, as well as the<br />
position of the overpass, which raised security<br />
concerns among users. Respondents were concerned<br />
that the overpass was untidy, poorly lit<br />
and that children loitered on it. Most pedestrians<br />
found the overpass to be inconvenient and difficult<br />
to access. Consequently, many pedestrians could<br />
be seen crossing the road through motorized traffic.<br />
No changes appeared to have been made to<br />
the overpass by July 2012.<br />
• While the number of pedestrians killed dropped<br />
from eight to two after it was constructed, the<br />
number of pedestrians seriously injured increased<br />
from 14 before construction to 17 afterwards.<br />
The mixed outcomes associated with this isolated<br />
intervention indicate the need for a comprehensive<br />
approach to pedestrian <strong>safety</strong>. Other measures such<br />
as reducing and enforcing vehicle speeds, providing<br />
raised crossings, providing sidewalks and raising<br />
awareness about these measures would have complemented<br />
the overpass.<br />
©2012 Olive Kobusingye<br />
5: Evaluating pedestrian <strong>safety</strong> programmes<br />
99
Evaluating pedestrian <strong>safety</strong> programmes<br />
Box 5.2: Sustained implementation and evaluation of pedestrian <strong>safety</strong><br />
measures in New York City<br />
New York City is known for improvement in pedestrian<br />
<strong>safety</strong> in particular, and road <strong>safety</strong> in general (6).<br />
A major factor in the declining pedestrian fatality<br />
rate in New York City is continued implementation<br />
of <strong>safety</strong> measures and evaluation of their performance.<br />
The annual pedestrian fatality rate declined<br />
steadily from 5.8 deaths per 100 000 population<br />
in the 1950s to 2.0 per 100 000 population in the<br />
decade 2000–2009 (7).<br />
The recent pedestrian <strong>safety</strong> efforts in the city<br />
demonstrate the importance of a comprehensive<br />
approach to pedestrian <strong>safety</strong>. In 2008, aiming to<br />
sustain or accelerate the decline in pedestrian fatality,<br />
the Department of Transportation of New York City<br />
set a target of reducing annual road traffic fatalities<br />
by 50% from 2007 levels by 2030, that is, from<br />
274 to 137. Data revealed that pedestrian fatalities<br />
made up 52% of all road traffic fatalities in New York<br />
City in the period 2005–2009. <strong>Pedestrian</strong> <strong>safety</strong> was<br />
therefore identified as a key area for improvement.<br />
To develop an effective pedestrian <strong>safety</strong> strategy,<br />
more than 7000 severe and fatal pedestrian injury<br />
crashes in New York City were analyzed, to identify the<br />
causes, risk factors and spatial distribution of these<br />
crashes. The analysis revealed the following (7):<br />
• <strong>Pedestrian</strong>s were ten times more likely to die than<br />
motor vehicle occupants in the event of a crash.<br />
• Driver inattention was cited in nearly 36% of<br />
crashes resulting in pedestrians being killed or<br />
seriously injured.<br />
• 27% of crashes that killed or seriously injured<br />
pedestrians involved driver failure to yield, while<br />
turning at an intersection.<br />
• Unsafe speed and limited sight distance were<br />
cited as risk factors in 21% of fatal and serious<br />
pedestrian crashes.<br />
• 8% of all fatal pedestrian crashes involved a driver<br />
who had been drinking. However this may be an<br />
underestimate since data suggest that drivers<br />
leave the scene in about 21% of the fatal and serious<br />
injury crashes.<br />
• 80% of crashes that killed or seriously injured<br />
pedestrians involved male drivers.<br />
• Most residents of New York City did not know<br />
that the standard speed limit for city streets is<br />
30 km/h.<br />
• 47% of pedestrian fatalities occurred on major<br />
two-way streets in Manhattan, a borough that contains<br />
the region’s two largest business districts.<br />
• 74% of pedestrian crashes occurred at intersections,<br />
with 47% of pedestrian fatalities and severe<br />
injuries occurring at signalized intersections and<br />
57% of the crashes taking place while the pedestrian<br />
was crossing with the signal.<br />
BEFORE:<br />
New York City Department of Transportation<br />
100
• 79% of the crashes that killed or seriously injured<br />
pedestrians involved private vehicles as opposed<br />
to taxis, trucks and buses.<br />
• Senior pedestrians (over 65 years old) accounted<br />
for 38% of all pedestrian fatalities and 28% of<br />
severe injuries.<br />
• Manhattan had four times as many pedestrians<br />
killed or severely injured per mile of street compared<br />
to the other four boroughs.<br />
• 43% of pedestrians killed in Manhattan lived in<br />
another borough or outside of New York City.<br />
• 40% of pedestrian crashes occurred in the late<br />
afternoon and/or early evening.<br />
• Late night pedestrian crashes were nearly twice<br />
as deadly as other time periods.<br />
<strong>Pedestrian</strong> <strong>safety</strong>: a road <strong>safety</strong> manual for decision-makers and practitioners<br />
• installation of pedestrian countdown signals at<br />
1500 intersections;<br />
• implementing 75 additional 30km/h hour school<br />
speed zones;<br />
• implementing Neighbourhood Slow Zones in several<br />
neighbourhoods citywide, where the speed<br />
limit will be reduced to 30 km/h; and<br />
• conducting public information campaigns and<br />
enforcement targeting speeding along major corridors<br />
and intersections where drivers commonly<br />
fail to yield.<br />
In addition to pedestrian <strong>safety</strong> measures, there are<br />
a number of other measures being implemented in<br />
order to reduce road traffic injuries and fatalities in<br />
general (6).<br />
5: Evaluating pedestrian <strong>safety</strong> programmes<br />
The New York City Department of Transportation<br />
formulated a pedestrian <strong>safety</strong> action plan involving<br />
other key agencies such as New York City Police<br />
Department, New York City Department of Health<br />
and Mental Hygiene, and New York State Department<br />
of Motor Vehicles. The action plan focuses on a<br />
combination of highly targeted engineering, enforcement<br />
and education/public information measures.<br />
Implementation began immediately, starting with<br />
strengthening already existing actions. Many measures<br />
set out in the plan that have been implemented<br />
already include:<br />
• redesign of 30 kilometres of high-crash corridors<br />
annually;<br />
An evaluation of 13 recent <strong>safety</strong> measures<br />
implemented in New York City included pedestrian<br />
interventions such as all pedestrian phase, highvisibility<br />
crossings, increasing pedestrian crossing<br />
time, split-phase timing, pedestrian fencing, road<br />
diet (reduction in the number of travel lanes, with<br />
added turning lanes), speed hump and speed limit<br />
reduction (6). Split-phase timing, signal installations,<br />
high-visibility crossings, all pedestrian phase and<br />
increasing pedestrian crossing time were found to<br />
reduce pedestrian and total crashes by 25–51%.<br />
Measures with lesser effect were posted speed<br />
limit reduction signs, and middle block pedestrian<br />
fencing (6).<br />
AFTER:<br />
New York City Department of Transportation<br />
101
Evaluating pedestrian <strong>safety</strong> programmes<br />
5.2 Advocating for pedestrian <strong>safety</strong><br />
Even a locally tailored evidence-based plan of action is not a guarantee of lasting<br />
results once implemented. The natural order of many institutions is to resist change.<br />
When change is required to bring about greater equity and justice, considerable<br />
pressure may be needed to effect that change, especially when the issue or group in<br />
question traditionally has been overlooked. Advocacy or pressure groups can be key<br />
to creating conditions that foster policy and programme change (see Box 5.3). Advocacy<br />
seeks to raise awareness of an issue for the purpose of influencing the policies,<br />
programmes and resources devoted to it (8).<br />
BOX 5.3: Living Streets<br />
In 1929, a group of people became concerned about<br />
the rising tide of automobile use and the associated<br />
rise in deaths of people walking in the UK. They<br />
decided to take action and form the <strong>Pedestrian</strong>s<br />
Association, which became Living Streets in<br />
2001. This group has been the national voice for<br />
pedestrians in the UK throughout its history. In the<br />
early years, their campaigning led to the introduction<br />
of the driving test, zebra crossings, and 50 km/h<br />
speed limits. Today, they influence decision-makers<br />
nationally and locally, run projects to encourage<br />
people to walk, and work to create safe, attractive<br />
and enjoyable streets, where people want to walk.<br />
They have local groups throughout the country, and<br />
they get more than 1.6 million children involved in<br />
their ‘Walk to School’ campaign each year.<br />
Advocacy for pedestrian <strong>safety</strong> takes many forms including (9):<br />
• urging public officials to change policies, plans, and projects to be more<br />
accommodating to pedestrian <strong>safety</strong> and travel;<br />
• promoting the importance of safe walking and creating broader demand for safe,<br />
walkable communities (see Box 5.4);<br />
• providing expertise for the benefit of communities;<br />
• urging community leaders or public officials to narrow streets, install walk signals<br />
and widen sidewalks;<br />
• sponsoring neighbourhood walks to introduce the public to the benefits and joys<br />
of walking;<br />
• testifying at hearings; and<br />
• demonstrating in the streets to raise awareness of unsafe pedestrian walking routes.<br />
102
BOX 5.4: ‘Living End <strong>Road</strong>s’<br />
The International Federation of <strong>Pedestrian</strong>s (IFP) was<br />
founded in 1963 as the umbrella organization for<br />
national pedestrian advocacy groups. In 2005 IFP<br />
was reorganized with the support of the Swiss <strong>Pedestrian</strong><br />
Association and a private foundation, and it is<br />
now a growing network of pedestrian associations<br />
from around the world, as well as other institutions<br />
and people interested in walking. The goal of IFP is<br />
to promote and defend the right to full access and<br />
mobility for people walking. To translate these goals<br />
into policies, IFP works towards preventing road traffic<br />
crashes and injuries.<br />
IFP represents the interests of the pedestrian at<br />
the international level, working with agencies of<br />
the United Nations and the European Union, and<br />
cooperates with a wide range of nongovernment<br />
organizations. A long-term commitment by IFP in the<br />
past decades has been to represent the concerns of<br />
walking road users on technical committees of the<br />
United Nations Economic Commission for Europe.<br />
In recent years, the IFP has begun to undertake pilot<br />
<strong>Pedestrian</strong> <strong>safety</strong>: a road <strong>safety</strong> manual for decision-makers and practitioners<br />
projects such as the Living End <strong>Road</strong> project, which<br />
seeks to persuade jurisdictions to update their signage<br />
about ‘dead end’ roads where pedestrians or<br />
cyclists may go through.<br />
The Living End <strong>Road</strong>s project builds on a frequent<br />
discrepancy in road signage: streets marked with a<br />
dead-end sign are often dead ends only for cars, while<br />
they may be the preferred and safer route for cyclists<br />
and pedestrians. IFP provides local pedestrian associations<br />
with a set of tools to help the municipalities<br />
make simple changes to the signs – where legally<br />
permitted – so that pedestrians and cyclists receive<br />
the appropriate information. While the direct output<br />
typically is a straightforward improvement in road signage,<br />
the real value of the Living End <strong>Road</strong> project is<br />
that it may encourage local traffic engineers to think<br />
‘outside the box’ by taking the needs of pedestrians<br />
and cyclists more readily into account. Within the<br />
process, the pedestrian associations can position<br />
themselves as a partner of the municipality and part<br />
of the solution.<br />
Source: 8<br />
5: Evaluating pedestrian <strong>safety</strong> programmes<br />
Living end road<br />
(pedestrians)<br />
Living end road<br />
(pedestrians and cyclists)<br />
Dead end for all<br />
103
Evaluating pedestrian <strong>safety</strong> programmes<br />
How groups advocate depends partly upon the personal styles and skills of their<br />
leaders, as well as their political connections. Whatever the skills and strengths of<br />
the core group, the following six principles apply to most pedestrian <strong>safety</strong> advocacy<br />
efforts (8,10):<br />
1. Make a long-term commitment: Change is rarely achieved overnight, and<br />
even in the best-performing countries it has taken years to achieve a decrease in<br />
pedestrian traffic fatalities. Advocacy for policy change on behalf of pedestrian <strong>safety</strong><br />
entails seemingly endless hours of effort, including service on advisory committees,<br />
tracking and evaluating projects and plans, providing comments and testimony,<br />
and advocating for changes to standard operating procedures such as street design<br />
standards and crossing marking policies. Persistence and commitment in the long<br />
term are required for success.<br />
2. Prioritize focal areas: Take a strategic approach by identifying and focusing on<br />
a few key priorities at once. Setting priority areas requires a good assessment of the<br />
road <strong>safety</strong> and political situation in the local setting (see Module 3). Instead of<br />
engaging in a broad range of activities that may not always yield results, it is better<br />
to target advocacy efforts carefully, to make the best use of the limited time and<br />
resources, in favour of the greatest potential gains. Advocacy groups must be realistic<br />
about what their staff and partners can achieve, and take on a limited number of<br />
projects each year, especially in the first years of operation.<br />
3. Promote evidence-based solutions: It is critical to ensure that efforts are based<br />
on the best scientific evidence. Nongovernmental organizations should engage in<br />
an ongoing dialogue with road <strong>safety</strong> experts in order to stay informed about the<br />
latest knowledge and practice from the field and use that understanding to enhance<br />
ongoing research and activities. In certain settings, the best scientific evidence may<br />
contradict the common understanding, and nongovernmental organizations can play<br />
a role in resolving this conflict.<br />
4. Utilize existing resources: It is helpful to make use of existing materials and<br />
resources in order to avoid duplication of effort. Many organizations offer materials<br />
that can be used to support national and local road <strong>safety</strong> initiatives. These should be<br />
tailored for relevant audiences and translated into appropriate languages.<br />
5. Build an advocacy network: It is vital to engage with partners. Few nongovernmental<br />
organizations are able to succeed without the support of partners from<br />
government, academia, the private sector, foundations or agencies such as the police,<br />
fire department and medical services. They also gain by reaching out to other nongovernmental<br />
organizations to coordinate messages, support one another’s activities<br />
and generate resources. The importance of engaging with partners, promoting similar<br />
actions and speaking as a community with one voice cannot be overstated.<br />
6. Review progress regularly: While most advocacy efforts contribute to general<br />
awareness raising, targeted advocacy can most effectively contribute to concrete<br />
and measurable change. Even when an organization lacks the capacity to monitor<br />
104
<strong>Pedestrian</strong> <strong>safety</strong>: a road <strong>safety</strong> manual for decision-makers and practitioners<br />
its programmes in detail, it is useful to make a conscious effort to identify some<br />
measures of success before activities begin. These measures should then be used to<br />
compare progress before and after the advocacy effort to determine if that effort<br />
needs to be redirected or redesigned in some way.<br />
Advocacy groups can facilitate implementation of the measures presented in<br />
Module 4 by:<br />
• raising awareness about pedestrian <strong>safety</strong>;<br />
• drawing the attention of local and national governments to the need to prioritize<br />
pedestrian <strong>safety</strong> in policies and programmes;<br />
• mobilizing action at the local level to implement pedestrian <strong>safety</strong> measures;<br />
• generating public demand for pedestrian <strong>safety</strong> measures; and<br />
• championing the <strong>safety</strong> rights of children, as well as elderly and disabled<br />
pedestrians (see Boxes 4.1 and 4.11).<br />
5: Evaluating pedestrian <strong>safety</strong> programmes<br />
5.3 Summary<br />
The content presented in this module is summarized as follows:<br />
• Evaluation is an integral component of implementation. It is necessary to plan<br />
for evaluation with regard to aims, objectives, evaluator, indicators, methods and<br />
dissemination of results. Evaluation planning should precede implementation.<br />
• Advocacy groups can have a significant role in creating conditions that foster the<br />
implementation of pedestrian <strong>safety</strong> measures.<br />
References<br />
1. Zegeer CV. How to develop a pedestrian <strong>safety</strong> action plan. Final report. Washington, D.C., Federal Highway<br />
Administration, 2009 (FHWA-SA-05–12).<br />
2. <strong>Global</strong> status report on road <strong>safety</strong> 2013: supporting a decade of action. Geneva, World Health Organization, 2013.<br />
3. Howe J. The headloading & footpath economy: walking in Sub-Saharan Africa. World Transport Policy &<br />
Practice, 2001, 7: 8–12.<br />
4. Sietchiping R, Permezel MJ, Ngomsi C. Transport and mobility in sub-Saharan African cities: an overview of<br />
practices, lessons and options for improvement. Cities, 2012, 29: 183–189.<br />
5. Mutto M, Kobusingye OC, Lett RR. The effect of an overpass on pedestrian injuries on a major highway in<br />
Kampala – Uganda. African Health Sciences, 2002, 2: 89–93.<br />
6. Chen L et al. <strong>Safety</strong> countermeasures and crash reduction in New York City – experience and lessons learned.<br />
Accident Analysis & Prevention (in press).<br />
7. Viola R, Roe M, Shin H. The New York City pedestrian <strong>safety</strong> study and action plan. New York, New York City<br />
Department of Transportation, 2010.<br />
8. Advocating for road <strong>safety</strong> and road traffic injury victims: a guide for nongovernmental organizations. Geneva,<br />
World Health Organization, 2012.<br />
9. America Walks. Toolbox for pedestrian advocates. Boston, America Walks, 2002. [website]<br />
(http://americawalks.org/advocates/, accessed 23 January 2013).<br />
10. Vanderslice E. Fundamentals of pedestrian advocacy. In: Tolley R. ed. Sustainable transport: planning for<br />
walking and cycling in urban environments. Boca Raton, CRC Press, 2003: 375–383.<br />
105
106<br />
Evaluating pedestrian <strong>safety</strong> programmes
AAppendices
Appendices<br />
Appendix 1: A comprehensive framework for<br />
safe walking: strategic principles. ............... 109<br />
Appendix 2: Traffic-calming measures........................ 111
<strong>Pedestrian</strong> <strong>safety</strong>: a road <strong>safety</strong> manual for decision-makers and practitioners<br />
Appendix 1<br />
Appendix 1<br />
A comprehensive framework for safe<br />
walking: strategic principles<br />
The International Charter for Walking provides a comprehensive framework for<br />
understanding the needs of people on foot and the actions to be undertaken to<br />
provide safe, sustainable, healthy and efficient communities where people choose<br />
to walk. Built on extensive discussions with experts around the world, the charter<br />
presents eight strategic principles, each with a practical list of actions that can<br />
be undertaken in most communities (1). An explanation of each of the eight<br />
principles follows:<br />
• Increased inclusive mobility: People have accessible streets, squares, buildings and<br />
public transport systems regardless of their age, ability, gender, income level,<br />
language, ethnic, cultural or religious background, which strengthen the freedom<br />
and autonomy of all people, and contribute to social inclusion.<br />
• Well designed and managed spaces and places for people: Healthy, convenient and<br />
attractive environments tailored to the needs of people, so they can freely enjoy<br />
the amenities of public areas in comfort and <strong>safety</strong> away from intrusive noise<br />
and pollution.<br />
• Improved integration of networks: A network of connected, direct and easy to<br />
follow walking routes which are safe, comfortable, attractive and well maintained,<br />
linking homes, shops, schools, parks, public transport interchanges, green spaces<br />
and other important destinations.<br />
• Supportive land-use and spatial planning: Land-use and spatial planning policies<br />
that allow people to walk to the majority of everyday services and facilities,<br />
maximizing the opportunities for walking, reducing car dependency and<br />
contributing to community life.<br />
• Reduced road danger: Streets to be designed and managed to prevent crashes and<br />
to be enjoyable, safe and convenient for people walking – especially children, the<br />
elderly and people with limited abilities. This includes enacting and enforcing road<br />
<strong>safety</strong> laws.<br />
• Less crime and fear of crime: An urban environment designed, maintained and<br />
policed to reduce crime and the fear of crime, giving people the confidence to<br />
choose to walk.<br />
• More supportive authorities: Authorities provide for, support and safeguard<br />
people’s ability and choice to walk through policies and programmes to improve<br />
infrastructure and provide information and inspiration to walk.<br />
109
Appendix 1<br />
• A culture of walking: People are given opportunities to celebrate and enjoy walking<br />
as part of their everyday social, cultural and political life. This includes providing<br />
up-to-date, good quality, accessible information on where they can walk, how to<br />
stay safe and the quality of the experience to expect.<br />
Reference<br />
1. Walk21. International Charter for Walking: Creating healthy, efficient and sustainable communities where people<br />
choose to walk [website] (http://www.walk21.com/charter/default.asp, accessed 9 January 2013).<br />
110
<strong>Pedestrian</strong> <strong>safety</strong>: a road <strong>safety</strong> manual for decision-makers and practitioners<br />
Appendix 2<br />
Appendix 2<br />
Traffic-calming measures<br />
This appendix provides a brief description of various vehicle speed management<br />
measures, with a particular focus on traffic-calming interventions to enable readers<br />
to distinguish their basic characteristics (1, 2). For the specification of design<br />
requirements, we recommend that guidelines approved in your jurisdiction are<br />
also consulted.<br />
Chicane<br />
A chicane consists of alternately placed kerb extensions into the street. This design<br />
creates a horizontal shift in traffic and narrows the roadway down either a single<br />
lane or two narrow lanes. Motorists are obligated to slow their speed to manoeuvre<br />
through the chicane. Good visibility for drivers and pedestrians can be maintained<br />
by either planting low shrubs or groundcover, or by using trees with high canopies.<br />
The design of a chicane must consider the needs of not just drivers but also<br />
pedestrians and cyclists. As in the serpentine street design (see page 113), chicanes<br />
must take into account driveway access and parking needs.<br />
Choker<br />
Chokers are kerb extensions that narrow a street by widening the sidewalks or<br />
planting strips. The street may be narrowed from two lanes to a single lane or to two<br />
narrow lanes. Motorists are obligated to slow and, in cases with just one lane, to stop<br />
to allow oncoming vehicles to pass. Chokers must be wide enough to accommodate<br />
emergency and sanitation vehicles.<br />
Kerb extension<br />
Kerb extensions, also known as ‘bulbouts’ or ‘neckdowns’, extend the sidewalk or<br />
kerb line out into the parking lane, thereby reducing the effective street width. These<br />
serve to shorten the pedestrian crossing distance, narrow the roadway, and improve<br />
the ability of pedestrians and motorists to see each other. Kerb extensions also<br />
prevent motorists from parking in, or too close to, crossings, or from blocking kerb<br />
ramps. Kerb extensions should only be used where there is a parking lane. Installation<br />
of kerb extensions should consider the special needs of larger vehicles (such as fire<br />
trucks and school buses) to turn including options for such vehicles to turn from the<br />
outer lane rather than the normal turning lane. Street furniture and landscaping on<br />
and near the kerb extension should be chosen carefully to ensure sight distance. Kerb<br />
extensions should also be designed to facilitate adequate water drainage.<br />
Kerb radius reduction<br />
A common type of vehicle–pedestrian collision occurs when a pedestrian is struck<br />
by a right-turning vehicle at an intersection in right-hand-drive areas (the opposite<br />
is true in left-hand-drive locations). Large kerb radii encourage motorists to make<br />
111
Appendix 2<br />
right turns at higher speeds, increasing the risk to pedestrians. Reducing the kerb<br />
radius creates a tighter turn and results in motorists making right turns at lower, and<br />
therefore safer speeds. Other important benefits of reduced kerb radii are shorter<br />
crossing distances for pedestrians and improved sight distances between pedestrians<br />
and motorists. Larger kerb radii have been determined to be helpful for older drivers.<br />
They also are needed for safe turning by larger vehicles such as fire trucks, school<br />
buses, moving vans, and delivery trucks.<br />
Mini-circle<br />
Mini-circles are raised circular islands constructed in the centre of residential street<br />
intersections. Intended to reduce vehicle speeds by forcing motorists to manoeuvre<br />
around them, mini-circles may be appropriate at intersections where traffic volumes<br />
do not warrant a signal or stop sign. A series of intersections along a local street<br />
could be treated as part of a neighbourhood traffic improvement programme to<br />
improve pedestrian <strong>safety</strong> and also beautify the neighbourhood. Tight kerb radii<br />
should accompany mini-circles to discourage motorists from making high-speed<br />
turns. Mini-circles with cuts in ‘splitter’ islands make crossing easier for pedestrians,<br />
especially those in wheelchairs. Larger vehicles such as fire trucks and school buses,<br />
can be accommodated by creating a mountable kerb on the outer portion of the<br />
circle. Mini-circle landscaping should not block sight distance – groundcover, short<br />
shrubs, or trees with tall canopies may be used. Yield controls should be used.<br />
Modern roundabout<br />
A modern roundabout is built with a large, often circular, raised island located in the<br />
centre of the intersection of a street with one or more crossing roadways. Motorists<br />
enter the circle, travel around it, and then turn onto the desired street. All entering<br />
traffic yields to vehicles approaching from within the roundabout. A roundabout is<br />
intended to be applied where vehicular delay can be maintained at or below levels<br />
experienced by stop or signal controlled intersections. Because of this, they can<br />
sometimes be installed on two-lane roadways in lieu of a road widening to four lanes.<br />
Modern roundabouts can be relatively friendly to pedestrians if they have splitter<br />
islands on each approach to the roundabout and are designed to slow traffic prior to<br />
entering the roundabout. The splitter islands can serve as a refuge for pedestrians and<br />
make crossing safer. There is lingering concern, however, about <strong>safety</strong> for visuallyimpaired<br />
pedestrians at roundabouts. Accessible pedestrian signals and truncated<br />
domes placed at splitter islands can assist visually impaired pedestrians with gap<br />
selection and ‘wayfinding’. In larger roundabouts, an off-road bicycle path may be<br />
used to allow bicyclists to use the pedestrian route.<br />
<strong>Pedestrian</strong> refuge islands and raised medians<br />
Raised pedestrian refuge islands, or medians, at crossing locations along roadways,<br />
provide another strategy to reduce pedestrian exposure to motor vehicles. Also called<br />
‘centre islands’ or ‘pedestrian islands’, refuge islands and medians that are raised<br />
(i.e. not just painted) provide pedestrians with more secure places of refuge during<br />
street crossing. This simplifies the crossing manoeuvre for pedestrians by creating<br />
112
<strong>Pedestrian</strong> <strong>safety</strong>: a road <strong>safety</strong> manual for decision-makers and practitioners<br />
Appendix 2<br />
the equivalent of two narrower one-way streets instead of one wide two-way street.<br />
Landscaping can be used on medians but should be chosen carefully to ensure<br />
adequate sight distance between motorists and pedestrians, including children,<br />
wheelchair users, and others with reduced sight distance. Design of raised medians<br />
must also consider vehicle turning movements carefully so that motorists do not<br />
travel on inappropriate routes, such as residential streets, or make unsafe u-turns.<br />
Raised median designs must also accommodate pedestrians with visual impairments<br />
through use of tactile cues at the border between the pedestrian refuge area and the<br />
motorized vehicle roadway and for pedestrians in wheelchairs through the use of<br />
kerb ramps or cut-throughs.<br />
Raised intersections<br />
Raised intersections are intended to slow all vehicular movements through an<br />
intersection. They are built by raising the entire intersection to the level of the<br />
sidewalk. The crossings on each approach may also be elevated, so that pedestrians<br />
cross at the same level as the sidewalk, without the need for kerb ramps. Raised<br />
crossings can be an urban design element through the use of special paving materials.<br />
Detectable warning strips mark the boundary between the sidewalk and the street<br />
for pedestrians with vision impairments.<br />
Serpentine street<br />
A serpentine street uses a winding pattern with built-in visual enhancements. These<br />
allow vehicles to move through slowly and prevent fast driving. Landscaping can be<br />
used to enhance visual appeal and create a park-like atmosphere. Serpentine street<br />
design needs to be coordinated with driveway access and parking needs. Serpentine<br />
streets offer many advantages, but are more costly than other equally effective traffic<br />
calming strategies.<br />
Speed humps and speed tables<br />
A speed hump is a rounded raised area placed across the roadway. Speed humps are<br />
generally negotiated easily on bicycles and should be built through any bicycle lanes<br />
present on the roadway so that motorists do not swerve into the bicycle lane to avoid<br />
the hump. Flat-top speed humps are also referred to as speed tables.<br />
Woonerf<br />
Woonerf is a Dutch word that translates as ‘living street’. Typically used on<br />
residential streets, a woonerf is a space shared by pedestrians, bicyclists, and lowspeed<br />
motor vehicles. It is usually constructed with a narrow width and without<br />
kerbs or sidewalks. Vehicles are slowed by placing trees, parking areas and other<br />
obstacles in the street. Along with improving pedestrian <strong>safety</strong>, a woonerf creates a<br />
public space for social and possibly commercial activities, as well as a play area for<br />
children. A woonerf identification sign is placed at each street entrance. A woonerf<br />
must be constructed to allow access by emergency vehicles, school buses, and other<br />
service vehicles.<br />
113
Appendix 2<br />
References<br />
1. Zeeger CV et al. Guidance for implementation of AASHTO strategic highway <strong>safety</strong> plan: Volume 10: A guide<br />
for reducing collisions involving pedestrians. Washington, DC, Transportation Research Board, 2004.<br />
2. Vanderschuren M, Jobanputra R. Traffic calming measures: review and analysis. Cape Town, African Centre of<br />
Excellence for Studies in Public and Non-motorized Transport, 2009 (Working Paper 16–02).<br />
114
World Health Organization<br />
20 Avenue Appia<br />
1211 Geneva 27<br />
Switzerland<br />
E-mail: traffic@who.int<br />
Web: www.who.int/road<strong>safety</strong>/en/<br />
ISBN 978-92-4-150535-2