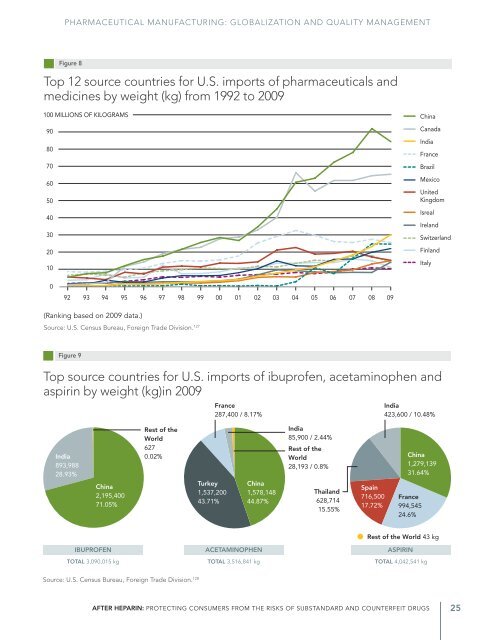
—Chapter 1— from Brazil grew in a similar fashion, mainly because of increased importation of lysine, a dietary supplement. While pharmaceutical and medical imports from the eight developed nations * decreased as a proportion of total imports over this period (dropping from 57 to 43 percent), imports from China and India combined significantly increased their share (up from 11 to 29 percent). 110 Focus: China <strong>The</strong> United States is the number one destination for Chinese pharmaceutical raw material exports—a $2.2 billion business each year. 111 In particular, China is a major source for older and off-patent pharmaceutical ingredients in medicines sold in the United States. 112,113,† U.S. Census Bureau data from 2009 indicate that the United States imported large quantities of three major OTC pain relievers: ibuprofen, acetaminophen and aspirin (3 million, 3.5 million and 4 million kilograms, respectively). 114 For all three products, the largest portion of imports came from China (see figure 9). China is also a major source of a number of older antibiotics. Ninety-four percent of imported tetracycline salts, an important class of antibiotics, originated in China from 2006 to 2008, as did three-quarters of imported streptomycin derivatives and salts used in injectable antibiotics and eye drops. 115 <strong>The</strong> Chinese bulk pharmaceutical market grows by about 20 percent in production value each year, 116 and China is home to thousands of domestic manufacturing facilities. 117 <strong>The</strong> FDA has estimated that as many as 920 manufacturing plants in China may manufacture U.S. drugs and the ingredients used in them, and therefore may be subject to inspection by the FDA, 118 an increase from 714 such sites in 2007. 119 Focus: India Indian pharmaceutical companies are actively pursuing U.S. market share. 120,121 India was the third-largest source of U.S.-imported pharmaceuticals and medicines by weight in 2009, 122 and as of 2007, India produced about 20 percent of the world’s generic medicines. 123,124 Indian plants are increasingly named in abbreviated new drug applications (ANDA), which companies file for approval to market generic pharmaceutical products. FDA estimates indicate that 40 percent of the active pharmaceutical ingredient factories listed in U.S. generic drug applications in FY 2009 were based in India, while 10 percent were sites in the United States. This is a change from FY 1997, when Indian API plants represented just 6 percent of those named in ANDAs. 125 As of June 11, 2010, Indian companies had filed 2,234 drug master files (DMFs) with the FDA, more than 30 percent of all active drug product DMFs and the most filed by companies in any country, including the United States, according to an analysis by India’s Pharmaceutical Export Promotion Council. 126 DMFs document the facilities, processes or articles used during drug manufacture and are normally a part of drug marketing applications. * Canada, France, the United Kingdom, Israel, Ireland, Switzerland, Finland and Italy † Many newer drug products aren’t individually identified in the specific data retrieved from the United States International Trade Commission, which lists commodities by 10-digit HTS code, and are therefore more difficult to track. 24 <strong>Pew</strong> Health Group
PHARMACEUTICAL MANUFACTURING: GLOBALIZATION AND QUALITY MANAGEMENT Figure 8 Top 12 source countries for U.S. imports of pharmaceuticals and medicines by weight (kg) from 1992 to 2009 100 MILLIONS OF KILOGRAMS 90 80 70 60 50 40 30 20 10 China Canada India France Brazil Mexico United Kingdom Isreal Ireland Switzerland Finland Italy 0 92 93 94 95 96 97 98 99 00 01 02 03 04 05 06 07 08 09 (Ranking based on 2009 data.) Source: U.S. Census Bureau, Foreign Trade Division. 127 Figure 9 Top source countries for U.S. imports of ibuprofen, acetaminophen and aspirin by weight (kg)in 2009 France 287,400 / 8.17% India 423,600 / 10.48% India 893,988 28.93% China 2,195,400 71.05% Rest of the World 627 0.02% Turkey 1,537,200 43.71% China 1,578,148 44.87% India 85,900 / 2.44% Rest of the World 28,193 / 0.8% Thailand 628,714 15.55% Spain 716,500 17.72% China 1,279,139 31.64% France 994,545 24.6% Rest of the World 43 kg IBUPROFEN ACETAMINOPHEN ASPIRIN TOTAL 3,090,015 kg TOTAL 3,516,841 kg TOTAL 4,042,541 kg Source: U.S. Census Bureau, Foreign Trade Division. 128 <strong>After</strong> <strong>Heparin</strong>: PRotecting Consumers from the Risks of Substandard and Counterfeit Drugs 25