Ouvrir - Phonak
Ouvrir - Phonak
Ouvrir - Phonak

You also want an ePaper? Increase the reach of your titles
YUMPU automatically turns print PDFs into web optimized ePapers that Google loves.
C HAPTER<br />
FOUR<br />
Auditory Access in Public Areas:<br />
Issues and Options<br />
Matthew H. Bakke, Cynthia L. Compton and M. Ross<br />
Introduction<br />
Assistive Listening Systems (ALS) are widely<br />
used in the United States to provide access for people<br />
with hearing loss to auditory information in public<br />
spaces such as theaters, auditoriums and lecture<br />
halls. Among the many effects of hearing loss is the<br />
increased need, relative to those with normal hearing,<br />
for a clear signal without interference from noise<br />
and reverberation. Many ALS are available to meet<br />
this need, and can be categorized according to the<br />
carrier that they use to move the signal from the<br />
microphone or other signal source to the receiver<br />
used by the listener. The most common carrier signals<br />
available on the market are FM radio (FM),<br />
Infrared light (IR) and Magnetic Induction, or<br />
“Induction Loop” (IL).<br />
A recent resurgence of interest in ALS dates from<br />
the passage of the Americans with Disabilities Act in<br />
l990. Among the many provisions that can affect<br />
people with hearing loss, the law requires that any<br />
business (auditoriums, theaters, movie houses, etc.)<br />
with 50 or more fixed seats in an assembly area must<br />
make assistive listening devices available for at least<br />
4% of the seating capacity (note that the law does<br />
not apply to houses of worship). Nothing in the law<br />
designates the type of ALS that should be provided in<br />
the different venues in which they can be used or the<br />
nature and adequacy of the receiving devices. Nor<br />
are installation or performance standards, at either<br />
the transmission or the receiving end, included in<br />
the implementing regulations. In taking advantage of<br />
Address correspondence to: Matthew H. Bakke, Gallaudet University,<br />
Rehabilitation Engineering Research Center on Hearing<br />
Enhancement, Department of Hearing, Speech and Language<br />
Sciences, 800 Florida Avenue, NE, Washington, DC 20002, USA,<br />
(202) 651–5335 (V/TTY), (202) 651–5324 (Fax)<br />
the law, hard of hearing people often find themselves<br />
victims of uncertainty. When “everything works<br />
well,” an ALS will substantially improve communication<br />
access. Instead of feeling frustrated, angry and<br />
isolated by a poor listening experience, hard of hearing<br />
people can relax, enjoy the performance, and continue<br />
their engagement in social/cultural activities.<br />
Unfortunately, Murphy’s Law (“whatever can go<br />
wrong, will”) describes too many real-life experiences.<br />
Even when things go right, hard of hearing people<br />
often report an underlying uncertainty, based on<br />
their own or other’s prior experiences, that something<br />
will occur to interfere with the realization of the full<br />
benefit of an ALS.<br />
We have identified four interdependent, dynamic<br />
factors that are necessary to achieve successful access<br />
to sound in public areas. They include:<br />
1. Quality of the signal – Is the quality of the signal<br />
at the ear of the user sufficient for good auditory<br />
access?<br />
2. Availability of the system – Is a working system<br />
available when needed?<br />
3. Ease of Use – Is the system user-friendly?<br />
4. Quality of the fitting – Does the listener have the<br />
appropriate technology, and is it correctly<br />
matched to his/her hearing needs?<br />
This paper will report on empirical data related to<br />
the required signal quality of large area ALS as well<br />
as documented consumer concerns regarding public<br />
access. We will also share our clinical observations<br />
over many years at Gallaudet University regarding<br />
ease of use and methods to ensure quality of fitting.<br />
We will end with some recommendations regarding<br />
future research and development<br />
61
62 a ACCESS: Achieving Clear Communication Employing Sound Solutions<br />
Quality of Signal: Developing ALS<br />
Performance Standards for People with<br />
Hearing Loss<br />
This data comes from work conducted by the<br />
Rehabilitation Engineering Research Center on<br />
Hearing Enhancement (RERC-HE) at the Lexington<br />
Center for the Deaf in New York under a contract to<br />
the United States Architectural and Transportation<br />
Compliance Board (U.S. Access Board). As a consumer-driven<br />
project, the first step was to convene a<br />
consumer focus group, in which hard of hearing<br />
people discussed the problems they encountered with<br />
ALS and offered their perspectives on how the situation<br />
could be improved. Later a second focus group<br />
was convened, this one composed of the representatives<br />
from manufacturers, installers, and large-scale<br />
users of such systems (theaters and movie houses).<br />
Finally, a third meeting was held, attended by participants<br />
of both the previous groups, plus representatives<br />
from the National Systems Contractors<br />
Association (NSCA). In parallel with this series of<br />
focus groups, empirical data was collected to inform<br />
the U.S. Access Board on the aspects of signal clarity<br />
that needed to be addressed in any standards that<br />
might be proposed to ensure access to sound in public<br />
places in the United States.<br />
The objective of this study was to establish guidelines<br />
for specifying the acceptable output characteristics<br />
of assistive listening devices for people with<br />
hearing loss. Fifty-nine adult listeners (49 with hearing<br />
loss and 10 without) listened binaurally to sentence<br />
materials that were subjected to three different<br />
types of distortion; reverberation and background<br />
noise, internally-generated induction loop noise, and<br />
peak clipping. The listeners provided ratings as to the<br />
quality of the materials presented. A minimally<br />
acceptable criterion was selected and results for the<br />
listeners with hearing loss were compared with that<br />
criterion to arrive at:<br />
1. Minimally acceptable output and dynamic range<br />
levels,<br />
2. Minimally acceptable Speech Transmission Index<br />
(STI) level,<br />
3. Minimally acceptable signal-to-noise ratio for<br />
internally generated noise, and<br />
4. Minimally acceptable peak clipping level.<br />
Participants<br />
Forty-nine adult listeners with sensorineural<br />
hearing loss participated in this study. They were divided<br />
into six groups according the degree and configuration<br />
of their hearing loss. The following is a list<br />
of criteria for inclusion in each group:<br />
• Very high frequency hearing loss: the threefrequency<br />
pure tone average (PTA) is less than 41<br />
dB HL with thresholds at 2000 Hz less than 40<br />
dB HL.<br />
•<br />
Moderate flat hearing loss: PTA is greater than 41<br />
dB HL with threshold at 2000 Hz less than 55 dB<br />
HL.<br />
•<br />
Moderately-severe, gently sloping hearing loss:<br />
PTA is greater than 41 dB HL with threshold at<br />
2000 Hz between 55 and 60 dB HL.<br />
•<br />
Moderate to severe flat hearing loss: PTA is<br />
greater than 41 dB HL with thresholds at 2000<br />
Hz between 61 and 70 dB HL.<br />
•<br />
Moderate to severe sloping hearing loss: PTA is<br />
greater than 41 dB HL with thresholds at 2000<br />
Hz greater than 70 dB HL.<br />
•<br />
Precipitous, high- frequency hearing loss: PTA is<br />
less than 41 d B HL with thresholds at 2000 Hz<br />
greater than 40 dB HL.<br />
Stimuli<br />
Six pairs of sentences (one male and one female<br />
talker) were selected from the corpus of the Lexington<br />
Dialogue Sentences. These materials were developed<br />
at Lexington specifically for evaluation of hearing<br />
aids. The six pairs of Lexington Dialogue Sentences<br />
selected were as follows:<br />
1. I would like to try these shoes.<br />
What size shoes do you wear?<br />
2. Where did you go to school?<br />
I went to school in New York City<br />
3. That bookcase fits in nicely with your other<br />
furniture.<br />
I tried to find the perfect place for it.<br />
4. Did you do anything special over the weekend?<br />
I went to the movies and read a lot.<br />
5. The basket is on the table.<br />
It is filled with beautiful flowers.<br />
6. Did you watch the movie on television last night?<br />
No, I watched a documentary instead.
Auditory Access in Public Areas: Issues and Options a 63<br />
The original sentences were subjected to three<br />
types of distortion created under either live or computer<br />
simulated listening conditions. Stimuli for the<br />
reverberation plus noise condition were recorded in<br />
three separate environments: a classroom, an auditorium,<br />
and a conference room. For the teleloop noise<br />
and peak clipping conditions digital signal processing<br />
techniques were used to simulate real-world listening<br />
conditions. The following is a brief description of how<br />
the three types of stimuli were prepared:<br />
1. Reverberation Plus Noise<br />
In three separate recording environments sentence<br />
materials were delivered from a B & K artificial<br />
mouth at successive distances from the recording<br />
microphone. The environments were selected to represent<br />
those where a person with hearing loss is likely<br />
to encounter an assistive listening system: a classroom,<br />
a conference room, and an auditorium. A high<br />
quality microphone attached to a sound level meter<br />
picked up the signals and delivered them to a digital<br />
audio tape recorder. Speech Transmission Index (STI)<br />
measurements were made immediately following the<br />
recording of each sentence pair at each microphone<br />
location. The recorded signals were then re-digitized<br />
and stored onto a computer disk for presentation during<br />
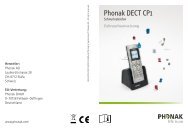
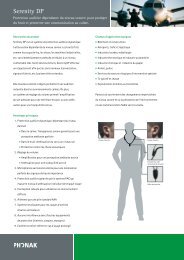
the experiment. Figure 1 shows the STI at each of<br />
the recording distances from the microphone.<br />
Note that STI values for the conference room at<br />
equivalent distances to those for the other rooms were<br />
Figure 1. Speech Transmission Index (STI) as a function of speaker/listener<br />
(microphone) distance in the three recording environments for the reverberation<br />
plus noise condition.<br />
comparatively quite poor. This is because of the constant<br />
background noise created by the ventilation<br />
system in the conference room.<br />
2. Induction Loop Noise<br />
A digital recording was made of the noise created<br />
by a poorly installed induction loop. This noise was<br />
digitally mixed with the original sentences at six signal<br />
to noise ratios ranging from 0 to 30 dB in 6 dB<br />
steps. The noise largely consists of a background<br />
“buzz” and a high-frequency hiss.<br />
3. Peak Clipping<br />
The signals were symmetrically clipped at six different<br />
levels down from the peak level.<br />
The following outline summarizes the three listening<br />
conditions.<br />
1. Reverberation and background noise –<br />
expressed as distance from the recording<br />
microphone. Also shown are the corresponding<br />
STI measurements.<br />
A. Auditorium<br />
Distance STI<br />
3 feet 0.842<br />
6 feet 0.777<br />
9 feet 0.729<br />
12 feet 0.632<br />
15 feet 0.506<br />
B. Conference Room<br />
Distance STI<br />
3 feet 0.562<br />
3.5 feet 0.566<br />
6 feet 0.561<br />
7.5 feet 0.523<br />
9 feet 0.512<br />
C. Classroom<br />
Distance STI<br />
3 inches 0.965<br />
12 inches 0.889<br />
24 inches 0.816<br />
48 inches 0.785<br />
96 inches 0.748<br />
120 inches 0.731
64 a ACCESS: Achieving Clear Communication Employing Sound Solutions<br />
2. Internally Generated Induction Loop Noise –<br />
expressed as signal to noise ratio of the RMS of<br />
speech to the RMS of noise<br />
0 dB<br />
6 dB<br />
12 dB<br />
18 dB<br />
24 dB<br />
30 dB<br />
3. Peak clipping – expressed in level down from<br />
the peak amplitude<br />
6 dB<br />
12 dB<br />
18 dB<br />
24 dB<br />
30 dB<br />
36 dB<br />
Apparatus<br />
Listeners were seated in a sound treated booth<br />
wearing TDH 49 earphones mounted in MX 41AR<br />
cushions. Stimuli were delivered binaurally at a comfortable<br />
listening level. The level of the signal was the<br />
same for both ears. Signal delivery and data collection<br />
were controlled by a personal computer.<br />
Listeners were tested in five blocks of trials for<br />
each of the listening conditions. Sentences were<br />
always presented in female/male question/reply<br />
pairs. Pairs for each level of distortion were presented<br />
six times. The protocol consisted of a pretest phase in<br />
which sentence pairs were presented in two orders<br />
from greatest degradation to quiet and quiet to greatest<br />
degradation. Following the pretest phase, the<br />
remaining four pairs of sentences for each level of distortion<br />
were presented in random order. The final<br />
result for each listener represents an average of the<br />
four rating responses for each sub-condition recorded<br />
following the pretest phase.<br />
Results and Discussion<br />
Listening Level<br />
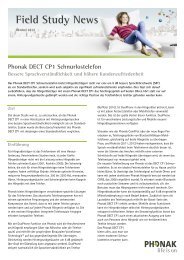
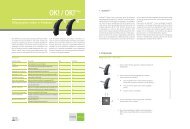
Figure 2 shows the range of preferred listening<br />
levels selected by the listeners who participated in<br />
this study. The highest level of 111 dB SPL was<br />
selected by a listener with a moderate-to-severe flat<br />
hearing loss. The dB SPL values were referenced to<br />
the level of a 1000 Hz calibration tone whose RMS<br />
level is equivalent to the average RMS level of the<br />
sentences.<br />
Procedure<br />
To adjust to a comfortable listening<br />
level the listeners were instructed<br />
to indicate the level of quiet,<br />
undistorted sentences that they felt<br />
they could listen to for a very long<br />
time.<br />
Listeners were instructed to<br />
judge the quality of the test sentences<br />
by selecting one of the following<br />
ratings.<br />
1. Excellent<br />
2. Good<br />
(I would purchase a ticket for<br />
a show)<br />
3. Marginal<br />
(I may or may not purchase<br />
a ticket for a show)<br />
4. Unacceptable<br />
(I would not purchase a ticket<br />
for a show)<br />
Figure 2. Subject-selected preferred listening levels as a function of 3-<br />
frequency pure tone average for the 59 listeners who participated in this study.<br />
The level of the signal was the same for both ears. The circles represent the<br />
combined pure tone averages (both ears) for each of the listeners with hearing<br />
loss. The X’s represent the combined pure tone averages for each of the listeners<br />
without hearing loss.
Auditory Access in Public Areas: Issues and Options a 65<br />
Ratings<br />
Because all of the groups rated the quality of the<br />
sentences similarly, recommendations stemming<br />
from this report are independent of degree of hearing<br />
impairment. Results, however, for the 10 listeners<br />
without hearing loss were excluded in arriving at the<br />
recommendations. Furthermore, in the interest of<br />
being more inclusive, the 75th percentile was chosen<br />
over the median (50th percentile). As opposed to an<br />
average (mean or median), which does not take into<br />
account those listeners with more strict listening criteria,<br />
the ratings for 75 percent of the listeners with<br />
hearing loss were considered in arriving at the<br />
recommendations.<br />
A minimally acceptable rating of 2.25 was chosen.<br />
This value represents the average if a listener rated<br />
at least one of the four presentations for a particular<br />
sub-condition as good: marginal (2), marginal (2),<br />
marginal (2), and good (3). Tables 1 through 5 show<br />
Table 1. Seventy-fifth percentile ratings for the Auditorium<br />
condition. In parentheses following each sub-condition are the<br />
corresponding STI values.<br />
Quiet<br />
3 feet<br />
(.842)<br />
6 feet<br />
(.777)<br />
9 feet<br />
(.729)<br />
12 feet<br />
(.632)<br />
15 feet<br />
(.506)<br />
3.25 2.25 1.81 1.56 1.25 1.00<br />
Table 2. Seventy-fifth percentile ratings for the Classroom<br />
condition. In parentheses following each sub-condition are the<br />
corresponding STI values.<br />
Quiet<br />
3 inches<br />
(.965)<br />
1 foot<br />
(.889)<br />
2 feet<br />
(.816)<br />
4 feet<br />
(.785)<br />
8 feet<br />
(.748)<br />
10 feet<br />
(.731)<br />
3.25 2.75 2.75 2.5 2.0 2.0 1.25<br />
Table 3. Seventy-fifth percentile ratings for the Conference<br />
Room condition. In parentheses following the sub-condition are<br />
the corresponding STI values.<br />
Quiet<br />
3 feet<br />
(.562)<br />
4 1/2 feet<br />
(.566)<br />
6 feet<br />
(.561)<br />
7 1/2 feet<br />
(.523)<br />
3.50 1.75 1.75 1.63 1.5 1.5<br />
9 feet<br />
(.512)<br />
Table 4. Seventy-fifth percentile ratings for the Induction Loop<br />
noise condition.<br />
Quiet 30 dB<br />
S/N<br />
24 dB<br />
S/N<br />
18 dB<br />
S/N<br />
12 dB<br />
S/N<br />
6 dB<br />
S/N<br />
0 dB<br />
S/N<br />
3.13 3.00 2.88 2.63 2.13 1.50 1.00<br />
Table 5. Seventy-fifth percentile ratings for the Peak Clipping<br />
condition.<br />
Quiet 6 dB 12 dB 18 dB 24 dB 30 dB 36 dB<br />
3.00 2.88 2.75 2.25 1.75 1.50 1.00<br />
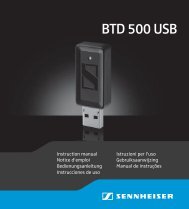
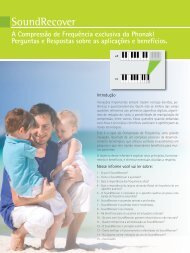
Figure 3. Seventy-fifth percentile ratings for each experimental group as a<br />
function of the speech transmission index. The diagonal line represents the best<br />
fit first order regression line to the data. Also shown is the equation that corresponds<br />
with the line and the STI value of .84 that results from the equation with<br />
2.25 as the minimum acceptable rating.<br />
the rating level above which 75 percent<br />
of the listeners’ scores fell for each of the<br />
five listening conditions. Values that are<br />
below the minimal criterion of 2.25 are<br />
both italicized and highlighted. For the<br />
auditorium condition the microphone<br />
distance cannot be greater than 3 feet<br />
from the talker. For the classroom condition<br />
the microphone distance cannot<br />
be greater than 2 feet from the talker.<br />
For the conference room condition all of<br />
the microphone distances were judged<br />
to be unacceptable. For the induction<br />
loop condition the signal-to-noise ratio<br />
cannot be poorer than 18 dB. Finally,<br />
for the peak clipping condition the level<br />
of peak clipping down from the peak<br />
level cannot exceed 18 dB.<br />
Figure 3 shows 75 th percentile ratings<br />
as a function of the STI results<br />
from the reverberation plus noise conditions<br />
combined for the three different
66 a ACCESS: Achieving Clear Communication Employing Sound Solutions<br />
environments. Also shown on this graph is the best<br />
fit, first order regression line to the data. For a minimally<br />
acceptable criterion of 2.25 the STI value cannot<br />
be less than 0.84. Note that with our criteria (a<br />
2.25 rating for 75% of the listeners and an STI value<br />
of .84) only a few data points can be found in the<br />
unacceptable region. Note that these two data points<br />
(x’s) are for Group 5 with the greatest degree of hearing<br />
loss.<br />
The STI was chosen as the criterion metric over a<br />
simple distance measure because different STI values<br />
can be recorded at the same distance depending on<br />
the level of the background noise in the environment<br />
(See figure 1).<br />
Documented User Concerns<br />
In addition to the research (reported above) that<br />
led to the recommendations for signal clarity, a series<br />
of focus groups were convened in which hard of hearing<br />
people discussed the problems they encountered<br />
with ALS and offered their perspectives on how the<br />
situation could be improved. From these discussions<br />
four lists of consumer concerns were derived, organized<br />
into four categories: Concerns about signal quality<br />
(Electroacoustics), installation-related concerns,<br />
logistics-related concerns, and advertising/signagerelated<br />
concerns. Table 6 lists the major concerns<br />
expressed by the participants:<br />
Table 6. Major concerns of consumers related to ALS in Public Places<br />
Availability of hearing aid coupling • •<br />
users’ equipment (e.g., neckloop)<br />
•<br />
Signal Quality (Electroacoustics)<br />
Microphone location in live performance •<br />
Need for universal plug on receivers to couple with<br />
Wide dynamic range in movie sound tracks •<br />
ALDs unavailable in all movies of multiplex<br />
Variations: same systems/different theaters<br />
IR “hum” and reflections off metal objects<br />
• “T” coil interference<br />
•<br />
User-friendly receivers are desirable<br />
System check-out/check-in<br />
•<br />
•<br />
hearing people<br />
•<br />
Telecoils in hearing aids vary significantly<br />
Stereo sound with binaural BTE or ITE<br />
• Bleed from headphones<br />
Installation-related<br />
Variations in receivers under same listening<br />
conditions<br />
Dead spots for reception in theaters<br />
Appropriate use of FM vs. IR vs. Loop<br />
FM interference<br />
“Pass-around” microphone availability (for discussion<br />
situations)<br />
Logistics-related<br />
Adequate numbers of units for groups of hard of<br />
Public education in use of device – Suggestion that<br />
a guide could be distributed with the units<br />
Monaural earbud should not be only option<br />
Personnel training for dispensers<br />
• Reliability of system functioning<br />
•<br />
Advertising/Signage-related<br />
• Inconsistent inclusion of ALD information in<br />
newspaper advertisements<br />
•<br />
Public media should present role models using<br />
ALDs (Public Education)<br />
Hearing aid interfaces, e.g., neckloop/silhouette<br />
• Need for more visible signage at the facilities
Auditory Access in Public Areas: Issues and Options a 67<br />
Recommendations<br />
Based upon these results, the following recommendations<br />
were made to the U.S. Access Board:<br />
Electroacoustic Performance Standards:<br />
Recommendations<br />
• That the speech signal meet or exceed a Speech<br />
Transmission Index (STI) of .84, measured at the<br />
earphones. (The STI is, in effect, a measure of<br />
reverberation and noise upon the integrity of the<br />
speech source; numbers lower than 1.0 reflect<br />
degrees of degradation of the originating signal).<br />
• That the system produce a signal-to-noise (S/N)<br />
ratio of at least 18 dB measured at the earphones.<br />
•<br />
That the receiver be capable of delivering a signal<br />
of at least 110 dB SPL and no greater than 118<br />
dB SPL measured at the earphone output. Volume<br />
controls should be included with a range of<br />
at least 50 dB.<br />
•<br />
That the peak clipping levels not exceed 18 dB<br />
down from the peak level of the signal.<br />
Logistical Considerations: Recommendations<br />
• Newspaper and other media advertisements<br />
should include information that the venue provides<br />
an ALS.<br />
• Recorded telephone information should include a<br />
comment that the venue provides an ALS.<br />
•<br />
Within each venue, there should be clear and visible<br />
signs that an ALS is available and exactly<br />
where the receivers can be obtained.<br />
•<br />
At each venue, information regarding the frequency<br />
of the FM and IR (sub-carrier) transmissions<br />
should be clearly posted for those<br />
consumers who bring their own receivers.<br />
•<br />
The same individual in the same physical location<br />
should be responsible for both the checking<br />
in and checking out of the receivers<br />
•<br />
This individual should be trained to operate,<br />
troubleshoot, and maintain the receivers. See<br />
report for a full listing of this person’s<br />
responsibilities.<br />
Receivers and Couplers: Recommendations<br />
• The output jack of all ALD receivers should<br />
accommodate a 1/8” (3.5mm) stereo plug using a<br />
TRS (tip, ring, sleeve) configuration, with the<br />
sleeve always carrying the ground. In mono systems<br />
the signal should be carried on the tip; in<br />
stereo systems, on the tip and the ring. This will<br />
permit the use of stereo earphones, direct audio<br />
input (DAI) cables, neckloops, cochlear implant<br />
patch cords, and silhouette inductors.<br />
• Discrete and highly visible and easy to use controls<br />
should be included in receivers that have the<br />
capacity to detect multiple channels or be capable<br />
of other electroacoustic modifications (e.g. volume<br />
and tone controls).<br />
•<br />
Single-channel receivers that contain only a<br />
minimum of external controls should be available<br />
for use at locations catering to elderly people (e.g.<br />
nursing homes, senior centers).<br />
• Receivers should include “low battery” lights than<br />
signal limited remaining battery life.<br />
•<br />
Coupling options should include headphone, earbuds,<br />
and neckloops. We suggest that at least one<br />
neckloop be available for every four air conduction<br />
type receivers.<br />
•<br />
Headphones should fit comfortably over all types<br />
of in-the-ear hearing aids and permit users to<br />
couple either inductively or acoustically to<br />
receivers. Furthermore, the “bleed” should not<br />
exceed the ambient noise at seats adjacent to the<br />
user.<br />
•<br />
It would be desirable for the industry to develop a<br />
“universal receiver”, one that can be (1) tuned to<br />
any FM frequency used in ALS in the 72–75 MHz<br />
or the 216–217 MHz range, either wide or narrow<br />
band channels, (2) adjusted to detect any of the<br />
sub-carriers used with IR systems, and (3)<br />
include a telecoil for usage with IL systems. The<br />
rationale for this is to provide consumers with the<br />
option of purchasing a personal ALS receiver, one<br />
that could be used in any venue.<br />
Installation: Recommendations<br />
The adequacy of the installation and the competency<br />
of the installers were a recurring theme in all<br />
the focus groups. While the competencies required for<br />
selecting and installing the appropriate ALS will differ<br />
depending upon the specific type of venue, all<br />
require some minimum information if the appropriate<br />
system is to be selected and installed properly.<br />
• We recommend that the Access Board sponsor<br />
workshops to train or update the training of ALS<br />
installers.
68 a ACCESS: Achieving Clear Communication Employing Sound Solutions<br />
• Such training programs can be a joint effort of<br />
consumer organizations, professional groups,<br />
industry, and such agencies as the Lexington<br />
RERC.<br />
•<br />
Training materials should be prepared independent<br />
of but also as a component of these training<br />
programs. Such material can consist of printed<br />
and video material, all suitable for dissemination<br />
on the internet.<br />
Clinical Observations<br />
Ease of Access/Use by Consumers<br />
Each of the documented concerns above has been<br />
echoed in the Audiology Clinic at Gallaudet<br />
University, which serves patients with a wide range<br />
of hearing difficulties in the Washington, DC metropolitan<br />
area. For the past 20 years we have been<br />
heavily involved in work with hearing assistance<br />
technology. Based on the reports of our patients, we<br />
feel that the problems experienced by consumers can<br />
be boiled down to two issues: (1) Ease of access to<br />
assistive technology and (2) ease of use. To put a<br />
more human face on the problem, let’s look at a sampling<br />
of common actual patient complaints is listed<br />
below:<br />
• When I ask for a wireless receiver at the box office<br />
window, they have no idea what I’m talking<br />
about.<br />
• When I obtain the receiver, the batteries are dead<br />
and/or the headphones are broken.<br />
• Why can’t I just use my own FM receiver or<br />
telecoil everywhere?<br />
•<br />
In the theater, often one microphone picks up the<br />
signal while the actors’ voices in the distance are<br />
inaudible.<br />
• My pet peeve is being handed an under-the-chin<br />
IR receivers with no neckloop.<br />
•<br />
Going to the movies is a hassle. First I have to<br />
borrow a device, and then I need to make sure it<br />
works. How it works is always different. And I<br />
have to write myself a mental note to get my ID<br />
back. It’s easier to stay home like a hermit with a<br />
good book and a glass of wine.<br />
•<br />
I wish I could listen to the sound system on an<br />
airplane with my hearing aid.<br />
In addition, two additional rather disturbing<br />
comments continue to be made, even by long-time<br />
users of amplification: (1) Why didn’t my audiologist<br />
recommend a telecoil?; (2) No one ever showed me<br />
how to use my telecoil with an ALD. I thought it was<br />
for the phone only!<br />
Fitting Complexity<br />
The frustration experienced by consumers is also<br />
experienced by the audiologists serving them. The<br />
current fitting process for providing auditory access in<br />
public (and private) places is intricate and can be<br />
time-consuming unless one has developed some<br />
expertise in this area. In order to provide consumers<br />
with appropriate technology and training, one must<br />
travel through a detailed needs assessment process<br />
that facilitates intimate knowledge of each patient’s<br />
lifestyle. This is necessary because receptive communication<br />
needs, and the technology to meet those<br />
needs, may vary, depending on the setting. For<br />
example, a patient with a severe sensorineural hearing<br />
loss who uses behind-the-ear (BTE) hearing aids,<br />
might be a great candidate for BTE FM at home<br />
where he or she can use this technology to better hear<br />
the television or the conversation of a loved one while<br />
riding in the car. However, if this same person works<br />
in a secure environment such as would be the case in<br />
the defense industry or at the CIA or other government<br />
agency, then FM technology would not be permitted<br />
due to security reasons. In this case, infrared<br />
or even hardwired systems might be required. If this<br />
same individual desires access to a movie theater, the<br />
recommendation of a BTE FM system does not guarantee<br />
access since various types of systems may be<br />
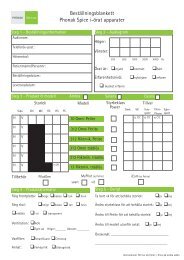
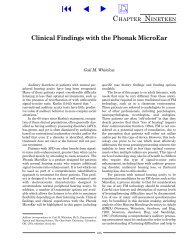
installed. Figure 4 shows a schematic of how modern<br />
day systems for public auditory access can vary – and<br />
thus be incompatible.<br />
All systems can be designed to provide acoustic or<br />
electrical input. Three types of transmission and<br />
reception modes are commonly available: FM, infrared<br />
(IR), and magnetic (loop). While all loop systems<br />
are compatible with each other, this is not the case<br />
with IR and FM systems. Wide band (WB) and narrowband<br />
(NB) FM systems are not compatible with<br />
each other. Each type of FM system can be broadcast<br />
on two different bands of the electromagnetic spectrum<br />
– 72–76 MHz or 216–217 MHz – and each of<br />
these bands can be divided up into various channels.<br />
A few years ago, 95 kHz was the de facto standard of<br />
transmission for IR systems. This is not the case<br />
today. While some systems do broadcast at 95 kHz,<br />
others use a combination of 95 KHz and 250 KHz<br />
(stereo systems) while newer systems use 2.3 and 2.8<br />
MHz (stereo). The complexity of interfacing to a hear-
Auditory Access in Public Areas: Issues and Options a 69<br />
Figure 4. Transmission and reception options for large ALS.<br />
ing assistance device can be daunting. For example,<br />
figure 5 before shows the “maze” of auditory options<br />
available to consumers.<br />
For example, three friends decide to attend the<br />
opera at the Kennedy Center (acoustic input), which<br />
is equipped with an IR system. Each patron borrows<br />
an under-the-chin headset. Friend #1 removes her inthe-canal<br />
(ITC) hearing aids because the headset’s<br />
built-in earbuds place too much pressure on them.<br />
Because she has a mild hearing loss, she simply turns<br />
up the IR headset to a comfortable level. Friend #2<br />
plugs a neckloop into a jack in the under-the-chin<br />
headset and uses her ITE hearing aids set to the telecoil<br />
mode. Friend #3 also uses a neckloop, but with<br />
her behind-the-ear (BTE) hearing aids set to telecoil<br />
mode. By further examining the various permutations<br />
“fitting maze” one can appreciate the fitting<br />
frustration experienced not only by consumers but<br />
also by the audiologists who must recommend<br />
appropriate technology.<br />
Figure 5. Interface options for auditory systems in public areas.
70 a ACCESS: Achieving Clear Communication Employing Sound Solutions<br />
Recommendations for Simplification of the<br />
Fitting Process<br />
Providing universal access to auditory systems in<br />
public areas is challenging for several reasons. First,<br />
the United States is a free-market economy. We cannot<br />
mandate the use of one particular technology, nor<br />
should we. Loop, FM, and IR systems all have their<br />
advantages and disadvantages. And companies representing<br />
these various technologies reserve the right<br />
to compete for a share of the market. However, we<br />
can, and should, mandate acoustical performance<br />
standards for all technologies. And, it would make<br />
sense for the industry to develop a “universal<br />
receiver” that can be either built into or externally<br />
interfaced to a hearing aid or headset (for those that<br />
do not use hearing aids). This would provide each<br />
consumer with access to any and all systems and<br />
would certainly simplify the fitting process. But until<br />
this happens, how do we navigate this “fitting maze”<br />
of options? Two approaches that have been used thus<br />
far, include pen and paper questionnaires and computerized<br />
needs assessment/selection tools.<br />
In the 1980s, Vaughn and Lightfoot (1987) were<br />
the first to publish a questionnaire designed to help<br />
match a listener’s receptive communication needs<br />
with the most appropriate hearing assistance technology.<br />
In 1989 and 2000, Compton expanded upon<br />
their questionnaire. In 1994, Grimes developed a<br />
clever two-page version of this questionnaire.<br />
A high-tech approach to the problem of needs<br />
assessment was offered by Palmer and Garstecki<br />
(1990), who developed a software program that not<br />
only lead the user through a decision tree of options,<br />
but also suggested products designed to meet those<br />
needs. According to Palmer (2003), this product did<br />
not succeed because it did not have the necessary<br />
ongoing support to keep it up to date.<br />
Currently, preparations are under way by the<br />
Rehabilitation Engineering Research Center on<br />
Hearing Enhancement to develop a new, web-based<br />
tool for needs assessment that could be used by consumers<br />
and/or audiologists. Since updating is critical,<br />
plans will be made to secure funding to update an<br />
sustain the product until such time that technology<br />
and standards are such that the needs assessment<br />
fitting process is significantly simplified.<br />
Acknowledgements<br />
This work was funded by the United States<br />
Access Board, and by the National the Institute<br />
on Disability and Rehabilitation Research (NIDRR)<br />
of the U.S. Department of Education under grant<br />
numbers H133E30015, H133E980010, and<br />
H133E010107. The opinions contained in this presentation<br />
are those of the grantee and do not necessarily<br />
reflect those of the US Access Board or the Department<br />
of Education.<br />
Special thanks go to Harry Levitt, Faye Erickson,<br />
and Deirdre Knight of the Lexington Center for the<br />
Deaf; and Mary Rose McEnerney of the Hackensack<br />
University Medical Center for their assistance in<br />
the design and execution of the research reported<br />
here.<br />
References<br />
Compton, C.L. (ed.) (Feb. 1989). Assistive Devices. Seminars<br />
In Hearing, NY: Thieme Medical Publishers,<br />
Inc. 10(1).<br />
Compton, C. (2000) In Alpiner, J. and McCarthy, P. (2000).<br />
Assistive Technology for Enhancement of Receptive<br />
Communication. Rehabilitation Audiology – Third<br />
Edition. Baltimore, Maryland: Williams and Wilkins.<br />
Compton, C. and Grimes, A. (1994) Assistive Technology<br />
for Deaf and Hard of Hearing People: Clinical<br />
Management of Technology Users/Marketing Issues.<br />
Workshop presented at the Siemens Hearing<br />
Instruments Educational Seminar, Hong Kong.<br />
Palmer, C. (2003). Personal Communication.<br />
Palmer, C. and Garstecki, D. (1989). A computer spreadsheet<br />
for locating assistive devices. Journal of the<br />
American Academy of Audiology, 21, 158–175.<br />
Palmer, C. (1992). Assistive devices in the audiology practice.<br />
American Journal of Audiology, 2, 37–57.<br />
Vaughn, G., and Lightfoot, K. (1987). Assistive listening<br />
devices, Part III. Hearing Instruments, 38 (2): 5.
Participant Survey<br />
Auditory Access in Public Areas: Issues and Options a 71