Phonon-mediated superconducting transitions in layered cuprate ...
Phonon-mediated superconducting transitions in layered cuprate ...
Phonon-mediated superconducting transitions in layered cuprate ...

You also want an ePaper? Increase the reach of your titles
YUMPU automatically turns print PDFs into web optimized ePapers that Google loves.
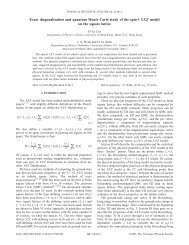
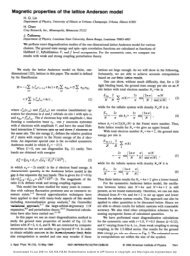
PHONON-MEDIATED SUPERCONDUCTING TRANSITIONS…<br />
n H = 1 2 − 1 tanh k − .<br />
5<br />
2 k 2k B T c<br />
Although the <strong>in</strong>terlayer tunnel<strong>in</strong>g has anisotropic s-wave<br />
symmetry and thus represents <strong>in</strong>terlayer s-wave pair<strong>in</strong>g, and<br />
the function gk has d-wave symmetry, 4 the solution of the<br />
gap equation <strong>in</strong> reality has pure d-wave symmetry, which has<br />
been revealed by the quasiparticle tunnel<strong>in</strong>g spectra of<br />
multilayer <strong>cuprate</strong>s. 50 The validity of the d-wave BCS formalism<br />
<strong>in</strong> describ<strong>in</strong>g the <strong>superconduct<strong>in</strong>g</strong> state of <strong>cuprate</strong>s<br />
has been supported by recent measurements of ARPES 51 and<br />
transport properties. 52,53<br />
Once know<strong>in</strong>g the dispersion k and the values of 0 , V,<br />
and/or V , one can obta<strong>in</strong> the T c behavior from Eqs. 4 and<br />
5. We chose a typical 0 =0.060 eV. The energy scale lies<br />
with<strong>in</strong> the k<strong>in</strong>k range of 0.050–0.080 eV from<br />
ARPES. 31–34 Far-<strong>in</strong>frared measurements 54 have established<br />
that the phonon modes scarcely change amongst the <strong>cuprate</strong>s<br />
irrespective of their T c changes. An unchanged mean boson<br />
energy of 52±8 meV for all dop<strong>in</strong>gs was recently detected<br />
by tunnel<strong>in</strong>g. 35 Thus, the choice of 0 =0.060 eV should capture<br />
the reasonable energy scale of the phonon cutoff frequency<br />
for <strong>cuprate</strong> superconductors.<br />
For the dispersion we use k =t eff cos k x cos k y<br />
+t eff cos 2k x +cos 2k y with t eff and t eff be<strong>in</strong>g the effective<br />
next-nearest-neighbor and next-next-nearest-neighbor hopp<strong>in</strong>gs,<br />
respectively. Such a dispersion can reproduce the<br />
bandwidth and Fermi-surface shape of many <strong>cuprate</strong><br />
superconductors. 55,56 Accord<strong>in</strong>g to the t-t-J model, t eff =J<br />
+2t and t eff =J/4, where J is the antiferromagnetic <strong>in</strong>teraction.<br />
Experiments and calculations give a J=0.128 eV which<br />
does not depend significantly on the compounds. 57 Values of<br />
J=0.128 eV and t eff =0.032 eV are hence expected to be a<br />
generally good representation for all Cu-O materials. For a<br />
homologous series, the t eff , t eff , and V values is assumed to be<br />
the same. Their T c difference for the materials hav<strong>in</strong>g different<br />
CuO 2 layers is only controlled by the <strong>in</strong>terlayer tunnel<strong>in</strong>g<br />
strength V . The value of V can be determ<strong>in</strong>ed by us<strong>in</strong>g the<br />
experimental values of the maximum <strong>superconduct<strong>in</strong>g</strong> transition<br />
temperature T max c for the monolayer and bilayer compounds<br />
<strong>in</strong> each homogeneous series.<br />
There is only a s<strong>in</strong>gle CuO 2 layer <strong>in</strong> the monolayer system<br />
V =0. The T max c value solely depends on the choice of<br />
t eff and V. The driv<strong>in</strong>g force of high-T c superconductivity is<br />
believed to come ma<strong>in</strong>ly from the almost same CuO 2 plane.<br />
One can reasonably assume a compound-<strong>in</strong>dependent V for<br />
these materials. Thus, the variation of T max c among different<br />
families is due to the change <strong>in</strong> t eff . It has been<br />
established 8,58,59 that a larger t eff or t is always <strong>in</strong> favor of a<br />
higher T max c . By us<strong>in</strong>g t eff =0.032 eV and chang<strong>in</strong>g t eff from<br />
−0.032 to 0.0914 eV, Eq. 4 bears the experimentally observed<br />
T max c rang<strong>in</strong>g from 30 to 97 K of various optimally<br />
doped monolayer <strong>cuprate</strong>s when tak<strong>in</strong>g V=0.037 62 eV.<br />
HgBa 2 CuO 4+ has the highest T max c =97 K amongst the<br />
monolayer <strong>cuprate</strong>s reported so far and thus has the largest<br />
t eff . Other optimally doped monolayer compounds with a<br />
T max c 97 K should have a smaller t or t eff . Therefore, we<br />
can estimate the relative t eff by us<strong>in</strong>g the experimentally observed<br />
T max c for an <strong>in</strong>dividual material.<br />
PHYSICAL REVIEW B 75, 134504 2007<br />
In choos<strong>in</strong>g the dispersion k , the quasiparticle band is<br />
considered to be the same for any member with<strong>in</strong> a homologous<br />
series. The universality of the low energy exitation of<br />
the Bi-based family has been revealed from ARPES<br />
measurements. 60–63 That is, the quasiparticle band is rather<br />
flat near ,0, while it is quite dispersive and def<strong>in</strong>es a clear<br />
Fermi cross<strong>in</strong>g along the 0,0-, direction. The dispersion<br />
used here has the overall features as observed. Although<br />
there is a small change of the electronic states due to bilayer<br />
band splitt<strong>in</strong>g, 62,64 the splitt<strong>in</strong>g is suppressed by strong<br />
many-body effects. 21 It has also been found 62 that the bilayer<br />
splitt<strong>in</strong>g is much smaller <strong>in</strong> the supercondut<strong>in</strong>g state than that<br />
<strong>in</strong> the normal state. We then assume safely that the bilayer<br />
splitt<strong>in</strong>g has no significant <strong>in</strong>fluence on the bulk <strong>superconduct<strong>in</strong>g</strong><br />
properties studied, although it may be necessary for<br />
<strong>in</strong>terpret<strong>in</strong>g anisotropic transport properties <strong>in</strong> the normal<br />
state. To clarify its orig<strong>in</strong>, more experimental studies on the<br />
multilayer <strong>cuprate</strong>s are needed.<br />
III. SUPERCONDUCTING TRANSITION TEMPERATURE<br />
We first exam<strong>in</strong>e how the phonon-<strong>mediated</strong> BCS-like<br />
model describes the T c behavior for <strong>layered</strong> <strong>cuprate</strong>s. We<br />
chose HgBa 2 Ca n−1 Cu n O 2n+2+ as an example because T c is<br />
highest both at ambient condition and under high pressure <strong>in</strong><br />
any member of this homologous series and it strongly depends<br />
on the number of CuO 2 layers. The structure of all<br />
these compounds is relatively simple, and furthermore, T c<br />
can be changed by dop<strong>in</strong>g level over a relatively wide regime.<br />
Thus, this homologous series is a very good candidate<br />
for studies.<br />
For mercury-based compounds, we take t eff =0.0914 eV,<br />
t eff =0.032 eV, and V=0.037 62 eV. 8 Such a choice can bear<br />
the experimentally observed T c versus n H behavior of<br />
HgBa 2 CuO 4+ with a maximum T c of 97 K at the optimal<br />
dop<strong>in</strong>g based on a d-wave BCS-like model without tak<strong>in</strong>g<br />
phonons <strong>in</strong>to account. 8 Meanwhile, the V /V ratio was estimated<br />
to be 0.0332 by tak<strong>in</strong>g the experimental values of T c<br />
of 97 and 127 K for the monolayer and bilayer mercurybased<br />
compounds, respectively. In order to keep the consistency<br />
of the theory, we use the same dispersion k , V, and V <br />
<strong>in</strong> the calculations.<br />
Figure 1 shows the calculated T c <strong>in</strong> the homologous series<br />
of HgBa 2 Ca n−1 Cu n O 2n+2+ as a function of the hole concentration<br />
n H . The obta<strong>in</strong>ed T c of all these materials varies parabolically<br />
with the dop<strong>in</strong>g level. This is a good agreement<br />
between the theory and experiments <strong>in</strong> the monolayer, bilayer,<br />
and trilayer compounds. 38,39 These results support the<br />
negligible phonon contribution to <strong>in</strong>terlayer coupl<strong>in</strong>g process.<br />
Increas<strong>in</strong>g the number of CuO 2 layers shifts upwards<br />
the whole T c versus n H curves. For the larger members, the<br />
relation between T c and n H becomes almost undist<strong>in</strong>guishable.<br />
All these features are consistent with those obta<strong>in</strong>ed<br />
from a d-wave BCS-like model. 8<br />
Figure 2 shows the CuO 2 -layer dependence of the calculated<br />
maximum T c <strong>in</strong> the homogeneous series of the optimally<br />
doped HgBa 2 Ca n−1 Cu n O 2n+2+ . The experimental data<br />
po<strong>in</strong>ts 11 are also plotted for comparison. As can be seen, T c<br />
<strong>in</strong>itially <strong>in</strong>creases with <strong>in</strong>creas<strong>in</strong>g the number CuO 2 layers<br />
134504-3