Phonon-mediated superconducting transitions in layered cuprate ...
Phonon-mediated superconducting transitions in layered cuprate ...
Phonon-mediated superconducting transitions in layered cuprate ...

Create successful ePaper yourself
Turn your PDF publications into a flip-book with our unique Google optimized e-Paper software.
PHONON-MEDIATED SUPERCONDUCTING TRANSITIONS…<br />
PHYSICAL REVIEW B 75, 134504 2007<br />
series. The systematic variation of T c among various copperoxide<br />
materials is believed to be dom<strong>in</strong>ated by the hopp<strong>in</strong>g<br />
parameter t eff . 8,58,72 Similar to the T c behavior, the difference<br />
between different <strong>superconduct<strong>in</strong>g</strong> series is also related<br />
to the band structures. With<strong>in</strong> a homologous series, the band<br />
structure used is assumed to be the same. Both the T c and <br />
difference among the materials hav<strong>in</strong>g different CuO 2 layers<br />
with<strong>in</strong> the unit cell is controlled by the <strong>in</strong>terlayer coupl<strong>in</strong>g<br />
between the adjacent CuO 2 layers which is naturally<br />
responsible for the CuO 2 layer dependence of the isotope<br />
effect. The <strong>in</strong>terlayer coupl<strong>in</strong>g has a tendency to enhance the<br />
T c value but to suppress the value.<br />
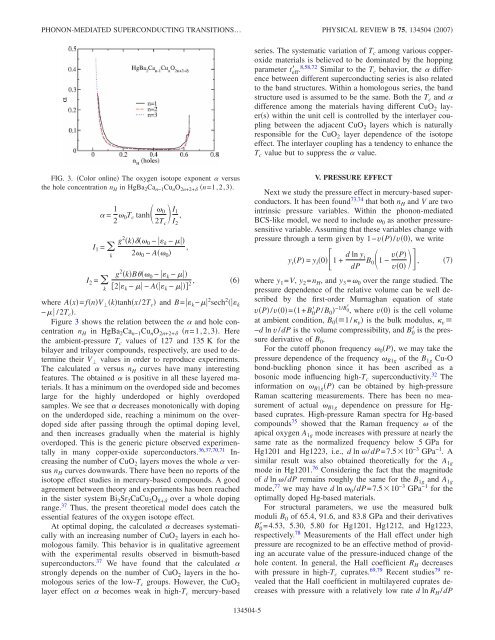
FIG. 3. Color onl<strong>in</strong>e The oxygen isotope exponent versus<br />
the hole concentration n H <strong>in</strong> HgBa 2 Ca n−1 Cu n O 2n+2+ n=1,2,3.<br />
= 1 2 0T c tanh 0<br />
2T c I 1<br />
I 2<br />
,<br />
I 1 = <br />
k<br />
I 2 = <br />
k<br />
g 2 k 0 − k − <br />
,<br />
2 0 − A 0 <br />
g 2 kB 0 − k − <br />
2 k − − A k − 2 ,<br />
where Ax= fnV ktanhx/2T c and B= k − 2 sech 2 k<br />
− /2T c .<br />
Figure 3 shows the relation between the and hole concentration<br />
n H <strong>in</strong> HgBa 2 Ca n−1 Cu n O 2n+2+ n=1,2,3. Here<br />
the ambient-pressure T c values of 127 and 135 K for the<br />
bilayer and trilayer compounds, respectively, are used to determ<strong>in</strong>e<br />
their V values <strong>in</strong> order to reproduce experiments.<br />
The calculated versus n H curves have many <strong>in</strong>terest<strong>in</strong>g<br />
features. The obta<strong>in</strong>ed is positive <strong>in</strong> all these <strong>layered</strong> materials.<br />
It has a m<strong>in</strong>imum on the overdoped side and becomes<br />
large for the highly underdoped or highly overdoped<br />
samples. We see that decreases monotonically with dop<strong>in</strong>g<br />
on the underdoped side, reach<strong>in</strong>g a m<strong>in</strong>imum on the overdoped<br />
side after pass<strong>in</strong>g through the optimal dop<strong>in</strong>g level,<br />
and then <strong>in</strong>creases gradually when the material is highly<br />
overdoped. This is the generic picture observed experimentally<br />
<strong>in</strong> many copper-oxide superconductors. 36,37,70,71 Increas<strong>in</strong>g<br />
the number of CuO 2 layers moves the whole versus<br />
n H curves downwards. There have been no reports of the<br />
isotope effect studies <strong>in</strong> mercury-based compounds. A good<br />
agreement between theory and experiments has been reached<br />
<strong>in</strong> the sister system Bi 2 Sr 2 CaCu 2 O 8+ over a whole dop<strong>in</strong>g<br />
range. 37 Thus, the present theoretical model does catch the<br />
essential features of the oxygen isotope effect.<br />
At optimal dop<strong>in</strong>g, the calculated decreases systematically<br />
with an <strong>in</strong>creas<strong>in</strong>g number of CuO 2 layers <strong>in</strong> each homologous<br />
family. This behavior is <strong>in</strong> qualitative agreement<br />
with the experimental results observed <strong>in</strong> bismuth-based<br />
superconductors. 37 We have found that the calculated <br />
strongly depends on the number of CuO 2 layers <strong>in</strong> the homologous<br />
series of the low-T c groups. However, the CuO 2<br />
layer effect on becomes weak <strong>in</strong> high-T c mercury-based<br />
6<br />
V. PRESSURE EFFECT<br />
Next we study the pressure effect <strong>in</strong> mercury-based superconductors.<br />
It has been found 73,74 that both n H and V are two<br />
<strong>in</strong>tr<strong>in</strong>sic pressure variables. With<strong>in</strong> the phonon-<strong>mediated</strong><br />
BCS-like model, we need to <strong>in</strong>clude 0 as another pressuresensitive<br />
variable. Assum<strong>in</strong>g that these variables change with<br />
pressure through a term given by 1−vP/v0, we write<br />
y i P = y i 01+ d ln y i<br />
dP B 01− vP 7<br />
v0,<br />
where y 1 =V, y 2 =n H , and y 3 = 0 over the range studied. The<br />
pressure dependence of the relative volume can be well described<br />
by the first-order Murnaghan equation of state<br />
vP/v0=1+B 0 P/B 0 −1/B 0 , where v0 is the cell volume<br />
at ambient condition, B 0 1/ v is the bulk modulus, v <br />
−d ln v/dP is the volume compressibility, and B 0 is the pressure<br />
derivative of B 0 .<br />
For the cutoff phonon frequency 0 P, we may take the<br />
pressure dependence of the frequency B1g of the B 1g Cu-O<br />
bond-buckl<strong>in</strong>g phonon s<strong>in</strong>ce it has been ascribed as a<br />
bosonic mode <strong>in</strong>fluenc<strong>in</strong>g high-T c superconductivity. 32 The<br />
<strong>in</strong>formation on B1g P can be obta<strong>in</strong>ed by high-pressure<br />
Raman scatter<strong>in</strong>g measurements. There has been no measurement<br />
of actual B1g dependence on pressure for Hgbased<br />
<strong>cuprate</strong>s. High-pressure Raman spectra for Hg-based<br />
compounds 75 showed that the Raman frequency of the<br />
apical oxygen A 1g mode <strong>in</strong>creases with pressure at nearly the<br />
same rate as the normalized frequency below 5 GPa for<br />
Hg1201 and Hg1223, i.e., d ln /dP=7.510 −3 GPa −1 .A<br />
similar result was also obta<strong>in</strong>ed theoretically for the A 1g<br />
mode <strong>in</strong> Hg1201. 76 Consider<strong>in</strong>g the fact that the magnitude<br />
of d ln /dP rema<strong>in</strong>s roughly the same for the B 1g and A 1g<br />
mode, 77 we may have d ln 0 /dP=7.510 −3 GPa −1 for the<br />
optimally doped Hg-based materials.<br />
For structural parameters, we use the measured bulk<br />
moduli B 0 of 65.4, 91.6, and 83.8 GPa and their derivatives<br />
B 0 =4.53, 5.30, 5.80 for Hg1201, Hg1212, and Hg1223,<br />
respectively. 78 Measurements of the Hall effect under high<br />
pressure are recognized to be an effective method of provid<strong>in</strong>g<br />
an accurate value of the pressure-<strong>in</strong>duced change of the<br />
hole content. In general, the Hall coefficient R H decreases<br />
with pressure <strong>in</strong> high-T c <strong>cuprate</strong>s. 69,79 Recent studies 79 revealed<br />
that the Hall coefficient <strong>in</strong> multi<strong>layered</strong> <strong>cuprate</strong>s decreases<br />
with pressure with a relatively low rate d ln R H /dP<br />
134504-5