Phonon-mediated superconducting transitions in layered cuprate ...
Phonon-mediated superconducting transitions in layered cuprate ...
Phonon-mediated superconducting transitions in layered cuprate ...

You also want an ePaper? Increase the reach of your titles
YUMPU automatically turns print PDFs into web optimized ePapers that Google loves.
CHEN et al.<br />
PHYSICAL REVIEW B 75, 134504 2007<br />
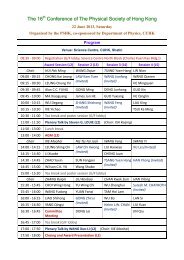
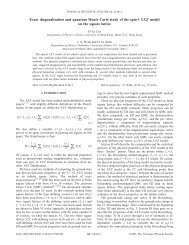
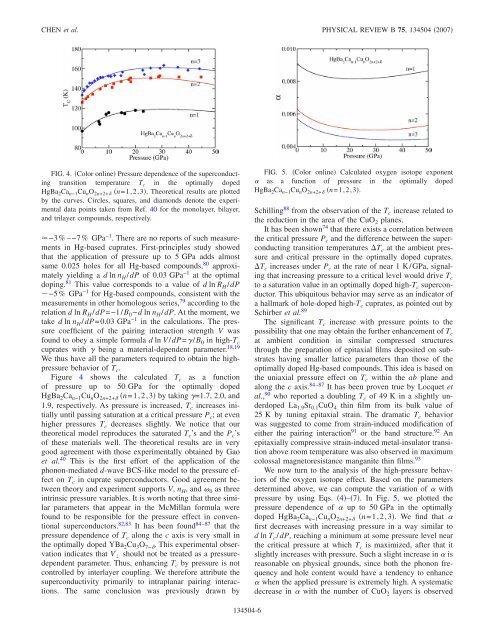
FIG. 4. Color onl<strong>in</strong>e Pressure dependence of the <strong>superconduct<strong>in</strong>g</strong><br />
transition temperature T c <strong>in</strong> the optimally doped<br />
HgBa 2 Ca n−1 Cu n O 2n+2+ n=1,2,3. Theoretical results are plotted<br />
by the curves. Circles, squares, and diamonds denote the experimental<br />
data po<strong>in</strong>ts taken from Ref. 40 for the monolayer, bilayer,<br />
and trilayer compounds, respectively.<br />
−3% –−7% GPa −1 . There are no reports of such measurements<br />
<strong>in</strong> Hg-based <strong>cuprate</strong>s. First-pr<strong>in</strong>ciples study showed<br />
that the application of pressure up to 5 GPa adds almost<br />
same 0.025 holes for all Hg-based compounds, 80 approximately<br />
yield<strong>in</strong>g a d ln n H /dP of 0.03 GPa −1 at the optimal<br />
dop<strong>in</strong>g. 81 This value corresponds to a value of d ln R H /dP<br />
−5% GPa −1 for Hg-based compounds, consistent with the<br />
measurements <strong>in</strong> other homologous series, 79 accord<strong>in</strong>g to the<br />
relation d ln R H /dP=−1/B 0 −d ln n H /dP. At the moment, we<br />
take d ln n H /dP=0.03 GPa −1 <strong>in</strong> the calculations. The pressure<br />
coefficient of the pair<strong>in</strong>g <strong>in</strong>teraction strength V was<br />
found to obey a simple formula d ln V/dP=/B 0 <strong>in</strong> high-T c<br />
<strong>cuprate</strong>s with be<strong>in</strong>g a material-dependent parameter. 18,19<br />
We thus have all the parameters required to obta<strong>in</strong> the highpressure<br />
behavior of T c .<br />
Figure 4 shows the calculated T c as a function<br />
of pressure up to 50 GPa for the optimally doped<br />
HgBa 2 Ca n−1 Cu n O 2n+2+ n=1,2,3 by tak<strong>in</strong>g =1.7, 2.0, and<br />
1.9, respectively. As pressure is <strong>in</strong>creased, T c <strong>in</strong>creases <strong>in</strong>itially<br />
until pass<strong>in</strong>g saturation at a critical pressure P c ; at even<br />
higher pressures T c decreases slightly. We notice that our<br />
theoretical model reproduces the saturated T c ’s and the P c ’s<br />
of these materials well. The theoretical results are <strong>in</strong> very<br />
good agreement with those experimentally obta<strong>in</strong>ed by Gao<br />
et al. 40 This is the first effort of the application of the<br />
phonon-<strong>mediated</strong> d-wave BCS-like model to the pressure effect<br />
on T c <strong>in</strong> <strong>cuprate</strong> superconductors. Good agreement between<br />
theory and experiment supports V, n H , and 0 as three<br />
<strong>in</strong>tr<strong>in</strong>sic pressure variables. It is worth not<strong>in</strong>g that three similar<br />
parameters that appear <strong>in</strong> the McMillan formula were<br />
found to be responsible for the pressure effect <strong>in</strong> conventional<br />
superconductors. 82,83 It has been found 84–87 that the<br />
pressure dependence of T c along the c axis is very small <strong>in</strong><br />
the optimally doped YBa 2 Cu 3 O 7− . This experimental observation<br />
<strong>in</strong>dicates that V should not be treated as a pressuredependent<br />
parameter. Thus, enhanc<strong>in</strong>g T c by pressure is not<br />
controlled by <strong>in</strong>terlayer coupl<strong>in</strong>g. We therefore attribute the<br />
superconductivity primarily to <strong>in</strong>traplanar pair<strong>in</strong>g <strong>in</strong>teractions.<br />
The same conclusion was previously drawn by<br />
FIG. 5. Color onl<strong>in</strong>e Calculated oxygen isotope exponent<br />
as a function of pressure <strong>in</strong> the optimally doped<br />
HgBa 2 Ca n−1 Cu n O 2n+2+ n=1,2,3.<br />
Schill<strong>in</strong>g 88 from the observation of the T c <strong>in</strong>crease related to<br />
the reduction <strong>in</strong> the area of the CuO 2 planes.<br />
It has been shown 74 that there exists a correlation between<br />
the critical pressure P c and the difference between the <strong>superconduct<strong>in</strong>g</strong><br />
transition temperatures T c at the ambient pressure<br />
and critical pressure <strong>in</strong> the optimally doped <strong>cuprate</strong>s.<br />
T c <strong>in</strong>creases under P c at the rate of near 1 K/GPa, signal<strong>in</strong>g<br />
that <strong>in</strong>creas<strong>in</strong>g pressure to a critical level would drive T c<br />
to a saturation value <strong>in</strong> an optimally doped high-T c superconductor.<br />
This ubiquitous behavior may serve as an <strong>in</strong>dicator of<br />
a hallmark of hole-doped high-T c <strong>cuprate</strong>s, as po<strong>in</strong>ted out by<br />
Schirber et al. 89<br />
The significant T c <strong>in</strong>crease with pressure po<strong>in</strong>ts to the<br />
possibility that one may obta<strong>in</strong> the further enhancement of T c<br />
at ambient condition <strong>in</strong> similar compressed structures<br />
through the preparation of epitaxial films deposited on substrates<br />
hav<strong>in</strong>g smaller lattice parameters than those of the<br />
optimally doped Hg-based compounds. This idea is based on<br />
the uniaxial pressure effect on T c with<strong>in</strong> the ab plane and<br />
along the c axis. 84–87 It has been proven true by Locquet et<br />
al., 90 who reported a doubl<strong>in</strong>g T c of 49 K <strong>in</strong> a slightly underdoped<br />
La 1.9 Sr 0.1 CuO 4 th<strong>in</strong> film from its bulk value of<br />
25 K by tun<strong>in</strong>g epitaxial stra<strong>in</strong>. The dramatic T c behavior<br />
was suggested to come from stra<strong>in</strong>-<strong>in</strong>duced modification of<br />
either the pair<strong>in</strong>g <strong>in</strong>teraction 91 or the band structure. 92 An<br />
epitaxially compressive stra<strong>in</strong>-<strong>in</strong>duced metal-<strong>in</strong>sulator transition<br />
above room temperature was also observed <strong>in</strong> maximum<br />
colossal magnetoresistance manganite th<strong>in</strong> films. 93<br />
We now turn to the analysis of the high-pressure behaviors<br />
of the oxygen isotope effect. Based on the parameters<br />
determ<strong>in</strong>ed above, we can compute the variation of with<br />
pressure by us<strong>in</strong>g Eqs. 4–7. In Fig. 5, we plotted the<br />
pressure dependence of up to 50 GPa <strong>in</strong> the optimally<br />
doped HgBa 2 Ca n−1 Cu n O 2n+2+ n=1,2,3. We f<strong>in</strong>d that <br />
first decreases with <strong>in</strong>creas<strong>in</strong>g pressure <strong>in</strong> a way similar to<br />
d ln T c /dP, reach<strong>in</strong>g a m<strong>in</strong>imum at some pressure level near<br />
the critical pressure at which T c is maximized, after that it<br />
slightly <strong>in</strong>creases with pressure. Such a slight <strong>in</strong>crease <strong>in</strong> is<br />
reasonable on physical grounds, s<strong>in</strong>ce both the phonon frequency<br />
and hole content would have a tendency to enhance<br />
when the applied pressure is extremely high. A systematic<br />
decrease <strong>in</strong> with the number of CuO 2 layers is observed<br />
134504-6