Phonon-mediated superconducting transitions in layered cuprate ...
Phonon-mediated superconducting transitions in layered cuprate ...
Phonon-mediated superconducting transitions in layered cuprate ...

Create successful ePaper yourself
Turn your PDF publications into a flip-book with our unique Google optimized e-Paper software.
CHEN et al.<br />
PHYSICAL REVIEW B 75, 134504 2007<br />
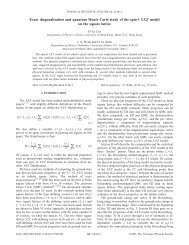
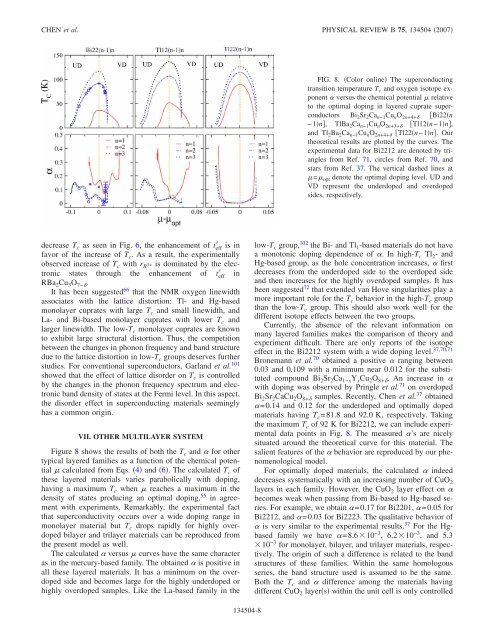
FIG. 8. Color onl<strong>in</strong>e The <strong>superconduct<strong>in</strong>g</strong><br />
transition temperature T c and oxygen isotope exponent<br />
versus the chemical potential relative<br />
to the optimal dop<strong>in</strong>g <strong>in</strong> <strong>layered</strong> <strong>cuprate</strong> superconductors<br />
Bi 2 Sr 2 Ca n−1 Cu n O 2n+4+ Bi22n<br />
−1n, TlBa 2 Ca n−1 Cu n O 2n+3+ Tl12n−1n,<br />
and Tl 2 Ba 2 Ca n−1 Cu n O 2n+4+ Tl22n−1n. Our<br />
theoretical results are plotted by the curves. The<br />
experimental data for Bi2212 are denoted by triangles<br />
from Ref. 71, circles from Ref. 70, and<br />
stars from Ref. 37. The vertical dashed l<strong>in</strong>es at<br />
= opt denote the optimal dop<strong>in</strong>g level. UD and<br />
VD represent the underdoped and overdoped<br />
sides, respectively.<br />
decrease T c as seen <strong>in</strong> Fig. 6, the enhancement of t eff is <strong>in</strong><br />
favor of the <strong>in</strong>crease of T c . As a result, the experimentally<br />
observed <strong>in</strong>crease of T c with r R 3+ is dom<strong>in</strong>ated by the electronic<br />
states through the enhancement of t eff <strong>in</strong><br />
RBa 2 Cu 3 O 7− .<br />
It has been suggested 66 that the NMR oxygen l<strong>in</strong>ewidth<br />
associates with the lattice distortion: Tl- and Hg-based<br />
monolayer <strong>cuprate</strong>s with large T c and small l<strong>in</strong>ewidth, and<br />
La- and Bi-based monolayer <strong>cuprate</strong>s with lower T c and<br />
larger l<strong>in</strong>ewidth. The low-T c monolayer <strong>cuprate</strong>s are known<br />
to exhibit large structural distortion. Thus, the competition<br />
between the changes <strong>in</strong> phonon frequency and band structure<br />
due to the lattice distortion <strong>in</strong> low-T c groups deserves further<br />
studies. For conventional superconductors, Garland et al. 101<br />
showed that the effect of lattice disorder on T c is controlled<br />
by the changes <strong>in</strong> the phonon frequency spectrum and electronic<br />
band density of states at the Fermi level. In this aspect,<br />
the disorder effect <strong>in</strong> <strong>superconduct<strong>in</strong>g</strong> materials seem<strong>in</strong>gly<br />
has a common orig<strong>in</strong>.<br />
VII. OTHER MULTILAYER SYSTEM<br />
Figure 8 shows the results of both the T c and for other<br />
typical <strong>layered</strong> families as a function of the chemical potential<br />
calculated from Eqs. 4 and 6. The calculated T c of<br />
these <strong>layered</strong> materials varies parabolically with dop<strong>in</strong>g,<br />
hav<strong>in</strong>g a maximum T c when reaches a maximum <strong>in</strong> the<br />
density of states produc<strong>in</strong>g an optimal dop<strong>in</strong>g, 55 <strong>in</strong> agreement<br />
with experiments. Remarkably, the experimental fact<br />
that superconductivity occurs over a wide dop<strong>in</strong>g range <strong>in</strong><br />
monolayer material but T c drops rapidly for highly overdoped<br />
bilayer and trilayer materials can be reproduced from<br />
the present model as well.<br />
The calculated versus curves have the same character<br />
as <strong>in</strong> the mercury-based family. The obta<strong>in</strong>ed is positive <strong>in</strong><br />
all these <strong>layered</strong> materials. It has a m<strong>in</strong>imum on the overdoped<br />
side and becomes large for the highly underdoped or<br />
highly overdoped samples. Like the La-based family <strong>in</strong> the<br />
low-T c group, 102 the Bi- and Tl 1 -based materials do not have<br />
a monotonic dop<strong>in</strong>g dependence of . In high-T c Tl 2 - and<br />
Hg-based group, as the hole concentration <strong>in</strong>creases, first<br />
decreases from the underdoped side to the overdoped side<br />
and then <strong>in</strong>creases for the highly overdoped samples. It has<br />
been suggested 72 that extended van Hove s<strong>in</strong>gularities play a<br />
more important role for the T c behavior <strong>in</strong> the high-T c group<br />
than the low-T c group. This should also work well for the<br />
different isotope effects between the two groups.<br />
Currently, the absence of the relevant <strong>in</strong>formation on<br />
many <strong>layered</strong> families makes the comparison of theory and<br />
experiment difficult. There are only reports of the isotope<br />
effect <strong>in</strong> the Bi2212 system with a wide dop<strong>in</strong>g level. 37,70,71<br />
Bronemann et al. 70 obta<strong>in</strong>ed a positive rang<strong>in</strong>g between<br />
0.03 and 0.109 with a m<strong>in</strong>imum near 0.012 for the substituted<br />
compound Bi 2 Sr 2 Ca 1−x Y x Cu 2 O 8+ . An <strong>in</strong>crease <strong>in</strong> <br />
with dop<strong>in</strong>g was observed by Pr<strong>in</strong>gle et al. 71 on overdoped<br />
Bi 2 Sr 2 CaCu 2 O 8+ samples. Recently, Chen et al. 37 obta<strong>in</strong>ed<br />
=0.14 and 0.12 for the underdoped and optimally doped<br />
materials hav<strong>in</strong>g T c =81.8 and 92.0 K, respectively. Tak<strong>in</strong>g<br />
the maximum T c of 92 K for Bi2212, we can <strong>in</strong>clude experimental<br />
data po<strong>in</strong>ts <strong>in</strong> Fig. 8. The measured ’s are nicely<br />
situated around the theoretical curve for this material. The<br />
salient features of the behavior are reproduced by our phenomenological<br />
model.<br />
For optimally doped materials, the calculated <strong>in</strong>deed<br />
decreases systematically with an <strong>in</strong>creas<strong>in</strong>g number of CuO 2<br />
layers <strong>in</strong> each family. However, the CuO 2 layer effect on <br />
becomes weak when pass<strong>in</strong>g from Bi-based to Hg-based series.<br />
For example, we obta<strong>in</strong> =0.17 for Bi2201, =0.05 for<br />
Bi2212, and =0.03 for Bi2223. The qualitative behavior of<br />
is very similar to the experimental results. 37 For the Hgbased<br />
family we have =8.610 −3 , 6.210 −3 , and 5.3<br />
10 −3 for monolayer, bilayer, and trilayer materials, respectively.<br />
The orig<strong>in</strong> of such a difference is related to the band<br />
structures of these families. With<strong>in</strong> the same homologous<br />
series, the band structure used is assumed to be the same.<br />
Both the T c and difference among the materials hav<strong>in</strong>g<br />
different CuO 2 layers with<strong>in</strong> the unit cell is only controlled<br />
134504-8