Model Independent Search for Deviations from the Standard Model ...
Model Independent Search for Deviations from the Standard Model ...
Model Independent Search for Deviations from the Standard Model ...

You also want an ePaper? Increase the reach of your titles
YUMPU automatically turns print PDFs into web optimized ePapers that Google loves.
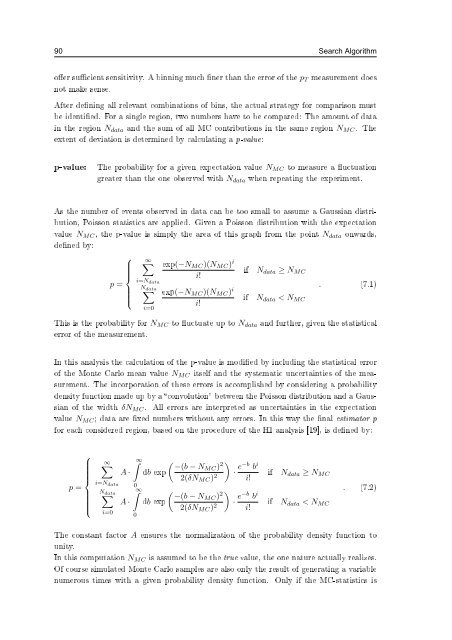
90 <strong>Search</strong> Algorithm<br />
oer sucient sensitivity. A binning much ner than <strong>the</strong> error of <strong>the</strong> p T measurement does<br />
not make sense.<br />
After dening all relevant combinations of bins, <strong>the</strong> actual strategy <strong>for</strong> comparison must<br />
be identied. For a single region, two numbers have to be compared: The amount of data<br />
in <strong>the</strong> region N data and <strong>the</strong> sum of all MC contributions in <strong>the</strong> same region N MC . The<br />
extent of deviation is determined by calculating a p-value:<br />
p-value:<br />
The probability <strong>for</strong> a given expectation value N MC to measure a uctuation<br />
greater than <strong>the</strong> one observed with N data when repeating <strong>the</strong> experiment.<br />
As <strong>the</strong> number of events observed in data can be too small to assume a Gaussian distribution,<br />
Poisson statistics are applied. Given a Poisson distribution with <strong>the</strong> expectation<br />
value N MC , <strong>the</strong> p-value is simply <strong>the</strong> area of this graph <strong>from</strong> <strong>the</strong> point N data onwards,<br />
dened by:<br />
⎧<br />
∞∑<br />
exp(−N MC )(N MC ) i<br />
if N ⎪⎨<br />
data ≥ N MC<br />
i!<br />
i=N<br />
p =<br />
data<br />
N data<br />
. (7.1)<br />
∑ exp(−N MC )(N MC )<br />
⎪⎩<br />
i<br />
if N data < N MC<br />
i!<br />
i=0<br />
This is <strong>the</strong> probability <strong>for</strong> N MC to uctuate up to N data and fur<strong>the</strong>r, given <strong>the</strong> statistical<br />
error of <strong>the</strong> measurement.<br />
In this analysis <strong>the</strong> calculation of <strong>the</strong> p-value is modied by including <strong>the</strong> statistical error<br />
of <strong>the</strong> Monte Carlo mean value N MC itself and <strong>the</strong> systematic uncertainties of <strong>the</strong> measurement.<br />
The incorporation of <strong>the</strong>se errors is accomplished by considering a probability<br />
density function made up by a convolution between <strong>the</strong> Poisson distribution and a Gaussian<br />
of <strong>the</strong> width δN MC . All errors are interpreted as uncertainties in <strong>the</strong> expectation<br />
value N MC ; data are xed numbers without any errors. In this way <strong>the</strong> nal estimator p<br />
<strong>for</strong> each considered region, based on <strong>the</strong> procedure of <strong>the</strong> H1 analysis [19], is dened by:<br />
⎧<br />
∞∑<br />
A ·<br />
⎪⎨<br />
i=N data<br />
p =<br />
⎪⎩<br />
N∑<br />
data<br />
i=0<br />
A ·<br />
∫ ∞<br />
0<br />
∫ ∞<br />
0<br />
db exp ( −(b − N MC ) 2 )<br />
2(δN MC ) 2 · e−b b i<br />
db exp ( −(b − N MC ) 2 )<br />
2(δN MC ) 2 · e−b b i<br />
if N data ≥ N MC<br />
i!<br />
. (7.2)<br />
if N data < N MC<br />
i!<br />
The constant factor A ensures <strong>the</strong> normalization of <strong>the</strong> probability density function to<br />
unity.<br />
In this computation N MC is assumed to be <strong>the</strong> true value, <strong>the</strong> one nature actually realizes.<br />
Of course simulated Monte Carlo samples are also only <strong>the</strong> result of generating a variable<br />
numerous times with a given probability density function. Only if <strong>the</strong> MC-statistics is