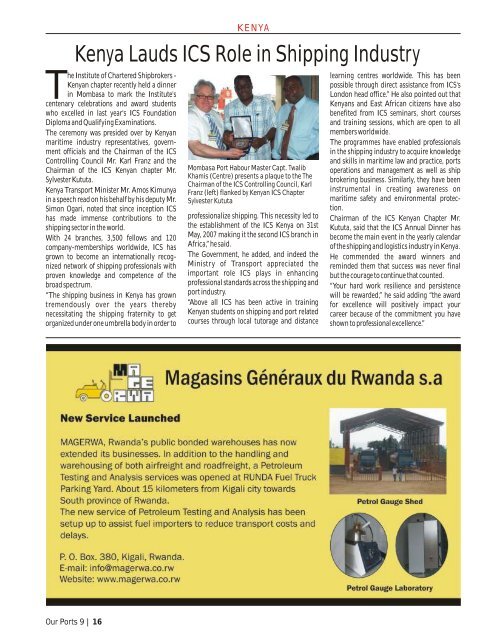
learning centres worldwide. This has been possible through direct assistance from ICS's London head office.” He also pointed out that Kenyans and East African citizens have also benefited from ICS seminars, short courses and training sessions, which are open to all members worldwide. The programmes have enabled professionals in the shipping industry to acquire knowledge and skills in maritime law and practice, ports operations and management as well as ship brokering business. Similarly, they have been instrumental in creating awareness on maritime safety and environmental protec- tion. Chairman of the ICS Kenyan Chapter Mr. Kututa, said that the ICS Annual Dinner has become the main event in the yearly calendar of the shipping and logistics industry in Kenya. He commended the award winners and reminded them that success was never final but the courage to continue that counted. “Your hard work resilience and persistence will be rewarded,” he said adding “the award for excellence will positively impact your career because of the commitment you have shown to professional excellence.” he Institute of Chartered Shipbrokers - Kenyan chapter recently held a dinner in Mombasa to mark the Institute's Tcentenary celebrations and award students who excelled in last year's ICS Foundation Diploma and Qualifying Examinations. The ceremony was presided over by Kenyan maritime industry representatives, government officials and the Chairman of the ICS Controlling Council Mr. Karl Franz and the Chairman of the ICS Kenyan chapter Mr. Sylvester Kututa. Kenya Transport Minister Mr. Amos Kimunya in a speech read on his behalf by his deputy Mr. Simon Ogari, noted that since inception ICS has made immense contributions to the shipping sector in the world. With 24 branches, 3,500 fellows and 120 company-memberships worldwide, ICS has grown to become an internationally recognized network of shipping professionals with proven knowledge and competence of the broad spectrum. “The shipping business in Kenya has grown tremendously over the years thereby necessitating the shipping fraternity to get organized under one umbrella body in order to KENYA Kenya Lauds ICS Role in Shipping Industry Mombasa Port Habour Master Capt. Twalib Khamis (Centre) presents a plaque to the The Chairman of the ICS Controlling Council, Karl Franz (left) flanked by Kenyan ICS Chapter Sylvester Kututa professionalize shipping. This necessity led to the establishment of the ICS Kenya on 31st May, 2007 making it the second ICS branch in Africa,” he said. The Government, he added, and indeed the Ministry of Transport appreciated the important role ICS plays in enhancing professional standards across the shipping and port industry. “Above all ICS has been active in training Kenyan students on shipping and port related courses through local tutorage and distance Our Ports 9 | 16
STATISTICS <strong>PMAESA</strong> Ports Statistics cBy Isaac Onyango 2,642,165 TEUs handled in 2008 to Port of Mombasa posted a notable growth in 2,395,084 TEUs recorded in 2009. The total cargo traffic of 16.1% in 2009 against ombined cargo traffic for the 26 port decline in traffic performance of the Africa's the 2.8% increase registered in 2008. This members of <strong>PMAESA</strong> totalled giant port is due to the recent global indicates that the impact of the global 266,517.378 million tons represent- economic recesion which hit economic economic turndown evidently more severe ing 1.42% growth over the preceding year of superpowers and did not spare a number of in 2008 has started to show some improve- 2008, despite the recent global economic Africa economies. ment. recession. However, container performance shows that In the performance of container traffic Trade data and statistics collected by the there has been a continued, post recession, which has been the pillar of the port’s traffic <strong>PMAESA</strong> Secretariat shows that the bulk of negative impact on the overall performance growth over the years, Mombasa port the traffic was however realised by South of traffic, especially the containerised recorded a small growth of 0.5% in 2009 African ports: Durban, Richards Bay, segment in most ports of the world. compared to 5.2% the port recorded in 2008. Saldanha, Elizabeth, Cape Town, East Ports of Maputo and Walvis Bay both posted Dar-Es-Salaam, posted 9.2% growth in total London and Mossel Bay recording total increased cargo traffic of 11.7% and 6.5% cargo traffic in 2009 and a decline of -5.93% traffic of 182.7 million tons in the year under respectively. Maputo also posted good in container traffic. review compared with the 185.1 million growth of 17% in container traffic. But Despite the impact of recession, the subtons in 2008. Walvis bay recorded -15.7% decline in region resiliently increased its overal cargo Durban registered a decline of 9.4% from container traffic in the same period. traffic flow by 1.42%. Port Country Table : Total Cargo Traffic(metric Tons) Metric Tons Annual Growth 2005 2006 2007 2008 2009 Volume % Richards Bay South Africa 86,623,684 86,319,200 84,517,409 84,533,584 77,630,356 -6,903,228 -8.17% Durban South Africa 40,778,495 43,861,241 41,883,269 41,402,495 37,419,282 -3,983,213 -9.51% Mombasa Kenya 13,281,000 14,419,000 15,962,355 16,414,729 19,062,000 2,647,271 16.58% Port Sudan Sudan 7,857,967 9,270,190 8,317,633 8,400,809 8,484,000 83,191 1.00% Dar Es Salam Tanzania 6,863,858 7,291,106 7,427,274 7,421,204 8,103,000 681,796 9.18% Maputo Mozambique 6,366,900 6,672,200 6,826,000 7,374,700 8,176,100 801,400 11.74% Mauritius Mauritius 5,602,466 5,686,342 6,226,381 6,295,154 5,878,440 -416,714 -6.69% Djibouti Djibouti 5,432,353 5,489,586 7,470,937 9,379,573 12,147,383 2,767,810 37.05% Cape Town S. Africa 3,508,711 4,134,740 4,081,968 3,205,094 3,058,601 -146,493 -3.59% Walvis Bay Namibia 3,012,166 3,567,174 3,933,647 4,795,631 5,052,014 256,383 6.52% Beira Mozambique 2,419,000 2,652,500 2,961,200 2,990,812 2,996,100 5,288 0.18% Nacala Mozambique 875,500 950,100 755,700 763,257 785,200 21,943 2.90% Victoria Seychelles 755,055 755,600 763,156 770,787 778,000 7,213 0.95% Lobito Angola 665,000 700,000 707,110 714,181 N/a -714,181 -101.00% Magerwa Rwanda* 523,800 439,286 523,939 529,178 535,000 5,822 1.11% Quelimane Mozambique 321,000 323,600 326,937 330,206 N/a -330,206 -101.00% Bujumbura Burundi* 204,929 182,810 136,077 137,437 140,000 2,563 1.88% Total Cargo Traffic(metric Tons)* 238,323,053 249,366,012 257,308,788 262,861,079 266,517,378 3,656,299 1.42% Port Country Table 2. Container Traffic (teus) T E U S Annual Growth 2005 2006 2007 2008 2009 Volume % Durban South Africa 1,899,065 2,198,600 2,479,232 2,642,165 2,395,084 -247,081 -9.97% Cape Town South Africa 690,895 782,868 764,005 767,501 759,951 -7,550 -0.99% Mombasa Kenya 436,671 479,355 585,367 615,733 618,816 3,083 0.53% Sudan Sudan 267,711 330,690 342,148 390,834 431,223 40,389 11.80% Dar Es Salaam Tanzania 258,389 272,700 333,980 373,548 353,738 -19,810 -5.93% Mauritius * Mauritius 253,770 266,425 303,583 334,924 368,416 33,492 11.03% Djibouti Djibouti 195,250 224,896 294,902 356,462 519,500 163,038 55.29% Walvis Bay Namibia* 72,219 117,547 143,806 194,102 171,480 -22,622 -15.73% Maputo * Mozambique 57,676 65,555 63,764 74,792 85,851 11,059 17.34% Richards Bay South Africa 5,179 4,191 4,021 9,350 6,273 -3,077 -76.52% Total Container Traffic(teus) 4,848,470 5,481,807 6,154,293 6,650,601 6,500,119 -150,482 -2.45% Note: data shown in red are provisional