
You also want an ePaper? Increase the reach of your titles
YUMPU automatically turns print PDFs into web optimized ePapers that Google loves.
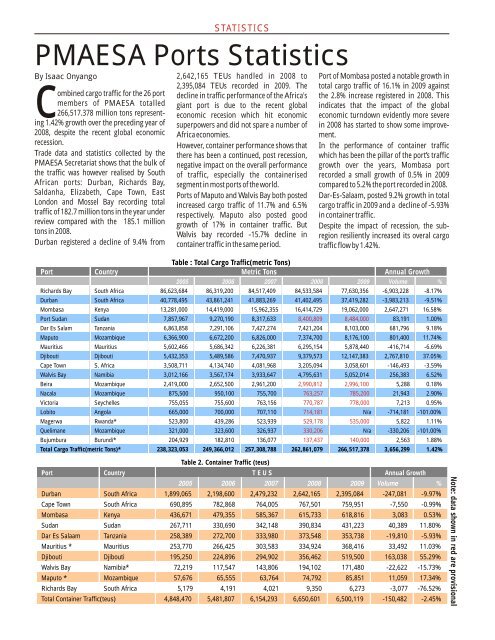
STATISTICS<br />
<strong>PMAESA</strong> Ports Statistics<br />
cBy Isaac Onyango<br />
2,642,165 TEUs handled in 2008 to Port of Mombasa posted a notable growth in<br />
2,395,084 TEUs recorded in 2009. The total cargo traffic of 16.1% in 2009 against<br />
ombined cargo traffic for the 26 port decline in traffic performance of the Africa's the 2.8% increase registered in 2008. This<br />
members of <strong>PMAESA</strong> totalled giant port is due to the recent global indicates that the impact of the global<br />
266,517.378 million tons represent-<br />
economic recesion which hit economic economic turndown evidently more severe<br />
ing 1.42% growth over the preceding year of superpowers and did not spare a number of in 2008 has started to show some improve-<br />
2008, despite the recent global economic Africa economies. ment.<br />
recession.<br />
However, container performance shows that In the performance of container traffic<br />
Trade data and statistics collected by the there has been a continued, post recession, which has been the pillar of the port’s traffic<br />
<strong>PMAESA</strong> Secretariat shows that the bulk of negative impact on the overall performance growth over the years, Mombasa port<br />
the traffic was however realised by South of traffic, especially the containerised recorded a small growth of 0.5% in 2009<br />
African ports: Durban, Richards Bay, segment in most ports of the world. compared to 5.2% the port recorded in 2008.<br />
Saldanha, Elizabeth, Cape Town, East<br />
Ports of Maputo and Walvis Bay both posted Dar-Es-Salaam, posted 9.2% growth in total<br />
London and Mossel Bay recording total<br />
increased cargo traffic of 11.7% and 6.5% cargo traffic in 2009 and a decline of -5.93%<br />
traffic of 182.7 million tons in the year under<br />
respectively. Maputo also posted good in container traffic.<br />
review compared with the 185.1 million<br />
growth of 17% in container traffic. But Despite the impact of recession, the subtons<br />
in 2008.<br />
Walvis bay recorded -15.7% decline in region resiliently increased its overal cargo<br />
Durban registered a decline of 9.4% from container traffic in the same period. traffic flow by 1.42%.<br />
Port<br />
Country<br />
Table : Total Cargo Traffic(metric Tons)<br />
Metric Tons<br />
Annual Growth<br />
2005 2006 2007 2008 2009 Volume %<br />
Richards Bay South Africa 86,623,684 86,319,200 84,517,409 84,533,584 77,630,356 -6,903,228 -8.17%<br />
Durban South Africa 40,778,495 43,861,241 41,883,269 41,402,495 37,419,282 -3,983,213 -9.51%<br />
Mombasa Kenya 13,281,000 14,419,000 15,962,355 16,414,729 19,062,000 2,647,271 16.58%<br />
Port Sudan Sudan 7,857,967 9,270,190 8,317,633 8,400,809 8,484,000 83,191 1.00%<br />
Dar Es Salam Tanzania 6,863,858 7,291,106 7,427,274 7,421,204 8,103,000 681,796 9.18%<br />
Maputo Mozambique 6,366,900 6,672,200 6,826,000 7,374,700 8,176,100 801,400 11.74%<br />
Mauritius Mauritius 5,602,466 5,686,342 6,226,381 6,295,154 5,878,440 -416,714 -6.69%<br />
Djibouti Djibouti 5,432,353 5,489,586 7,470,937 9,379,573 12,147,383 2,767,810 37.05%<br />
Cape Town S. Africa 3,508,711 4,134,740 4,081,968 3,205,094 3,058,601 -146,493 -3.59%<br />
Walvis Bay Namibia 3,012,166 3,567,174 3,933,647 4,795,631 5,052,014 256,383 6.52%<br />
Beira Mozambique 2,419,000 2,652,500 2,961,200 2,990,812 2,996,100 5,288 0.18%<br />
Nacala Mozambique 875,500 950,100 755,700 763,257 785,200 21,943 2.90%<br />
Victoria Seychelles 755,055 755,600 763,156 770,787 778,000 7,213 0.95%<br />
Lobito Angola 665,000 700,000 707,110 714,181 N/a -714,181 -101.00%<br />
Magerwa Rwanda* 523,800 439,286 523,939 529,178 535,000 5,822 1.11%<br />
Quelimane Mozambique 321,000 323,600 326,937 330,206 N/a -330,206 -101.00%<br />
Bujumbura Burundi* 204,929 182,810 136,077 137,437 140,000 2,563 1.88%<br />
Total Cargo Traffic(metric Tons)*<br />
238,323,053 249,366,012 257,308,788 262,861,079 266,517,378 3,656,299 1.42%<br />
Port<br />
Country<br />
Table 2. Container Traffic (teus)<br />
T E U S<br />
Annual Growth<br />
2005 2006 2007 2008 2009 Volume %<br />
Durban South Africa 1,899,065 2,198,600 2,479,232 2,642,165 2,395,084 -247,081 -9.97%<br />
Cape Town South Africa 690,895 782,868 764,005 767,501 759,951 -7,550 -0.99%<br />
Mombasa Kenya 436,671 479,355 585,367 615,733 618,816 3,083 0.53%<br />
Sudan Sudan 267,711 330,690 342,148 390,834 431,223 40,389 11.80%<br />
Dar Es Salaam Tanzania 258,389 272,700 333,980 373,548 353,738 -19,810 -5.93%<br />
Mauritius * Mauritius 253,770 266,425 303,583 334,924 368,416 33,492 11.03%<br />
Djibouti Djibouti 195,250 224,896 294,902 356,462 519,500 163,038 55.29%<br />
Walvis Bay Namibia* 72,219 117,547 143,806 194,102 171,480 -22,622 -15.73%<br />
Maputo * Mozambique 57,676 65,555 63,764 74,792 85,851 11,059 17.34%<br />
Richards Bay South Africa 5,179 4,191 4,021 9,350 6,273 -3,077 -76.52%<br />
Total Container Traffic(teus) 4,848,470 5,481,807 6,154,293 6,650,601 6,500,119 -150,482 -2.45%<br />
Note: data shown in red are provisional