auckland district crime statistics 2002/2003 - New Zealand Police
auckland district crime statistics 2002/2003 - New Zealand Police
auckland district crime statistics 2002/2003 - New Zealand Police

Create successful ePaper yourself
Turn your PDF publications into a flip-book with our unique Google optimized e-Paper software.
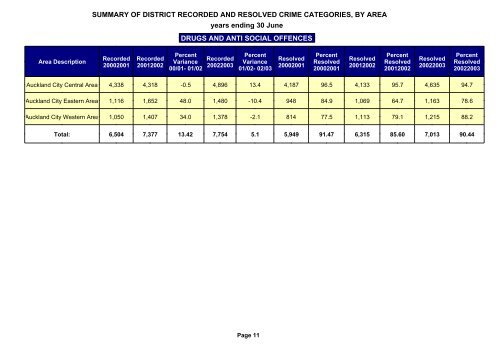
SUMMARY OF DISTRICT RECORDED AND RESOLVED CRIME CATEGORIES, BY AREA<br />
years ending 30 June<br />
DRUGS AND ANTI SOCIAL OFFENCES<br />
Area Description<br />
Recorded<br />
20002001<br />
Recorded<br />
2001<strong>2002</strong><br />
Percent<br />
Variance<br />
00/01- 01/02<br />
Recorded<br />
<strong>2002</strong><strong>2003</strong><br />
Percent<br />
Variance<br />
01/02- 02/03<br />
Resolved<br />
20002001<br />
Percent<br />
Resolved<br />
20002001<br />
Resolved<br />
2001<strong>2002</strong><br />
Percent<br />
Resolved<br />
2001<strong>2002</strong><br />
Resolved<br />
<strong>2002</strong><strong>2003</strong><br />
Percent<br />
Resolved<br />
<strong>2002</strong><strong>2003</strong><br />
Auckland City Central Area 4,338 4,318 -0.5 4,896 13.4 4,187 96.5 4,133 95.7 4,635 94.7<br />
Auckland City Eastern Area 1,116 1,652 48.0 1,480 -10.4 948 84.9 1,069 64.7 1,163 78.6<br />
Auckland City Western Area 1,050 1,407 34.0 1,378 -2.1 814 77.5 1,113 79.1 1,215 88.2<br />
Total: 6,504 7,377 13.42 7,754 5.1 5,949 91.47 6,315 85.60 7,013 90.44<br />
Page 11