auckland district crime statistics 2002/2003 - New Zealand Police
auckland district crime statistics 2002/2003 - New Zealand Police
auckland district crime statistics 2002/2003 - New Zealand Police

You also want an ePaper? Increase the reach of your titles
YUMPU automatically turns print PDFs into web optimized ePapers that Google loves.
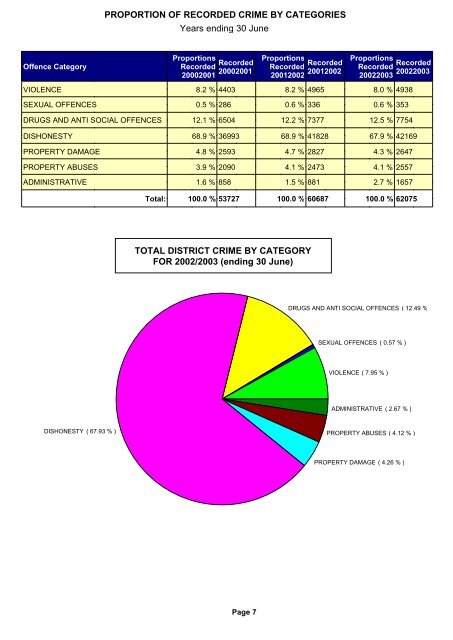
PROPORTION OF RECORDED CRIME BY CATEGORIES<br />
Years ending 30 June<br />
Offence Category<br />
Proportions<br />
Recorded<br />
Recorded<br />
20002001<br />
20002001<br />
Proportions<br />
Recorded<br />
Recorded<br />
2001<strong>2002</strong><br />
2001<strong>2002</strong><br />
Proportions<br />
Recorded<br />
Recorded<br />
<strong>2002</strong><strong>2003</strong><br />
<strong>2002</strong><strong>2003</strong><br />
VIOLENCE 8.2 % 4403 8.2 % 4965 8.0 % 4938<br />
SEXUAL OFFENCES 0.5 % 286 0.6 % 336 0.6 % 353<br />
DRUGS AND ANTI SOCIAL OFFENCES 12.1 % 6504 12.2 % 7377 12.5 % 7754<br />
DISHONESTY 68.9 % 36993 68.9 % 41828 67.9 % 42169<br />
PROPERTY DAMAGE 4.8 % 2593 4.7 % 2827 4.3 % 2647<br />
PROPERTY ABUSES 3.9 % 2090 4.1 % 2473 4.1 % 2557<br />
ADMINISTRATIVE 1.6 % 858 1.5 % 881 2.7 % 1657<br />
Total: 100.0 % 53727 100.0 % 60687 100.0 % 62075<br />
TOTAL DISTRICT CRIME BY CATEGORY<br />
FOR <strong>2002</strong>/<strong>2003</strong> (ending 30 June)<br />
DRUGS AND ANTI SOCIAL OFFENCES ( 12.49 % )<br />
SEXUAL OFFENCES ( 0.57 % )<br />
VIOLENCE ( 7.95 % )<br />
ADMINISTRATIVE ( 2.67 % )<br />
DISHONESTY ( 67.93 % )<br />
PROPERTY ABUSES ( 4.12 % )<br />
PROPERTY DAMAGE ( 4.26 % )<br />
Page 7