auckland district crime statistics 2002/2003 - New Zealand Police
auckland district crime statistics 2002/2003 - New Zealand Police
auckland district crime statistics 2002/2003 - New Zealand Police

Create successful ePaper yourself
Turn your PDF publications into a flip-book with our unique Google optimized e-Paper software.
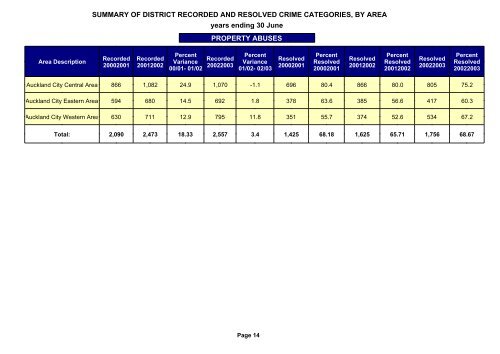
SUMMARY OF DISTRICT RECORDED AND RESOLVED CRIME CATEGORIES, BY AREA<br />
years ending 30 June<br />
PROPERTY ABUSES<br />
Area Description<br />
Recorded<br />
20002001<br />
Recorded<br />
2001<strong>2002</strong><br />
Percent<br />
Variance<br />
00/01- 01/02<br />
Recorded<br />
<strong>2002</strong><strong>2003</strong><br />
Percent<br />
Variance<br />
01/02- 02/03<br />
Resolved<br />
20002001<br />
Percent<br />
Resolved<br />
20002001<br />
Resolved<br />
2001<strong>2002</strong><br />
Percent<br />
Resolved<br />
2001<strong>2002</strong><br />
Resolved<br />
<strong>2002</strong><strong>2003</strong><br />
Percent<br />
Resolved<br />
<strong>2002</strong><strong>2003</strong><br />
Auckland City Central Area 866 1,082 24.9 1,070 -1.1 696 80.4 866 80.0 805 75.2<br />
Auckland City Eastern Area 594 680 14.5 692 1.8 378 63.6 385 56.6 417 60.3<br />
Auckland City Western Area 630 711 12.9 795 11.8 351 55.7 374 52.6 534 67.2<br />
Total: 2,090 2,473 18.33 2,557 3.4 1,425 68.18 1,625 65.71 1,756 68.67<br />
Page 14