auckland district crime statistics 2002/2003 - New Zealand Police
auckland district crime statistics 2002/2003 - New Zealand Police
auckland district crime statistics 2002/2003 - New Zealand Police

Create successful ePaper yourself
Turn your PDF publications into a flip-book with our unique Google optimized e-Paper software.
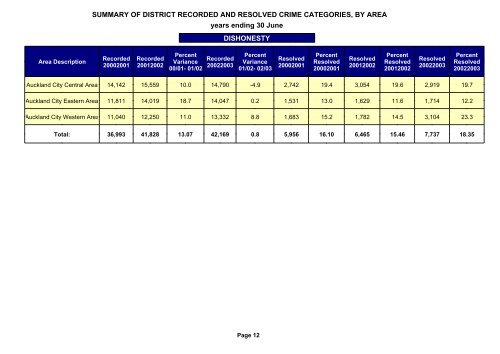
SUMMARY OF DISTRICT RECORDED AND RESOLVED CRIME CATEGORIES, BY AREA<br />
years ending 30 June<br />
DISHONESTY<br />
Area Description<br />
Recorded<br />
20002001<br />
Recorded<br />
2001<strong>2002</strong><br />
Percent<br />
Variance<br />
00/01- 01/02<br />
Recorded<br />
<strong>2002</strong><strong>2003</strong><br />
Percent<br />
Variance<br />
01/02- 02/03<br />
Resolved<br />
20002001<br />
Percent<br />
Resolved<br />
20002001<br />
Resolved<br />
2001<strong>2002</strong><br />
Percent<br />
Resolved<br />
2001<strong>2002</strong><br />
Resolved<br />
<strong>2002</strong><strong>2003</strong><br />
Percent<br />
Resolved<br />
<strong>2002</strong><strong>2003</strong><br />
Auckland City Central Area 14,142 15,559 10.0 14,790 -4.9 2,742 19.4 3,054 19.6 2,919 19.7<br />
Auckland City Eastern Area 11,811 14,019 18.7 14,047 0.2 1,531 13.0 1,629 11.6 1,714 12.2<br />
Auckland City Western Area 11,040 12,250 11.0 13,332 8.8 1,683 15.2 1,782 14.5 3,104 23.3<br />
Total: 36,993 41,828 13.07 42,169 0.8 5,956 16.10 6,465 15.46 7,737 18.35<br />
Page 12