auckland district crime statistics 2002/2003 - New Zealand Police
auckland district crime statistics 2002/2003 - New Zealand Police
auckland district crime statistics 2002/2003 - New Zealand Police

Create successful ePaper yourself
Turn your PDF publications into a flip-book with our unique Google optimized e-Paper software.
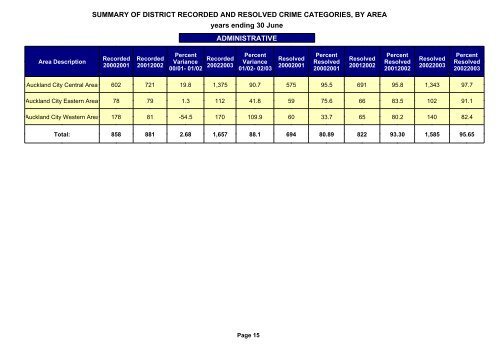
SUMMARY OF DISTRICT RECORDED AND RESOLVED CRIME CATEGORIES, BY AREA<br />
years ending 30 June<br />
ADMINISTRATIVE<br />
Area Description<br />
Recorded<br />
20002001<br />
Recorded<br />
2001<strong>2002</strong><br />
Percent<br />
Variance<br />
00/01- 01/02<br />
Recorded<br />
<strong>2002</strong><strong>2003</strong><br />
Percent<br />
Variance<br />
01/02- 02/03<br />
Resolved<br />
20002001<br />
Percent<br />
Resolved<br />
20002001<br />
Resolved<br />
2001<strong>2002</strong><br />
Percent<br />
Resolved<br />
2001<strong>2002</strong><br />
Resolved<br />
<strong>2002</strong><strong>2003</strong><br />
Percent<br />
Resolved<br />
<strong>2002</strong><strong>2003</strong><br />
Auckland City Central Area 602 721 19.8 1,375 90.7 575 95.5 691 95.8 1,343 97.7<br />
Auckland City Eastern Area 78 79 1.3 112 41.8 59 75.6 66 83.5 102 91.1<br />
Auckland City Western Area 178 81 -54.5 170 109.9 60 33.7 65 80.2 140 82.4<br />
Total: 858 881 2.68 1,657 88.1 694 80.89 822 93.30 1,585 95.65<br />
Page 15