auckland district crime statistics 2002/2003 - New Zealand Police
auckland district crime statistics 2002/2003 - New Zealand Police
auckland district crime statistics 2002/2003 - New Zealand Police

You also want an ePaper? Increase the reach of your titles
YUMPU automatically turns print PDFs into web optimized ePapers that Google loves.
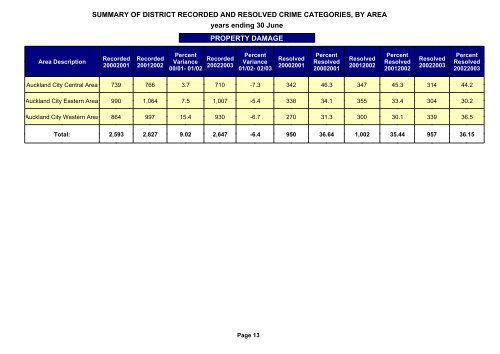
SUMMARY OF DISTRICT RECORDED AND RESOLVED CRIME CATEGORIES, BY AREA<br />
years ending 30 June<br />
PROPERTY DAMAGE<br />
Area Description<br />
Recorded<br />
20002001<br />
Recorded<br />
2001<strong>2002</strong><br />
Percent<br />
Variance<br />
00/01- 01/02<br />
Recorded<br />
<strong>2002</strong><strong>2003</strong><br />
Percent<br />
Variance<br />
01/02- 02/03<br />
Resolved<br />
20002001<br />
Percent<br />
Resolved<br />
20002001<br />
Resolved<br />
2001<strong>2002</strong><br />
Percent<br />
Resolved<br />
2001<strong>2002</strong><br />
Resolved<br />
<strong>2002</strong><strong>2003</strong><br />
Percent<br />
Resolved<br />
<strong>2002</strong><strong>2003</strong><br />
Auckland City Central Area 739 766 3.7 710 -7.3 342 46.3 347 45.3 314 44.2<br />
Auckland City Eastern Area 990 1,064 7.5 1,007 -5.4 338 34.1 355 33.4 304 30.2<br />
Auckland City Western Area 864 997 15.4 930 -6.7 270 31.3 300 30.1 339 36.5<br />
Total: 2,593 2,827 9.02 2,647 -6.4 950 36.64 1,002 35.44 957 36.15<br />
Page 13