Rancho Bernardo High School School Accountability Report Card ...
Rancho Bernardo High School School Accountability Report Card ...
Rancho Bernardo High School School Accountability Report Card ...

Create successful ePaper yourself
Turn your PDF publications into a flip-book with our unique Google optimized e-Paper software.
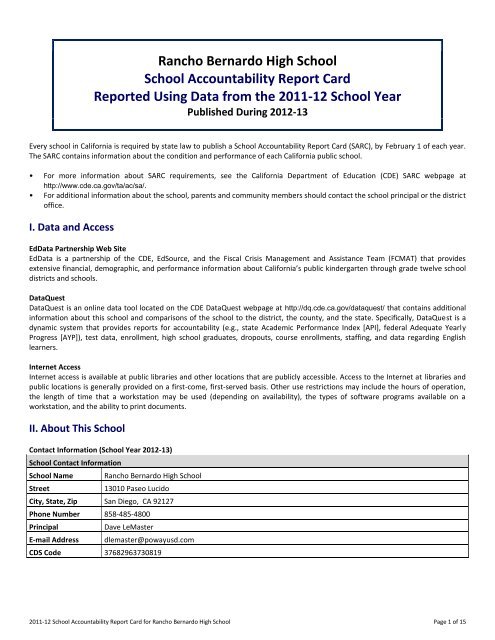
<strong>Rancho</strong> <strong>Bernardo</strong> <strong>High</strong> <strong>School</strong><br />
<strong>School</strong> <strong>Accountability</strong> <strong>Report</strong> <strong>Card</strong><br />
<strong>Report</strong>ed Using Data from the 2011-12 <strong>School</strong> Year<br />
Published During 2012-13<br />
Every school in California is required by state law to publish a <strong>School</strong> <strong>Accountability</strong> <strong>Report</strong> <strong>Card</strong> (SARC), by February 1 of each year.<br />
The SARC contains information about the condition and performance of each California public school.<br />
• For more information about SARC requirements, see the California Department of Education (CDE) SARC webpage at<br />
http://www.cde.ca.gov/ta/ac/sa/.<br />
• For additional information about the school, parents and community members should contact the school principal or the district<br />
office.<br />
I. Data and Access<br />
EdData Partnership Web Site<br />
EdData is a partnership of the CDE, EdSource, and the Fiscal Crisis Management and Assistance Team (FCMAT) that provides<br />
extensive financial, demographic, and performance information about California’s public kindergarten through grade twelve school<br />
districts and schools.<br />
DataQuest<br />
DataQuest is an online data tool located on the CDE DataQuest webpage at http://dq.cde.ca.gov/dataquest/ that contains additional<br />
information about this school and comparisons of the school to the district, the county, and the state. Specifically, DataQuest is a<br />
dynamic system that provides reports for accountability (e.g., state Academic Performance Index [API], federal Adequate Yearly<br />
Progress [AYP]), test data, enrollment, high school graduates, dropouts, course enrollments, staffing, and data regarding English<br />
learners.<br />
Internet Access<br />
Internet access is available at public libraries and other locations that are publicly accessible. Access to the Internet at libraries and<br />
public locations is generally provided on a first-come, first-served basis. Other use restrictions may include the hours of operation,<br />
the length of time that a workstation may be used (depending on availability), the types of software programs available on a<br />
workstation, and the ability to print documents.<br />
II. About This <strong>School</strong><br />
Contact Information (<strong>School</strong> Year 2012-13)<br />
<strong>School</strong> Contact Information<br />
<strong>School</strong> Name-------<br />
Street-------<br />
<strong>Rancho</strong> <strong>Bernardo</strong> <strong>High</strong> <strong>School</strong><br />
13010 Paseo Lucido<br />
City, State, Zip------- San Diego, CA 92127<br />
Phone Number------- 858-485-4800<br />
Principal-------<br />
E-mail Address-------<br />
Dave LeMaster<br />
dlemaster@powayusd.com<br />
CDS Code------- 37682963730819<br />
2011-12 <strong>School</strong> <strong>Accountability</strong> <strong>Report</strong> <strong>Card</strong> for <strong>Rancho</strong> <strong>Bernardo</strong> <strong>High</strong> <strong>School</strong> Page 1 of 15
District Contact Information<br />
District Name-------<br />
Poway Unified<br />
Phone Number------- 858-521-2800<br />
Web Site-------<br />
www.powayusd.com<br />
Superintendent------- John P. Collins, Ed.D<br />
E-mail Address-------<br />
elehew@powayusd.com<br />
<strong>School</strong> Description and Mission Statement (<strong>School</strong> Year 2011-12)<br />
This section provides information about the school, its programs and its goals.<br />
Located in the beautiful community of <strong>Rancho</strong> <strong>Bernardo</strong>, <strong>Rancho</strong> <strong>Bernardo</strong> <strong>High</strong> <strong>School</strong> (RBHS) is a comprehensive high school<br />
serving 2250 students in grades nine through twelve. RBHS offers a full range of academic and activity programs designed to meet<br />
the needs of all students. The school mirrors the ethnic diversity present in the community and serves as an important resource for<br />
youth within the large senior citizen population of this suburban area of San Diego. The ethnic distribution represents over 40<br />
different cultures and languages. The current racial distribution is predominately Caucasian (59%), with the rest of the student<br />
population representing Asian (17%), Hispanic (10.6%), Filipino (6.8%), African American (3.3%), and other (3.3%) groups. The<br />
community of <strong>Rancho</strong> <strong>Bernardo</strong> is comprised of homes ranging from multimillion-dollar custom homes through middle class tract<br />
homes, condominiums and apartments near the Interstate 15 freeway corridor. The majority of our families are upper-middle-class<br />
income earners. RBHS opened in 1991 with 1,400 students and experienced a maximum enrollment of 3,287 students in the 2001-<br />
2002 school year. The school offers academic programs including AVID, Advanced Placement, and on-line courses in history, civics,<br />
physics, and zoology. RBHS also offers a variety of interventions including California <strong>High</strong> <strong>School</strong> Exit Exam support courses in<br />
English and Math, a transition program for incoming at-risk students and 9th graders, a mentor program, and academic courses<br />
linked tightly to academic standards. In addition, RBHS is proud of its 68 athletic teams, 60 clubs, 12 service organizations, marching<br />
band, orchestra, color guard, Robotics, Science Olympiad, Speech and Debate teams, and Academic Team. The 2010-11 RBHS staff is<br />
composed of 80 teachers, 1 school psychologist, 2 speech therapists, 4 counselors, 4 administrators, and support staff. Teachers and<br />
staff participate in 3 staff development days each year as well as 1 hour of professional time every Wednesday afternoon. The RBHS<br />
<strong>School</strong> Site Council works diligently to monitor and support school improvement and student achievement at all levels. Parents serve<br />
as volunteers in many aspects of school life and enjoy open communication with the school. The RBHS Foundation, the Friends of<br />
the RBHS Library, and numerous booster clubs support student activities and student achievement. The PTSA is very active at RBHS<br />
and serves as an important vehicle for communication and connection to the community. All of these facets work in concert to<br />
support the Poway Unified <strong>School</strong> District’s goals related to College and Career Readiness. It is an expectation of <strong>Rancho</strong> <strong>Bernardo</strong><br />
<strong>High</strong> <strong>School</strong> and the Poway Unified <strong>School</strong> District that upon graduation, students will be prepared to pursue a wide variety of<br />
reasonable options including admission to college. <strong>Rancho</strong> <strong>Bernardo</strong> <strong>High</strong> <strong>School</strong> students continue to successfully complete a<br />
course of study that prepares them to meet the “a-g” application requirements of the CSU/UC systems, and that also prepares them<br />
for the world of work and for making a lifetime of informed decisions. Additionally, students will be offered opportunities to<br />
participate in a wide variety of extra- and co-curricular activities that help to produce balanced and productive adults.<br />
Opportunities for Parental Involvement (<strong>School</strong> Year 2011-12)<br />
This section provides information on how parents can become involved in school activities, including contact information pertaining<br />
to organized opportunities for parent involvement.<br />
<strong>Rancho</strong> <strong>Bernardo</strong> <strong>High</strong> recognizes the importance of the partnership between home/school and remains committed to supporting<br />
the Parents As Partners Core Value. Parents have been included in the improvement process and serve in an advisory capacity on<br />
committees. Among many opportunities for parent involvement are: <strong>School</strong> Site Council, Booster Clubs, PTSA, adult mentors and<br />
tutors, Library Volunteers, RBHS Foundation, and campus volunteering in a variety of ways. Parents interested in volunteering may<br />
contact the RBHS receptionist at (858)485-4800.<br />
Student Enrollment by Grade Level (<strong>School</strong> Year 2011-12)<br />
Grade Level<br />
Number of Students<br />
Grade 9------- 581<br />
Grade 10------- 577<br />
Grade 11------- 532<br />
Grade 12------- 577<br />
Total Enrollment------- 2,267<br />
2011-12 <strong>School</strong> <strong>Accountability</strong> <strong>Report</strong> <strong>Card</strong> for <strong>Rancho</strong> <strong>Bernardo</strong> <strong>High</strong> <strong>School</strong> Page 2 of 15
Student Enrollment by Group (<strong>School</strong> Year 2011-12)<br />
Group<br />
Percent of<br />
Total Enrollment<br />
Group<br />
Percent of<br />
Total Enrollment<br />
Black or African American------- 3.2 White 56.6<br />
American Indian or Alaska Native----<br />
0.4 Two or More Races 3.2<br />
Asian------- 17.6 Socioeconomically Disadvantaged 9.8<br />
Filipino------- 6.5 English Learners 6.4<br />
Hispanic or Latino------- 11.9 Students with Disabilities 8<br />
Native Hawaiian/Pacific Islander 0.7<br />
Average Class Size and Class Size Distribution (Secondary)<br />
Subject<br />
English-------<br />
----------<br />
Mathematics<br />
----------<br />
Science-------<br />
----------<br />
Social Science<br />
----------<br />
2009-10 2010-11 2011-12<br />
Avg. Number of Classrooms Avg. Number of Classrooms Avg. Number of Classrooms<br />
Class<br />
Class<br />
Class<br />
Size 1-22 23-32 33+ Size 1-22 23-32 33+ Size 1-22 23-32 33+<br />
26.6 13 62 11 33.4 8 5 48 34 9 1 46<br />
29.9 3 49 21 36.7 2 4 44 34.9 8 5 43<br />
28.4 4 61 11 36 3 2 47 36.4 2 7 37<br />
29.2 3 36 20 36.9 3 2 23 34 4 3 19<br />
* Number of classes indicates how many classrooms fall into each size category (a range of total students per classroom). At the secondary school level, this<br />
information is reported by subject area rather than grade level.<br />
III. <strong>School</strong> Climate<br />
<strong>School</strong> Safety Plan (<strong>School</strong> Year 2011-12)<br />
This section provides information about the school’s comprehensive safety plan, including the dates on which the safety plan was<br />
last reviewed, updated, and discussed with faculty; as well as a brief description of the key elements of the plan.<br />
Emergency plans are reviewed semi-annually and updated throughout the school year as needed. Annual training procedures and<br />
drills for earthquakes, fire and bus evacuation are held, and the asbestos plan is updated annually.<br />
RBHS also has lock down drills twice a year which includes students and staff simulating the procedures for an incident involving a<br />
lock down. <strong>School</strong> Site Council reviews annually all safety and disaster plans.<br />
Suspensions and Expulsions<br />
Rate*<br />
<strong>School</strong><br />
District<br />
2009-10 2010-11 2011-12 2009-10 2010-11 2011-12<br />
Suspensions------- 3.19 2.51 6.57 3.06 3.08 3.10<br />
Expulsions------- 0.16 0.49 .93 0.09 0.26 .22<br />
* The rate of suspensions and expulsions is calculated by dividing the total number of incidents by the total enrollment (and multiplying by 100).<br />
2011-12 <strong>School</strong> <strong>Accountability</strong> <strong>Report</strong> <strong>Card</strong> for <strong>Rancho</strong> <strong>Bernardo</strong> <strong>High</strong> <strong>School</strong> Page 3 of 15
IV. <strong>School</strong> Facilities<br />
<strong>School</strong> Facility Conditions and Planned Improvements (<strong>School</strong> Year 2012-13)<br />
This section provides information from the most recent Facility Inspection Tool (FIT) data (or equivalent), including:<br />
• Description of the safety, cleanliness, and adequacy of the school facility<br />
• Description of any planned or recently completed facility improvements<br />
• The year and month in which the data were collected<br />
• Description of any needed maintenance to ensure good repair<br />
Year and month in which data were collected: 6/11/2012<br />
The school district ensures that students attend clean and safe facilities. The district’s maintenance staff follows a comprehensive<br />
scheduled preventive and deferred maintenance program to offset costly repairs and minimize disruptions to the instructional<br />
program. A $198 million school bond was passed by the community in 2002, which is funding the renovation of 23 older schools and<br />
replacing the oldest school in the district. Planned renovations at each school will address inequity of learning facilities, expand core<br />
facilities, add classrooms and improve access to technology. RBHS will complete technology upgrades in the 2010-11 school year.<br />
In accordance with Education Code Section 17070.75(e), the District uses a <strong>School</strong> Facilities Inspection System developed by the<br />
State of California to ensure that each of its schools is maintained in good repair. A work order process is used to ensure efficient<br />
service and that emergency repairs are given the highest priority. Daily cleaning schedules ensure that classrooms, offices and<br />
bathrooms are clean and well maintained. Playgrounds and fields are ample and well maintained. A full time custodian is on every<br />
campus throughout every school day. A night custodial crew cleans classrooms, restrooms and offices daily. The district has adopted<br />
cleaning standards for all schools. A summary of these standards is available at the district offices.<br />
<strong>School</strong> Facility Good Repair Status (<strong>School</strong> Year 2012-13)<br />
This section provides information from the most recent Facility Inspection Tool (FIT) data (or equivalent), including:<br />
• Determination of repair status for systems listed<br />
• Description of any needed maintenance to ensure good repair<br />
• The Overall Rating (bottom row)<br />
System Inspected<br />
Systems:<br />
Gas Leaks, Mechanical/HVAC, Sewer<br />
Interior:<br />
Interior Surfaces<br />
Cleanliness:<br />
Overall Cleanliness, Pest/ Vermin Infestation<br />
Electrical:<br />
Electrical<br />
Restrooms/Fountains:<br />
Restrooms, Sinks/ Fountains<br />
Safety:<br />
Fire Safety, Hazardous Materials<br />
Structural:<br />
Structural Damage, Roofs<br />
External:<br />
Playground/<strong>School</strong> Grounds, Windows/<br />
Doors/Gates/Fences<br />
Repair Status<br />
Exemplary Good Fair Poor<br />
Repair Needed and<br />
Action Taken or Planned<br />
[ ] [X] [ ] [ ] Working on estimates for HVAC<br />
repair<br />
[ ] [X] [ ] [ ] Painting is due<br />
[X] [ ] [ ] [ ]<br />
[X] [ ] [ ] [ ]<br />
[X] [ ] [ ] [ ]<br />
[X] [ ] [ ] [ ]<br />
[X] [ ] [ ] [ ]<br />
[X] [ ] [ ] [ ]<br />
Overall Rating [X] [ ] [ ] [ ]<br />
2011-12 <strong>School</strong> <strong>Accountability</strong> <strong>Report</strong> <strong>Card</strong> for <strong>Rancho</strong> <strong>Bernardo</strong> <strong>High</strong> <strong>School</strong> Page 4 of 15
V. Teachers<br />
Teacher Credentials<br />
Teachers<br />
<strong>School</strong><br />
District<br />
2009-10 2010-11 2011-12 2011-12<br />
With Full Credential 84 80 86 1574<br />
Without Full Credential 3 2 0 1<br />
Teaching Outside Subject Area of Competence 0 1 0 ---<br />
Teacher Misassignments and Vacant Teacher Positions<br />
Indicator 2010-11 2011-12 2012-13<br />
Misassignments of Teachers of English Learners 0 0 0<br />
Total Teacher Misassignments 0 0 0<br />
Vacant Teacher Positions 0 0 0<br />
* “Misassignments” refers to the number of positions filled by teachers who lack legal authorization to teach that grade level, subject area, student group, etc.<br />
Core Academic Classes Taught by <strong>High</strong>ly Qualified Teachers (<strong>School</strong> Year 2011-12)<br />
The Federal Elementary and Secondary Education Act (ESEA), also known as No Child Left Behind (NCLB), requires that core<br />
academic subjects be taught by <strong>High</strong>ly Qualified Teachers, defined as having at least a bachelor’s degree, an appropriate California<br />
teaching credential, and demonstrated core academic subject area competence. For more information, see the CDE Improving<br />
Teacher and Principal Quality webpage at: http://www.cde.ca.gov/nclb/sr/tq/<br />
Location of Classes<br />
Taught by <strong>High</strong>ly Qualified Teachers<br />
Percent of Classes In Core Academic Subjects<br />
Not Taught by <strong>High</strong>ly Qualified Teachers<br />
This <strong>School</strong> 100 0<br />
All <strong>School</strong>s in District 99.89 0.11<br />
<strong>High</strong>-Poverty <strong>School</strong>s in District 100 0<br />
Low-Poverty <strong>School</strong>s in District 99.89 0.11<br />
* <strong>High</strong>-poverty schools are defined as those schools with student eligibility of approximately 40 percent or more in the free and reduced price meals program.<br />
Low-poverty schools are those with student eligibility of approximately 25 percent or less in the free and reduced price meals program.<br />
VI. Support Staff<br />
Academic Counselors and Other Support Staff (<strong>School</strong> Year 2011-12)<br />
Title<br />
Number of FTE<br />
Assigned to <strong>School</strong><br />
Average Number of Students per<br />
Academic Counselor<br />
Academic Counselor------- 4 608<br />
Counselor (Social/Behavioral or Career Development) 0 ---<br />
Library Media Teacher (Librarian) 1 ---<br />
Library Media Services Staff (Paraprofessional) 1 ---<br />
Psychologist------- 1 ---<br />
Social Worker------- 0 ---<br />
Nurse------- 1 ---<br />
Speech/Language/Hearing Specialist 1.6 ---<br />
Resource Specialist------- 0 ---<br />
Other------- ---<br />
* One Full-Time Equivalent (FTE) equals one staff member working full-time; one FTE could also represent two staff members who each work 50 percent of fulltime.<br />
2011-12 <strong>School</strong> <strong>Accountability</strong> <strong>Report</strong> <strong>Card</strong> for <strong>Rancho</strong> <strong>Bernardo</strong> <strong>High</strong> <strong>School</strong> Page 5 of 15
VII. Curriculum and Instructional Materials<br />
Quality, Currency, Availability of Textbooks and Instructional Materials (<strong>School</strong> Year 2012-13)<br />
This section describes whether the textbooks and instructional materials used at the school are from the most recent adoption;<br />
whether there are sufficient textbooks and instruction materials for each student; and information about the school’s use of any<br />
supplemental curriculum or non-adopted textbooks or instructional materials.<br />
Year and month in which data were collected: 10/1/2012<br />
All Textbooks from most recent adoption<br />
Percent of students lacking assigned copy: 0%<br />
Core Curriculum Area<br />
Reading/Language Arts<br />
Mathematics<br />
Science-------<br />
History-Social Science<br />
Foreign Language<br />
Health-------<br />
Science Laboratory<br />
Equipment<br />
(grades 9-12)<br />
Textbooks and Instructional Materials/<br />
Year of Adoption<br />
Each pupil, including English learners, has a textbook or reading language arts material, or both, as<br />
required by the state of California. Appropriate materials and textbooks are available for each child to<br />
use in class and to take home to complete required homework assignments. All textbooks are aligned<br />
to the California Content Standards and approved for use by the State and the Poway Unified Board of<br />
Education.<br />
Each pupil, including English learners, has a textbook or math material, or both, as required by the<br />
state of California. Appropriate materials and textbooks are available for each child to use in class and<br />
to take home to complete required homework assignments. All textbooks are aligned to the California<br />
Content Standards and approved for use by the State and the Poway Unified Board of Education.<br />
Each pupil, including English learners, has a textbook or science material, or both, as required by the<br />
state of California. Appropriate materials and textbooks are available for each child to use in class and<br />
to take home to complete required homework assignments. These materials include science<br />
laboratory equipment for grades 9 to 12, inclusively. All textbooks are aligned to the California Content<br />
Standards and approved for use by the State and the Poway Unified Board of Education.<br />
Each pupil, including English learners, has a textbook or History/Social Science material or both, as<br />
required by the state of California. Appropriate materials and textbooks are available for each child to<br />
use in class and to take home to complete required homework assignments. All textbooks are aligned<br />
to the California Content Standards and approved for use by the State and the Poway Unified Board of<br />
Education.<br />
Each pupil, including English learners, has a textbook or foreign language material, or both, as required<br />
by the state of California. Appropriate materials and textbooks are available for each child to use in<br />
class and to take home to complete required homework assignments. All textbooks are aligned to the<br />
California Content Standards and approved for use by the State and the Poway Unified Board of<br />
Education.<br />
Each pupil, including English learners, has a textbook or health material, or both as required by the<br />
state of California. Appropriate materials and textbooks are available for each child to use in class and<br />
to take home to complete required homework assignments. All textbooks are aligned to the California<br />
Content Standards and approved for use by the State and the Poway Unified Board of Education.<br />
Each pupil, including English learners, has a textbook or science laboratory material, or both, as<br />
required by the state of California. Appropriate materials and textbooks are available for each child to<br />
use in class and to take home to complete required homework assignments. These materials include<br />
science laboratory equipment for grades 9 to 12, inclusively. All textbooks are aligned to the California<br />
Content Standards and approved for use by the State and the Poway Unified Board of Education.<br />
2011-12 <strong>School</strong> <strong>Accountability</strong> <strong>Report</strong> <strong>Card</strong> for <strong>Rancho</strong> <strong>Bernardo</strong> <strong>High</strong> <strong>School</strong> Page 6 of 15
VIII. <strong>School</strong> Finances<br />
Expenditures Per Pupil and <strong>School</strong> Site Teacher Salaries (Fiscal Year 2010-11)<br />
Level<br />
Total<br />
Expenditures Per Pupil<br />
Supplemental/<br />
Restricted<br />
Basic/<br />
Unrestricted<br />
Average<br />
Teacher<br />
Salary<br />
<strong>School</strong> Site------- -- -- -- $69,627<br />
District------- --- --- $7,170 $69,945<br />
Percent Difference: <strong>School</strong> Site and District --- --- -- -0.5<br />
State------- --- --- $5,455 $68,835<br />
Percent Difference: <strong>School</strong> Site and State --- --- -- 1.2<br />
* Supplemental/Restricted expenditures come from money whose use is controlled by law or by a donor. Money that is designated for specific purposes by the<br />
district or governing board is not considered restricted.<br />
** Basic/Unrestricted expenditures are from money whose use, except for general guidelines, is not controlled by law or by a donor.<br />
For detailed information on school expenditures for all districts in California, see the CDE Current Expense of Education & Per-pupil Spending webpage at<br />
http://www.cde.ca.gov/ds/fd/ec/. For information on teacher salaries for all districts in California, see the CDE Certificated Salaries & Benefits webpage at<br />
http://www.cde.ca.gov/ds/fd/cs/. To look up expenditures and salaries for a specific school district, see the Ed-Data Web site at: http://www.ed-data.org.<br />
Types of Services Funded (Fiscal Year 2011-12)<br />
This section provides specific information about the types of programs and services available at the school that support and assists<br />
students. For example, this narrative may include information about supplemental educational services related to the school’s<br />
federal Program Improvement (PI) status.<br />
The district’s general fund includes monies for:<br />
1. General operations—services, materials, and support to the general education<br />
2. Special education—programs offering appropriate, individualized education to students with special needs<br />
3. Gifted and Talented Education—specialized learning assistance for students with high ability, achievement, or potential<br />
4. Special projects—monies from agencies (e.g., federal, state) earmarked for specific services<br />
5. Transportation<br />
6. Maintenance and operations<br />
7. District administration<br />
Each school in the district receives an instructional budget based on enrollment, programs, and on formulas set by the Board of<br />
Education policy, state law, agreements with employee bargaining units, and guidelines of outside funding agencies.<br />
Teacher and Administrative Salaries (Fiscal Year 2010-11)<br />
Category<br />
District<br />
Amount<br />
State Average for<br />
Districts In Same Category<br />
Beginning Teacher Salary $37,335 $41,455<br />
Mid-Range Teacher Salary $64,798 $66,043<br />
<strong>High</strong>est Teacher Salary $84,816 $85,397<br />
Average Principal Salary (Elementary) $115,116 $106,714<br />
Average Principal Salary (Middle) $121,692 $111,101<br />
Average Principal Salary (<strong>High</strong>) $125,810 $121,754<br />
Superintendent Salary $253,280 $223,357<br />
Percent of Budget for Teacher Salaries 40% 39%<br />
Percent of Budget for Administrative Salaries 5% 5%<br />
* For detailed information on salaries, see the CDE Certificated Salaries & Benefits webpage at http://www.cde.ca.gov/ds/fd/cs/.<br />
2011-12 <strong>School</strong> <strong>Accountability</strong> <strong>Report</strong> <strong>Card</strong> for <strong>Rancho</strong> <strong>Bernardo</strong> <strong>High</strong> <strong>School</strong> Page 7 of 15
IX. Student Performance<br />
The Standardized Testing and <strong>Report</strong>ing (STAR) Program consists of several key components, including:<br />
• California Standards Tests (CSTs), which include English-language arts (ELA) and mathematics in grades two through eleven;<br />
science in grades five, eight, and nine through eleven; and history-social science in grades eight, and nine through eleven.<br />
• California Modified Assessment (CMA), an alternate assessment that is based on modified achievement standards in ELA for<br />
grades three through eleven; mathematics for grades three through seven, Algebra I, and Geometry; and science in grades five<br />
and eight, and Life Science in grade ten. The CMA is designed to assess those students whose disabilities preclude them from<br />
achieving grade-level proficiency on an assessment of the California content standards with or without accommodations.<br />
• California Alternate Performance Assessment (CAPA), includes ELA and mathematics in grades two through eleven, and science<br />
for grades five, eight, and ten. The CAPA is given to those students with significant cognitive disabilities whose disabilities<br />
prevent them from taking either the CSTs with accommodations or modifications or the CMA with accommodations.<br />
The assessments under the STAR Program show how well students are doing in relation to the state content standards. On each of<br />
these assessments, student scores are reported as performance levels.<br />
For detailed information regarding the STAR Program results for each grade and performance level, including the percent of<br />
students not tested, see the CDE STAR Results Web site at http://star.cde.ca.gov.<br />
Standardized Testing and <strong>Report</strong>ing Results for All Students - Three-Year Comparison<br />
Subject<br />
Percent of Students Scoring at Proficient or Advanced<br />
<strong>School</strong> District State<br />
2009-10 2010-11 2011-12 2009-10 2010-11 2011-12 2009-10 2010-11 2011-12<br />
English-Language Arts 72 72 71 78 78 80 52 54 56<br />
Mathematics------- 52 47 48 69 69 69 48 50 51<br />
Science------- 72 70 77 80 81 83 54 57 60<br />
History-Social Science 68 70 66 68 71 71 44 48 49<br />
* Scores are not shown when the number of students tested is ten or less, either because the number of students in this category is too small for statistical<br />
accuracy or to protect student privacy.<br />
2011-12 <strong>School</strong> <strong>Accountability</strong> <strong>Report</strong> <strong>Card</strong> for <strong>Rancho</strong> <strong>Bernardo</strong> <strong>High</strong> <strong>School</strong> Page 8 of 15
Standardized Testing and <strong>Report</strong>ing Results by Student Group - Most Recent Year<br />
Group<br />
Percent of Students Scoring at Proficient or Advanced<br />
English-Language Arts Mathematics Science History-Social Science<br />
All Students in the LEA 80 69 83 71<br />
All Student at the <strong>School</strong> 71 48 77 66<br />
Male------- 67 49 77 68<br />
Female------- 75 46 78 64<br />
Black or African American 59 20 62 64<br />
American Indian or Alaska Native<br />
Asian------- 82 74 87 80<br />
Filipino------- 74 45 68 68<br />
Hispanic or Latino 57 30 64 48<br />
Native Hawaiian/Pacific Islander 42 33<br />
White------- 72 44 80 65<br />
Two or More Races------- 70 55 71 68<br />
Socioeconomically Disadvantaged 52 30 53 43<br />
English Learners------- 20 34 10 21<br />
Students with Disabilities 34 24 34 31<br />
Students Receiving Migrant Education Services<br />
* Scores are not shown when the number of students tested is ten or less, either because the number of students in this category is too small for statistical<br />
accuracy or to protect student privacy.<br />
California <strong>High</strong> <strong>School</strong> Exit Examination<br />
The California <strong>High</strong> <strong>School</strong> Exit Examination (CAHSEE) is primarily used as a graduation requirement. However, the grade ten results<br />
of this exam are also used to establish the percentages of students at three proficiency levels (not proficient, proficient, or<br />
advanced) in ELA and mathematics to compute AYP designations required by the federal ESEA, also known as NCLB.<br />
For detailed information regarding CAHSEE results, see the CDE CAHSEE Web site at http://cahsee.cde.ca.gov/.<br />
California <strong>High</strong> <strong>School</strong> Exit Examination Results for All Students - Three-Year Comparison<br />
Subject<br />
<strong>School</strong> District State<br />
2009-10 2010-11 2011-12 2009-10 2010-11 2011-12 2009-10 2010-11 2011-12<br />
English-Language Arts 82 78 79 77 80 80 54 59 56<br />
Mathematics 85 81 83 81 80 83 54 56 58<br />
* Scores are not shown when the number of students tested is ten or less, either because the number of students in this category is too small for statistical<br />
accuracy or to protect student privacy.<br />
2011-12 <strong>School</strong> <strong>Accountability</strong> <strong>Report</strong> <strong>Card</strong> for <strong>Rancho</strong> <strong>Bernardo</strong> <strong>High</strong> <strong>School</strong> Page 9 of 15
California <strong>High</strong> <strong>School</strong> Exit Examination Grade Ten Results by Student Group - Most Recent Year<br />
Group<br />
Not<br />
Proficient<br />
English-Language Arts<br />
Proficient<br />
Advanced<br />
Not<br />
Proficient<br />
Mathematics<br />
Proficient<br />
All Students in the LEA 20 27 53 17 40 43<br />
All Students at the <strong>School</strong> 21 28 50 17 44 40<br />
Male------- 28 31 41 19 37 44<br />
Female------- 15 26 60 15 50 36<br />
Black or African American 38 23 38 38 54 8<br />
American Indian or Alaska Native<br />
Asian------- 9 20 71 5 28 67<br />
Filipino------- 32 18 50 24 45 32<br />
Hispanic or Latino 39 31 30 33 43 24<br />
Native Hawaiian/Pacific Islander<br />
White------- 19 32 49 14 49 37<br />
Two or More Races 27 23 50 24 33 43<br />
Socioeconomically Disadvantaged 46 25 29 34 45 20<br />
English Learners------- 75 25 0 62 29 10<br />
Students with Disabilities 79 15 6 82 15 3<br />
Students Receiving Migrant Education Services<br />
Advanced<br />
* Scores are not shown when the number of students tested is ten or less, either because the number of students in this category is too small for statistical<br />
accuracy or to protect student privacy.<br />
California Physical Fitness Test Results (<strong>School</strong> Year 2011-12)<br />
The California Physical Fitness Test (PFT) is administered to students in grades five, seven, and nine only. This table displays by grade<br />
level the percent of students meeting the fitness standards for the most recent testing period. For detailed information regarding<br />
this test, and comparisons of a school’s test results to the district and state, see the CDE PFT webpage at<br />
http://www.cde.ca.gov/ta/tg/pf/.<br />
Grade<br />
Level<br />
-------7-------<br />
Percent of Students Meeting Fitness Standards<br />
Four of Six Standards Five of Six Standards Six of Six Standards<br />
-------9------- 7.9 24.1 64.2<br />
* Scores are not shown when the number of students tested is ten or less, either because the number of students in this category is too small for statistical<br />
accuracy or to protect student privacy.<br />
X. <strong>Accountability</strong><br />
Academic Performance Index<br />
The Academic Performance Index (API) is an annual measure of state academic performance and progress of schools in California.<br />
API scores range from 200 to 1,000, with a statewide target of 800. For detailed information about the API, see the CDE API webpage<br />
at http://www.cde.ca.gov/ta/ac/ap/.<br />
Academic Performance Index Ranks - Three-Year Comparison<br />
This table displays the school’s statewide and similar schools’ API ranks. The statewide API rank ranges from 1 to 10. A statewide<br />
rank of 1 means that the school has an API score in the lowest ten percent of all schools in the state, while a statewide rank of 10<br />
means that the school has an API score in the highest ten percent of all schools in the state.<br />
2011-12 <strong>School</strong> <strong>Accountability</strong> <strong>Report</strong> <strong>Card</strong> for <strong>Rancho</strong> <strong>Bernardo</strong> <strong>High</strong> <strong>School</strong> Page 10 of 15
The similar schools API rank reflects how a school compares to 100 statistically matched “similar schools.” A similar schools rank of<br />
1 means that the school’s academic performance is comparable to the lowest performing ten schools of the 100 similar schools,<br />
while a similar schools rank of 10 means that the school’s academic performance is better than at least 90 of the 100 similar schools.<br />
API Rank 2009 2010 2011<br />
Statewide------- 9 9 9<br />
Similar <strong>School</strong>s------- 3 5 2<br />
Academic Performance Index Growth by Student Group – Three-Year Comparison<br />
Group<br />
Actual API Change<br />
2009-10 2010-11 2011-12<br />
All Students at the <strong>School</strong> 14 -13 7<br />
Black or African American<br />
American Indian or Alaska Native<br />
Asian------- 21 -3 8<br />
Filipino------- 48 -26<br />
Hispanic or Latino -1 -27 -6<br />
Native Hawaiian/Pacific Islander<br />
White------- 13 -16 12<br />
Two or More Races<br />
Socioeconomically Disadvantaged 59 -37 10<br />
English Learners 16 -26 -13<br />
Students with Disabilities 37 -5 -8<br />
* "N/D” means that no data were available to the CDE or LEA to report. “B” means the school did not have a valid API Base and there is no Growth or target<br />
information. “C” means the school had significant demographic changes and there is no Growth or target information.<br />
Academic Performance Index Growth by Student Group - 2012 Growth API Comparison<br />
This table displays, by student group, the number of students included in the API and the 2012 Growth API at the school, district, and<br />
state level.<br />
Group<br />
2012 Growth API<br />
<strong>School</strong> District State<br />
# of Students Growth API # of Students Growth API # of Students Growth API<br />
All Students at the <strong>School</strong> 1,601 848 25,439 892 4,664,265 788<br />
Black or African American 47 748 715 803 313,217 710<br />
American Indian or Alaska Native 4 78 805 31,619 742<br />
Asian------- 289 916 4,821 953 404,682 905<br />
Filipino------- 98 853 1,737 885 124,840 869<br />
Hispanic or Latino 199 769 3,208 812 2,423,493 740<br />
Native Hawaiian/Pacific Islander 12 727 132 846 26,566 775<br />
White------- 899 849 13,801 896 1,222,181 853<br />
Two or More Races 53 846 939 905 88,438 849<br />
Socioeconomically Disadvantaged 157 763 3,624 795 2,779,679 737<br />
English Learners 142 738 3,949 838 1,530,298 716<br />
Students with Disabilities 131 630 2,833 703 530,935 607<br />
2011-12 <strong>School</strong> <strong>Accountability</strong> <strong>Report</strong> <strong>Card</strong> for <strong>Rancho</strong> <strong>Bernardo</strong> <strong>High</strong> <strong>School</strong> Page 11 of 15
Adequate Yearly Progress<br />
The federal ESEA requires that all schools and districts meet the following Adequate Yearly Progress (AYP) criteria:<br />
• Participation rate on the state’s standards-based assessments in ELA and mathematics<br />
• Percent proficient on the state’s standards-based assessments in ELA and mathematics<br />
• API as an additional indicator<br />
• Graduation rate (for secondary schools)<br />
Detailed information about AYP, including participation rates and percent proficient results by student group, can be found at the<br />
CDE Adequate Yearly Progress (AYP) webpage at http://www.cde.ca.gov/ta/ac/ay/.<br />
Adequate Yearly Progress Overall and by Criteria (<strong>School</strong> Year 2011-12)<br />
AYP Criteria <strong>School</strong> District<br />
Made AYP Overall Yes No<br />
Met Participation Rate: English-Language Arts Yes Yes<br />
Met Participation Rate: Mathematics Yes Yes<br />
Met Percent Proficient: English-Language Arts Yes No<br />
Met Percent Proficient: Mathematics Yes No<br />
Met API Criteria Yes Yes<br />
Met Graduation Rate (if applicable) Yes Yes<br />
Federal Intervention Program (<strong>School</strong> Year 2012-13)<br />
<strong>School</strong>s and districts receiving federal Title I funding enter Program Improvement (PI) if they do not make AYP for two consecutive<br />
years in the same content area (ELA or mathematics) or on the same indicator (API or graduation rate). After entering PI, schools and<br />
districts advance to the next level of intervention with each additional year that they do not make AYP. For detailed information<br />
about PI identification, see the CDE PI Status Determinations webpage: http://www.cde.ca.gov/ta/ac/ay/tidetermine.asp.<br />
Program Improvement Status<br />
Indicator <strong>School</strong> District<br />
First Year of Program Improvement 2012-2013<br />
Year in Program Improvement Year 1<br />
Number of <strong>School</strong>s Currently in Program Improvement --- 2<br />
Percent of <strong>School</strong>s Currently in Program Improvement --- 5.4<br />
XI. <strong>School</strong> Completion and Postsecondary Preparation<br />
Admission Requirements for California’s Public Universities<br />
University of California<br />
Admission requirements for the University of California (UC) follow guidelines set forth in the Master Plan, which requires that the<br />
top one-eighth of the state’s high school graduates, as well as those transfer students who have successfully completed specified<br />
college course work, be eligible for admission to the UC. These requirements are designed to ensure that all eligible students are<br />
adequately prepared for University-level work.<br />
For general admissions requirements, please visit the UC Admissions Information webpage at<br />
http://www.universityofcalifornia.edu/admissions/. (Outside source)<br />
In PI<br />
2011-12 <strong>School</strong> <strong>Accountability</strong> <strong>Report</strong> <strong>Card</strong> for <strong>Rancho</strong> <strong>Bernardo</strong> <strong>High</strong> <strong>School</strong> Page 12 of 15
California State University<br />
Eligibility for admission to the California State University (CSU) is determined by three factors:<br />
• Specific high school courses<br />
• Grades in specified courses and test scores<br />
• Graduation from high school<br />
Some campuses have higher standards for particular majors or students who live outside the local campus area. Because of the<br />
number of students who apply, a few campuses have higher standards (supplementary admission criteria) for all applicants. Most<br />
CSU campuses have local admission guarantee policies for students who graduate or transfer from high schools and colleges that are<br />
historically served by a CSU campus in that region. For admission, application, and fee information see the CSU webpage at<br />
http://www.calstate.edu/admission/admission.shtml. (Outside source)<br />
Dropout Rate and Graduation Rate<br />
Indicator<br />
<strong>School</strong> District State<br />
2008-09 2009-10 2010-11 2008-09 2009-10 2010-11 2008-09 2009-10 2010-11<br />
Dropout Rate (1-year) 1.6 0.1 2.4 1.8 16.6 14.4<br />
Graduation Rate 97.57 98.08 98.25 97.53 96.84 94.32 78.59 80.53 76.26<br />
* The National Center for Education Statistics graduation rate as reported in AYP is provided in this table.<br />
Completion of <strong>High</strong> <strong>School</strong> Graduation Requirements<br />
This table displays, by student group, the percent of students who began the 2011-12 school year in grade twelve and were a part of<br />
the school’s most recent graduating class, meeting all state and local graduation requirements for grade twelve completion,<br />
including having passed both the ELA and mathematics portions of the CAHSEE or received a local waiver or state exemption.<br />
Group<br />
Graduating Class of 2012<br />
<strong>School</strong> District State<br />
All Students 97.8% 96.1% ---<br />
Black or African American 100% 95.0% ---<br />
American Indian or Alaska Native 100% 100% ---<br />
Asian------- 98.9% 97.1% ---<br />
Filipino------- 100% 97.2% ---<br />
Hispanic or Latino 93.6% 89.0% ---<br />
Native Hawaiian/Pacific Islander 100% 100% ---<br />
White------- 97.9% 97.2% ---<br />
Two or More Races 94.1% 94.3% ---<br />
Socioeconomically Disadvantaged 93.1% 87% ---<br />
English Learners 66.7% 68.6% ---<br />
Students with Disabilities 92.3% 89.9% ---<br />
* “N/D” means that no data were available to the CDE or LEA to report.<br />
2011-12 <strong>School</strong> <strong>Accountability</strong> <strong>Report</strong> <strong>Card</strong> for <strong>Rancho</strong> <strong>Bernardo</strong> <strong>High</strong> <strong>School</strong> Page 13 of 15
Career Technical Education Programs (<strong>School</strong> Year 2011-12)<br />
This section provides information about Career Technical Education (CTE) programs including:<br />
• Programs and classes offered that are specifically focused on career preparation and or preparation for work<br />
• How these programs and classes are integrated with academic courses and how they support academic achievement<br />
• How the school addresses the needs of all students in career preparation and/or preparation for work, including needs unique<br />
to defined special populations of students<br />
• The measurable outcomes of these programs and classes, and how they are evaluated<br />
• State the primary representative of the district’s CTE advisory committee and the industries represented on the committee<br />
Poway Unified <strong>School</strong> District and our entire community value the key role that Career-Technical Education (CTE) plays in helping to<br />
fulfill the District’s mission of college readiness for every student. As an integral part of the entire educational program, Career<br />
Technical Education in Poway Unified <strong>School</strong> District offers academically challenging technical courses and programs. These courses<br />
and programs are comprehensive and future-oriented, are responsive to student, parent, community and workforce development<br />
needs, and are proven to positively affect student achievement. The CTE courses offered during the 2010-11 school year are<br />
displayed below, listed by industry sector (U denotes a course that is UC approved, A denotes a course that is articulated, S denotes<br />
a course that is sequenced).<br />
• 3D Animation (U; A)<br />
• Accounting (U; A)<br />
• Agricultural Biology (U)<br />
• Architectural Design (U)<br />
• Autobody Repair (A)<br />
• Automotive Technology (A)<br />
• Auto Engine Performance (A)<br />
• Principles of Biomedical Sciences (U)<br />
• Biomedical Technology (U; A)<br />
• Biotechnical Engineering (U; A)<br />
• Business Management and Ownership (A)<br />
• Computer Aided Drafting (CAD) (A)<br />
• Computer Graphic Arts (U; A)<br />
• Computer Information Systems (A)<br />
• AP Computer Science (U)<br />
• Data Structures (U)<br />
• Digital Media Production (U; A)<br />
• Introduction to Engineering Design (U)<br />
• Fire Science (A)<br />
• First Responder (A)<br />
• Floral Design (U)<br />
• Geographic Information Systems (U; A)<br />
• Internet Publishing (A)<br />
• Marketing Economics (U; A)<br />
• Nurse Assistant (A)<br />
• Photography (U; A)<br />
• Screen Printing and Design (U; A)<br />
• Sports Medicine/Athletic Trainer (U)<br />
• Technical Theatre Production (A)<br />
• Work Experience/Internships (A)<br />
Career Technical Education Participation (<strong>School</strong> Year 2011-12)<br />
Measure<br />
CTE Program<br />
Participation<br />
Number of pupils participating in CTE 5266<br />
% of pupils completing a CTE program and earning a high school diploma 99.62%<br />
% of CTE courses sequenced/articulated between the school/institutions of postsecondary education 100%<br />
Courses for University of California and/or California State University Admission<br />
UC/CSU Course Measure<br />
2011-12 Students Enrolled in Courses Required for UC/CSU Admission<br />
Percent<br />
2010-11 Graduates Who Completed All Courses Required for UC/CSU Admission 68.7<br />
2011-12 <strong>School</strong> <strong>Accountability</strong> <strong>Report</strong> <strong>Card</strong> for <strong>Rancho</strong> <strong>Bernardo</strong> <strong>High</strong> <strong>School</strong> Page 14 of 15
Advanced Placement Courses (<strong>School</strong> Year 2011–12)<br />
Subject Number of AP Courses Offered* Percent of Students In AP Courses<br />
Computer Science 0 ---<br />
English------- 7 ---<br />
Fine and Performing Arts 2 ---<br />
Foreign Language 0 ---<br />
Mathematics 8 ---<br />
Science------- 12 ---<br />
Social Science 17 ---<br />
All courses 46 12.9<br />
* Where there are student course enrollments.<br />
XII. Instructional Planning and Scheduling<br />
Professional Development<br />
This section provides information on the number of days provided for professional development and continuous professional growth<br />
in the most recent three year period. Questions that may be answered include:<br />
• What are the primary/major areas of focus for staff development and specifically how were they selected? For example, were<br />
student achievement data used to determine the need for professional development in reading instruction?<br />
• What are the methods by which professional development is delivered (e.g., after school workshops, conference attendance,<br />
individual mentoring, etc.)?<br />
• How are teachers supported during implementation (e.g., through in-class coaching, teacher-principal meetings, student<br />
performance, and data reporting, etc.)?<br />
Research supports the positive effects professional development has on increasing student learning. All teaching staff is afforded the<br />
opportunity to participate in district and site sponsored professional development. Every Wednesday teachers are provided an hour<br />
to work with their departments or curricular teams for staff development. In addition, three days are reserved throughout the year<br />
for professional development. District workshops (TLCs) are presented in a semester or year-long series and support a wide variety<br />
of professional development. These include the use of effective instructional strategies, implementing the use of computer<br />
technology in teaching and learning, critical reading, writing and mathematics strategies, effective use of assessments, positive<br />
discipline in-services, and multicultural training. Teachers and administrators are actively involved in professional development<br />
activities at the school, district, state, and national level. The Poway Professional Assistance Program (PPAP) provides support for<br />
new teachers. Teachers are encouraged to participate in the National Board Certification process and recognized by the Poway<br />
Unified <strong>School</strong> District when they earn NBCT status.<br />
2011-12 <strong>School</strong> <strong>Accountability</strong> <strong>Report</strong> <strong>Card</strong> for <strong>Rancho</strong> <strong>Bernardo</strong> <strong>High</strong> <strong>School</strong> Page 15 of 15