Bernardo Heights Middle School School Accountability Report Card ...
Bernardo Heights Middle School School Accountability Report Card ...
Bernardo Heights Middle School School Accountability Report Card ...

Create successful ePaper yourself
Turn your PDF publications into a flip-book with our unique Google optimized e-Paper software.
<strong>Bernardo</strong> <strong>Heights</strong> <strong>Middle</strong> <strong>School</strong><br />
<strong>School</strong> <strong>Accountability</strong> <strong>Report</strong> <strong>Card</strong><br />
<strong>Report</strong>ed Using Data from the 2011-12 <strong>School</strong> Year<br />
Published During 2012-13<br />
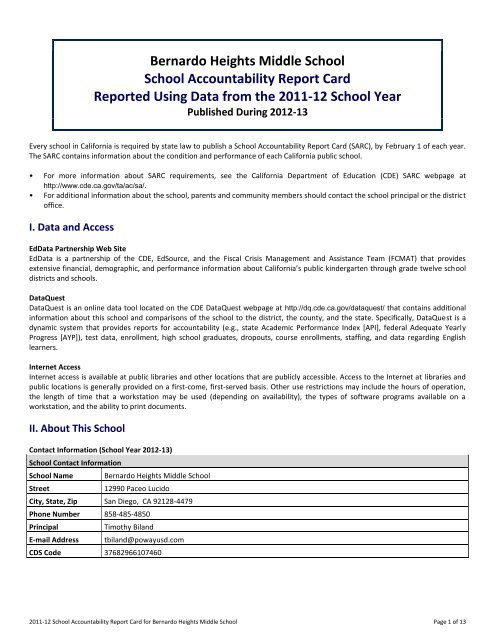
Every school in California is required by state law to publish a <strong>School</strong> <strong>Accountability</strong> <strong>Report</strong> <strong>Card</strong> (SARC), by February 1 of each year.<br />
The SARC contains information about the condition and performance of each California public school.<br />
• For more information about SARC requirements, see the California Department of Education (CDE) SARC webpage at<br />
http://www.cde.ca.gov/ta/ac/sa/.<br />
• For additional information about the school, parents and community members should contact the school principal or the district<br />
office.<br />
I. Data and Access<br />
EdData Partnership Web Site<br />
EdData is a partnership of the CDE, EdSource, and the Fiscal Crisis Management and Assistance Team (FCMAT) that provides<br />
extensive financial, demographic, and performance information about California’s public kindergarten through grade twelve school<br />
districts and schools.<br />
DataQuest<br />
DataQuest is an online data tool located on the CDE DataQuest webpage at http://dq.cde.ca.gov/dataquest/ that contains additional<br />
information about this school and comparisons of the school to the district, the county, and the state. Specifically, DataQuest is a<br />
dynamic system that provides reports for accountability (e.g., state Academic Performance Index [API], federal Adequate Yearly<br />
Progress [AYP]), test data, enrollment, high school graduates, dropouts, course enrollments, staffing, and data regarding English<br />
learners.<br />
Internet Access<br />
Internet access is available at public libraries and other locations that are publicly accessible. Access to the Internet at libraries and<br />
public locations is generally provided on a first-come, first-served basis. Other use restrictions may include the hours of operation,<br />
the length of time that a workstation may be used (depending on availability), the types of software programs available on a<br />
workstation, and the ability to print documents.<br />
II. About This <strong>School</strong><br />
Contact Information (<strong>School</strong> Year 2012-13)<br />
<strong>School</strong> Contact Information<br />
<strong>School</strong> Name-------<br />
Street-------<br />
<strong>Bernardo</strong> <strong>Heights</strong> <strong>Middle</strong> <strong>School</strong><br />
12990 Paceo Lucido<br />
City, State, Zip------- San Diego, CA 92128-4479<br />
Phone Number------- 858-485-4850<br />
Principal-------<br />
E-mail Address-------<br />
Timothy Biland<br />
tbiland@powayusd.com<br />
CDS Code------- 37682966107460<br />
2011-12 <strong>School</strong> <strong>Accountability</strong> <strong>Report</strong> <strong>Card</strong> for <strong>Bernardo</strong> <strong>Heights</strong> <strong>Middle</strong> <strong>School</strong> Page 1 of 13
District Contact Information<br />
District Name-------<br />
Poway Unified<br />
Phone Number------- 858-521-2800<br />
Web Site-------<br />
www.powayusd.com<br />
Superintendent------- John P. Collins, Ed.D<br />
E-mail Address-------<br />
elehew@powayusd.com<br />
<strong>School</strong> Description and Mission Statement (<strong>School</strong> Year 2011-12)<br />
This section provides information about the school, its programs and its goals.<br />
<strong>Bernardo</strong> <strong>Heights</strong> <strong>Middle</strong> <strong>School</strong>, one of six middle schools in the Poway Unified <strong>School</strong> District, is located on the boundary lines of<br />
Rancho <strong>Bernardo</strong> and the City of Poway and is approximately 25 miles northeast of San Diego. Most of our students come from<br />
three elementary feeder schools (Westwood, Highland Ranch, and Chaparral) and most of our eighth graders will attend Rancho<br />
<strong>Bernardo</strong> High <strong>School</strong>. Some students will have an option to attend Del Norte High <strong>School</strong> located in 4S Ranch. BHMS provides a<br />
rigorous and challenging academic curriculum, with a comprehensive selection of programs for 1400 students in grades 6, 7, and 8.<br />
We have been recognized as a California Distinguished <strong>School</strong> and as a National Blue Ribbon <strong>School</strong>. To achieve high academic<br />
standards, the school staff, parents, district, and members of the community work together to provide programs to meet the needs<br />
of all students.<br />
Our community consists of an established middle and upper-middle income area and a planned retirement community. Our student<br />
population is becoming more integrated socio-economically with current economic trends in housing and family income. About 33%<br />
of our students have been identified as needing special programs: GATE (15%), ELL (5%), AVID (4%), Special Education (9%). The<br />
average daily attendance of our students over the last few years is 96%. The BHMS average dropout rate for the same period is 0%.<br />
The ethnic representation of BHMS is 59% white, 17% Asian, 11% Hispanic, 7% Filipino, and 4% African American and 2% Multiethnic.<br />
Approximately 11% of the student body qualifies for low socio-economic status..<br />
The staff is composed of 52 teachers, one full-time and one part-time counselors, two administrators, one part-time librarian, one<br />
school psychologist, one speech pathologist, and members of our classified support staff. Parents are actively involved in the school<br />
as volunteers, PTSA members, BHMS Education Foundation members, and participants on the <strong>School</strong> Library Site Council (S/LIP).<br />
Mission Statement:<br />
TO ENSURE OUR STUDENTS ARE COLLEGE READY BERNARDO HEIGHTS MIDDLE SCHOOL WILL:<br />
Maintain a partnership among students, parents, teachers, staff, and community<br />
Provide a safe, positive, and challenging environment for all children to succeed<br />
Offer diverse opportunities for intellectual and personal growth for all members of the school community<br />
Develop multiple literacy skills to ensure our students are effective users of ideas, information, communication, and<br />
technology<br />
Promote productive, responsible, respectful, and healthy citizens for a global society<br />
Encourage a passion and curiosity for life-long learning<br />
<strong>Bernardo</strong> <strong>Heights</strong> - where students reach new heights in excellence!<br />
Opportunities for Parental Involvement (<strong>School</strong> Year 2011-12)<br />
This section provides information on how parents can become involved in school activities, including contact information pertaining<br />
to organized opportunities for parent involvement.<br />
<strong>Bernardo</strong> <strong>Heights</strong> <strong>Middle</strong> <strong>School</strong> recognizes the importance of the partnership between home and school and remains committed to<br />
supporting the Parents as Partners Core Value. Parents have been included in the school improvement process and serve in an<br />
advisory capacity on site and District committees. Parent involvement opportunities include: <strong>School</strong>/Library Site Council, Band and<br />
Choir Booster Clubs, PTSA, BHMS Education Foundation, and volunteering in a variety of ways assisting in classrooms, the Library, or<br />
supervising and assisting at school sponsored events. Parents also serve on Distract Advisory Councils for GATE, ELL, and S/LIP<br />
representing BHMS.<br />
2011-12 <strong>School</strong> <strong>Accountability</strong> <strong>Report</strong> <strong>Card</strong> for <strong>Bernardo</strong> <strong>Heights</strong> <strong>Middle</strong> <strong>School</strong> Page 2 of 13
Student Enrollment by Grade Level (<strong>School</strong> Year 2011-12)<br />
Grade Level<br />
Number of Students<br />
Grade 6------- 448<br />
Grade 7------- 443<br />
Grade 8 485<br />
Total Enrollment------- 1,376<br />
Student Enrollment by Group (<strong>School</strong> Year 2011-12)<br />
Group<br />
Percent of<br />
Total Enrollment<br />
Group<br />
Percent of<br />
Total Enrollment<br />
Black or African American------- 3.6 White 56<br />
American Indian or Alaska Native----<br />
0.6 Two or More Races 4.4<br />
Asian------- 17.7 Socioeconomically Disadvantaged 12.9<br />
Filipino------- 6.4 English Learners 9.8<br />
Hispanic or Latino------- 10.8 Students with Disabilities 9.7<br />
Native Hawaiian/Pacific Islander 0.4<br />
Average Class Size and Class Size Distribution (Secondary)<br />
Subject<br />
English-------<br />
----------<br />
Mathematics<br />
----------<br />
Science-------<br />
----------<br />
Social Science<br />
----------<br />
2009-10 2010-11 2011-12<br />
Avg. Number of Classrooms Avg. Number of Classrooms Avg. Number of Classrooms<br />
Class<br />
Class<br />
Class<br />
Size 1-22 23-32 33+ Size 1-22 23-32 33+ Size 1-22 23-32 33+<br />
28.3 6 25 17 31.8 5 1 23 31.5 3 4 21<br />
28.4 12 34 36 34.1 2 2 22 32.8 3 4 20<br />
31.9 2 26 43 37.3 0 0 24 35.8 0 3 22<br />
30.2 4 18 23 36.8 0 1 23 35.4 0 0 25<br />
* Number of classes indicates how many classrooms fall into each size category (a range of total students per classroom). At the secondary school level, this<br />
information is reported by subject area rather than grade level.<br />
III. <strong>School</strong> Climate<br />
<strong>School</strong> Safety Plan (<strong>School</strong> Year 2011-12)<br />
This section provides information about the school’s comprehensive safety plan, including the dates on which the safety plan was<br />
last reviewed, updated, and discussed with faculty; as well as a brief description of the key elements of the plan.<br />
<strong>Bernardo</strong> <strong>Heights</strong> places strong emphasis on safety for students and staff. Emergency plans are reviewed frequently. Annual training<br />
procedures and drills for earthquakes, fire and bus evacuation are held. The asbestos plan is updated annually. Within the first<br />
month of school administrators visit each class to review our Bobcat Code of Conduct and clarify expectations for student behavior.<br />
The District Harassment Policy is reviewed in detail so students are aware of consequences related to inappropriate behavior and<br />
what to do in case they are a victim of harassment. There is a Bully Hotline on our school web-site. Our Before and After <strong>School</strong><br />
Program has been recognized as a model program within San Diego County. Clubs, tutorials, and sport activities are offered during<br />
lunch or after school by teachers or through the After <strong>School</strong> Program. There is a school-wide effort around Character Counts<br />
education focusing on respect and responsibility. Our Special Education teachers sponsor an Empathy training session for students at<br />
each grade level. Instruction related to drug and alcohol information is shared by our counseling, physical education, and science<br />
staff.<br />
2011-12 <strong>School</strong> <strong>Accountability</strong> <strong>Report</strong> <strong>Card</strong> for <strong>Bernardo</strong> <strong>Heights</strong> <strong>Middle</strong> <strong>School</strong> Page 3 of 13
Suspensions and Expulsions<br />
Rate*<br />
<strong>School</strong><br />
District<br />
2009-10 2010-11 2011-12 2009-10 2010-11 2011-12<br />
Suspensions------- 2.27 3.83 4.29 3.06 3.08 3.10<br />
Expulsions------- 0.07 0.15 .07 0.09 0.26 .22<br />
* The rate of suspensions and expulsions is calculated by dividing the total number of incidents by the total enrollment (and multiplying by 100).<br />
IV. <strong>School</strong> Facilities<br />
<strong>School</strong> Facility Conditions and Planned Improvements (<strong>School</strong> Year 2012-13)<br />
This section provides information from the most recent Facility Inspection Tool (FIT) data (or equivalent), including:<br />
• Description of the safety, cleanliness, and adequacy of the school facility<br />
• Description of any planned or recently completed facility improvements<br />
• The year and month in which the data were collected<br />
• Description of any needed maintenance to ensure good repair<br />
Year and month in which data were collected: 6/11/2012<br />
The school district ensures that students attend clean and safe facilities. The district’s maintenance staff follows a comprehensive<br />
scheduled preventive and deferred maintenance program to offset costly repairs and minimize disruptions to the instructional<br />
program. A $198 million school bond was passed by the community in 2002, which is funding the renovation of 23 older schools and<br />
replacing the oldest school in the district. Planned renovations at each school will address inequity of learning facilities, expand core<br />
facilities, add classrooms and improve access to technology. In accordance with Education Code Section 17070.75(e), the District<br />
uses a <strong>School</strong> Facilities Inspection System developed by the State of California to ensure that each of its schools is maintained in<br />
good repair. A work order process is used to ensure efficient service and that emergency repairs are given the highest priority. Daily<br />
cleaning schedules ensure that classrooms, offices and bathrooms are clean and well maintained. Playgrounds and fields are ample<br />
and well maintained. A full time custodian is on every campus throughout every school day. A night custodial crew cleans<br />
classrooms, restrooms and offices daily. The district has adopted cleaning standards for all schools. A summary of these standards<br />
is available at the district offices.<br />
<strong>School</strong> Facility Good Repair Status (<strong>School</strong> Year 2012-13)<br />
This section provides information from the most recent Facility Inspection Tool (FIT) data (or equivalent), including:<br />
• Determination of repair status for systems listed<br />
• Description of any needed maintenance to ensure good repair<br />
• The Overall Rating (bottom row)<br />
System Inspected<br />
Systems:<br />
Gas Leaks, Mechanical/HVAC, Sewer<br />
Interior:<br />
Interior Surfaces<br />
Cleanliness:<br />
Overall Cleanliness, Pest/ Vermin Infestation<br />
Electrical:<br />
Electrical<br />
Restrooms/Fountains:<br />
Restrooms, Sinks/ Fountains<br />
Safety:<br />
Fire Safety, Hazardous Materials<br />
Repair Status<br />
Exemplary Good Fair Poor<br />
[X] [ ] [ ] [ ]<br />
[X] [ ] [ ] [ ]<br />
[X] [ ] [ ] [ ]<br />
[X] [ ] [ ] [ ]<br />
[X] [ ] [ ] [ ]<br />
[X] [ ] [ ] [ ]<br />
Repair Needed and<br />
Action Taken or Planned<br />
2011-12 <strong>School</strong> <strong>Accountability</strong> <strong>Report</strong> <strong>Card</strong> for <strong>Bernardo</strong> <strong>Heights</strong> <strong>Middle</strong> <strong>School</strong> Page 4 of 13
System Inspected<br />
Structural:<br />
Structural Damage, Roofs<br />
External:<br />
Playground/<strong>School</strong> Grounds, Windows/<br />
Doors/Gates/Fences<br />
Repair Status<br />
Exemplary Good Fair Poor<br />
[X] [ ] [ ] [ ]<br />
[X] [ ] [ ] [ ]<br />
Overall Rating [X] [ ] [ ] [ ]<br />
Repair Needed and<br />
Action Taken or Planned<br />
V. Teachers<br />
Teacher Credentials<br />
Teachers<br />
<strong>School</strong><br />
District<br />
2009-10 2010-11 2011-12 2011-12<br />
With Full Credential 45 51 56 1574<br />
Without Full Credential 0 1 0 1<br />
Teaching Outside Subject Area of Competence 0 0 0 ---<br />
Teacher Misassignments and Vacant Teacher Positions<br />
Indicator 2010-11 2011-12 2012-13<br />
Misassignments of Teachers of English Learners 0 0 0<br />
Total Teacher Misassignments 0 0 0<br />
Vacant Teacher Positions 0 0 0<br />
* “Misassignments” refers to the number of positions filled by teachers who lack legal authorization to teach that grade level, subject area, student group, etc.<br />
Core Academic Classes Taught by Highly Qualified Teachers (<strong>School</strong> Year 2011-12)<br />
The Federal Elementary and Secondary Education Act (ESEA), also known as No Child Left Behind (NCLB), requires that core<br />
academic subjects be taught by Highly Qualified Teachers, defined as having at least a bachelor’s degree, an appropriate California<br />
teaching credential, and demonstrated core academic subject area competence. For more information, see the CDE Improving<br />
Teacher and Principal Quality webpage at: http://www.cde.ca.gov/nclb/sr/tq/<br />
Location of Classes<br />
Taught by Highly Qualified Teachers<br />
Percent of Classes In Core Academic Subjects<br />
Not Taught by Highly Qualified Teachers<br />
This <strong>School</strong> 100 0<br />
All <strong>School</strong>s in District 99.89 0.11<br />
High-Poverty <strong>School</strong>s in District 100 0<br />
Low-Poverty <strong>School</strong>s in District 99.89 0.11<br />
* High-poverty schools are defined as those schools with student eligibility of approximately 40 percent or more in the free and reduced price meals program.<br />
Low-poverty schools are those with student eligibility of approximately 25 percent or less in the free and reduced price meals program.<br />
2011-12 <strong>School</strong> <strong>Accountability</strong> <strong>Report</strong> <strong>Card</strong> for <strong>Bernardo</strong> <strong>Heights</strong> <strong>Middle</strong> <strong>School</strong> Page 5 of 13
VI. Support Staff<br />
Academic Counselors and Other Support Staff (<strong>School</strong> Year 2011-12)<br />
Title<br />
Number of FTE<br />
Assigned to <strong>School</strong><br />
Average Number of Students per<br />
Academic Counselor<br />
Academic Counselor------- 1.5 867<br />
Counselor (Social/Behavioral or Career Development) ---<br />
Library Media Teacher (Librarian) 0.5 ---<br />
Library Media Services Staff (Paraprofessional) 1 ---<br />
Psychologist------- 1 ---<br />
Social Worker------- ---<br />
Nurse------- ---<br />
Speech/Language/Hearing Specialist 1 ---<br />
Resource Specialist------- ---<br />
Other------- 1 ---<br />
* One Full-Time Equivalent (FTE) equals one staff member working full-time; one FTE could also represent two staff members who each work 50 percent of fulltime.<br />
VII. Curriculum and Instructional Materials<br />
Quality, Currency, Availability of Textbooks and Instructional Materials (<strong>School</strong> Year 2012-13)<br />
This section describes whether the textbooks and instructional materials used at the school are from the most recent adoption;<br />
whether there are sufficient textbooks and instruction materials for each student; and information about the school’s use of any<br />
supplemental curriculum or non-adopted textbooks or instructional materials.<br />
Year and month in which data were collected: 10/1/2012<br />
Core Curriculum Area<br />
Reading/Language Arts<br />
Mathematics<br />
Textbooks and Instructional Materials/<br />
Year of Adoption<br />
Each pupil, including English learners, has a textbook<br />
or reading language arts material, or both, as<br />
required by the state of California. Appropriate<br />
materials and textbooks are available for each child<br />
to use in class and to take home to complete required<br />
homework assignments. All textbooks are aligned<br />
to the California Content Standards and approved for<br />
use by the State and the Poway Unified Board of<br />
Education.<br />
Each pupil, including English learners, has a textbook<br />
or math material, or both, as required by the state of<br />
California. Appropriate materials and textbooks are<br />
available for each child to use in class and to take<br />
home to complete required homework assignments.<br />
All textbooks are aligned to the California Content<br />
Standards and approved for use by the State and the<br />
Poway Unified Board of Education.<br />
From<br />
Most Recent<br />
Adoption?<br />
Percent of Students<br />
Lacking Own<br />
Assigned Copy<br />
Yes 0<br />
Yes 0<br />
2011-12 <strong>School</strong> <strong>Accountability</strong> <strong>Report</strong> <strong>Card</strong> for <strong>Bernardo</strong> <strong>Heights</strong> <strong>Middle</strong> <strong>School</strong> Page 6 of 13
Core Curriculum Area<br />
Science-------<br />
History-Social Science<br />
Foreign Language<br />
Textbooks and Instructional Materials/<br />
Year of Adoption<br />
Each pupil, including English learners, has a textbook<br />
or science/health material, or both, as required by<br />
the state of California. Appropriate materials and<br />
textbooks are available for each child to use in class<br />
and to take home to complete required homework<br />
assignments. All textbooks are aligned to the<br />
California Content Standards and approved for use by<br />
the State and the Poway Unified Board of Education.<br />
Each pupil, including English learners, has a textbook<br />
or History/Social Science material or both, as<br />
required by the state of California. Appropriate<br />
materials and textbooks are available for each child<br />
to use in class and to take home to complete required<br />
homework assignments. All textbooks are aligned to<br />
the California Content Standards and approved for<br />
use by the State and the Poway Unified Board of<br />
Education.<br />
Each pupil, including English learners, has a textbook<br />
or foreign language material, or both, as required by<br />
the state of California. Appropriate materials and<br />
textbooks are available for each child to use in class<br />
and to take home to complete required homework<br />
assignments. All textbooks are aligned to the<br />
California Content Standards and approved for use by<br />
the State and the Poway Unified Board of Education.<br />
From<br />
Most Recent<br />
Adoption?<br />
Percent of Students<br />
Lacking Own<br />
Assigned Copy<br />
Yes 0<br />
Yes 0<br />
Yes 0<br />
VIII. <strong>School</strong> Finances<br />
Expenditures Per Pupil and <strong>School</strong> Site Teacher Salaries (Fiscal Year 2010-11)<br />
Level<br />
Total<br />
Expenditures Per Pupil<br />
Supplemental/<br />
Restricted<br />
Basic/<br />
Unrestricted<br />
Average<br />
Teacher<br />
Salary<br />
<strong>School</strong> Site------- -- -- -- $68,150<br />
District------- --- --- $7,170 $69,945<br />
Percent Difference: <strong>School</strong> Site and District --- --- -- -2.6<br />
State------- --- --- $5,455 $68,835<br />
Percent Difference: <strong>School</strong> Site and State --- --- -- -1.0<br />
* Supplemental/Restricted expenditures come from money whose use is controlled by law or by a donor. Money that is designated for specific purposes by the<br />
district or governing board is not considered restricted.<br />
** Basic/Unrestricted expenditures are from money whose use, except for general guidelines, is not controlled by law or by a donor.<br />
For detailed information on school expenditures for all districts in California, see the CDE Current Expense of Education & Per-pupil Spending webpage at<br />
http://www.cde.ca.gov/ds/fd/ec/. For information on teacher salaries for all districts in California, see the CDE Certificated Salaries & Benefits webpage at<br />
http://www.cde.ca.gov/ds/fd/cs/. To look up expenditures and salaries for a specific school district, see the Ed-Data Web site at: http://www.ed-data.org.<br />
2011-12 <strong>School</strong> <strong>Accountability</strong> <strong>Report</strong> <strong>Card</strong> for <strong>Bernardo</strong> <strong>Heights</strong> <strong>Middle</strong> <strong>School</strong> Page 7 of 13
Types of Services Funded (Fiscal Year 2011-12)<br />
This section provides specific information about the types of programs and services available at the school that support and assists<br />
students. For example, this narrative may include information about supplemental educational services related to the school’s<br />
federal Program Improvement (PI) status.<br />
The district’s general fund includes monies for:<br />
1. General operations—services, materials, and support to the general education<br />
2. Special education—programs offering appropriate, individualized education to students with special needs<br />
3. Gifted and Talented Education—specialized learning assistance for students with high ability, achievement, or potential<br />
4. Special projects—monies from agencies (e.g., federal, state) earmarked for specific services<br />
5. Transportation<br />
6. Maintenance and operations<br />
7. District administration<br />
Each school in the district receives an instructional budget based on enrollment, programs, and on formulas set by the Board of<br />
Education policy, state law, agreements with employee bargaining units, and guidelines of outside funding agencies.<br />
Teacher and Administrative Salaries (Fiscal Year 2010-11)<br />
Category<br />
District<br />
Amount<br />
State Average for<br />
Districts In Same Category<br />
Beginning Teacher Salary $37,335 $41,455<br />
Mid-Range Teacher Salary $64,798 $66,043<br />
Highest Teacher Salary $84,816 $85,397<br />
Average Principal Salary (Elementary) $115,116 $106,714<br />
Average Principal Salary (<strong>Middle</strong>) $121,692 $111,101<br />
Average Principal Salary (High) $125,810 $121,754<br />
Superintendent Salary $253,280 $223,357<br />
Percent of Budget for Teacher Salaries 40% 39%<br />
Percent of Budget for Administrative Salaries 5% 5%<br />
* For detailed information on salaries, see the CDE Certificated Salaries & Benefits webpage at http://www.cde.ca.gov/ds/fd/cs/.<br />
IX. Student Performance<br />
The Standardized Testing and <strong>Report</strong>ing (STAR) Program consists of several key components, including:<br />
• California Standards Tests (CSTs), which include English-language arts (ELA) and mathematics in grades two through eleven;<br />
science in grades five, eight, and nine through eleven; and history-social science in grades eight, and nine through eleven.<br />
• California Modified Assessment (CMA), an alternate assessment that is based on modified achievement standards in ELA for<br />
grades three through eleven; mathematics for grades three through seven, Algebra I, and Geometry; and science in grades five<br />
and eight, and Life Science in grade ten. The CMA is designed to assess those students whose disabilities preclude them from<br />
achieving grade-level proficiency on an assessment of the California content standards with or without accommodations.<br />
• California Alternate Performance Assessment (CAPA), includes ELA and mathematics in grades two through eleven, and science<br />
for grades five, eight, and ten. The CAPA is given to those students with significant cognitive disabilities whose disabilities<br />
prevent them from taking either the CSTs with accommodations or modifications or the CMA with accommodations.<br />
The assessments under the STAR Program show how well students are doing in relation to the state content standards. On each of<br />
these assessments, student scores are reported as performance levels.<br />
For detailed information regarding the STAR Program results for each grade and performance level, including the percent of<br />
students not tested, see the CDE STAR Results Web site at http://star.cde.ca.gov.<br />
2011-12 <strong>School</strong> <strong>Accountability</strong> <strong>Report</strong> <strong>Card</strong> for <strong>Bernardo</strong> <strong>Heights</strong> <strong>Middle</strong> <strong>School</strong> Page 8 of 13
Standardized Testing and <strong>Report</strong>ing Results for All Students - Three-Year Comparison<br />
Percent of Students Scoring at Proficient or Advanced<br />
Subject<br />
<strong>School</strong> District State<br />
2009-10 2010-11 2011-12 2009-10 2010-11 2011-12 2009-10 2010-11 2011-12<br />
English-Language Arts 80 80 83 78 78 80 52 54 56<br />
Mathematics------- 69 69 71 69 69 69 48 50 51<br />
Science------- 91 83 90 80 81 83 54 57 60<br />
History-Social Science 81 77 78 68 71 71 44 48 49<br />
* Scores are not shown when the number of students tested is ten or less, either because the number of students in this category is too small for statistical<br />
accuracy or to protect student privacy.<br />
Standardized Testing and <strong>Report</strong>ing Results by Student Group - Most Recent Year<br />
Group<br />
Percent of Students Scoring at Proficient or Advanced<br />
English-Language Arts Mathematics Science History-Social Science<br />
All Students in the LEA 80 69 83 71<br />
All Student at the <strong>School</strong> 83 71 90 78<br />
Male------- 82 72 94 81<br />
Female------- 84 69 85 74<br />
Black or African American 77 60 100 88<br />
American Indian or Alaska Native<br />
Asian------- 89 90 94 90<br />
Filipino------- 91 80 97 93<br />
Hispanic or Latino 65 45 66 51<br />
Native Hawaiian/Pacific Islander<br />
White------- 84 70 91 77<br />
Two or More Races------- 83 62 89 79<br />
Socioeconomically Disadvantaged 67 51 79 55<br />
English Learners------- 38 44 55 32<br />
Students with Disabilities 48 26 76 32<br />
Students Receiving Migrant Education Services<br />
* Scores are not shown when the number of students tested is ten or less, either because the number of students in this category is too small for statistical<br />
accuracy or to protect student privacy.<br />
California High <strong>School</strong> Exit Examination<br />
The California High <strong>School</strong> Exit Examination (CAHSEE) is primarily used as a graduation requirement. However, the grade ten results<br />
of this exam are also used to establish the percentages of students at three proficiency levels (not proficient, proficient, or<br />
advanced) in ELA and mathematics to compute AYP designations required by the federal ESEA, also known as NCLB.<br />
For detailed information regarding CAHSEE results, see the CDE CAHSEE Web site at http://cahsee.cde.ca.gov/.<br />
2011-12 <strong>School</strong> <strong>Accountability</strong> <strong>Report</strong> <strong>Card</strong> for <strong>Bernardo</strong> <strong>Heights</strong> <strong>Middle</strong> <strong>School</strong> Page 9 of 13
California High <strong>School</strong> Exit Examination Results for All Students - Three-Year Comparison<br />
Subject<br />
<strong>School</strong> District State<br />
2009-10 2010-11 2011-12 2009-10 2010-11 2011-12 2009-10 2010-11 2011-12<br />
English-Language Arts 77 80 80 54 59 56<br />
Mathematics 81 80 83 54 56 58<br />
* Scores are not shown when the number of students tested is ten or less, either because the number of students in this category is too small for statistical<br />
accuracy or to protect student privacy.<br />
California High <strong>School</strong> Exit Examination Grade Ten Results by Student Group - Most Recent Year<br />
Group<br />
Not<br />
Proficient<br />
English-Language Arts<br />
Proficient<br />
Advanced<br />
Not<br />
Proficient<br />
Mathematics<br />
Proficient<br />
All Students in the LEA 20 27 53 17 40 43<br />
All Students at the <strong>School</strong><br />
Male-------<br />
Female-------<br />
Black or African American<br />
American Indian or Alaska Native<br />
Asian-------<br />
Filipino-------<br />
Hispanic or Latino<br />
Native Hawaiian/Pacific Islander<br />
White-------<br />
Two or More Races<br />
Socioeconomically Disadvantaged<br />
English Learners-------<br />
Students with Disabilities<br />
Students Receiving Migrant Education Services<br />
Advanced<br />
* Scores are not shown when the number of students tested is ten or less, either because the number of students in this category is too small for statistical<br />
accuracy or to protect student privacy.<br />
California Physical Fitness Test Results (<strong>School</strong> Year 2011-12)<br />
The California Physical Fitness Test (PFT) is administered to students in grades five, seven, and nine only. This table displays by grade<br />
level the percent of students meeting the fitness standards for the most recent testing period. For detailed information regarding<br />
this test, and comparisons of a school’s test results to the district and state, see the CDE PFT webpage at<br />
http://www.cde.ca.gov/ta/tg/pf/.<br />
Grade<br />
Level<br />
Percent of Students Meeting Fitness Standards<br />
Four of Six Standards Five of Six Standards Six of Six Standards<br />
-------7------- 13.4 26.6 52.9<br />
* Scores are not shown when the number of students tested is ten or less, either because the number of students in this category is too small for statistical<br />
accuracy or to protect student privacy.<br />
2011-12 <strong>School</strong> <strong>Accountability</strong> <strong>Report</strong> <strong>Card</strong> for <strong>Bernardo</strong> <strong>Heights</strong> <strong>Middle</strong> <strong>School</strong> Page 10 of 13
X. <strong>Accountability</strong><br />
Academic Performance Index<br />
The Academic Performance Index (API) is an annual measure of state academic performance and progress of schools in California.<br />
API scores range from 200 to 1,000, with a statewide target of 800. For detailed information about the API, see the CDE API webpage<br />
at http://www.cde.ca.gov/ta/ac/ap/.<br />
Academic Performance Index Ranks - Three-Year Comparison<br />
This table displays the school’s statewide and similar schools’ API ranks. The statewide API rank ranges from 1 to 10. A statewide<br />
rank of 1 means that the school has an API score in the lowest ten percent of all schools in the state, while a statewide rank of 10<br />
means that the school has an API score in the highest ten percent of all schools in the state.<br />
The similar schools API rank reflects how a school compares to 100 statistically matched “similar schools.” A similar schools rank of<br />
1 means that the school’s academic performance is comparable to the lowest performing ten schools of the 100 similar schools,<br />
while a similar schools rank of 10 means that the school’s academic performance is better than at least 90 of the 100 similar schools.<br />
API Rank 2009 2010 2011<br />
Statewide------- 10 10 9<br />
Similar <strong>School</strong>s------- 7 7 3<br />
Academic Performance Index Growth by Student Group – Three-Year Comparison<br />
Group<br />
Actual API Change<br />
2009-10 2010-11 2011-12<br />
All Students at the <strong>School</strong> 6 -3 9<br />
Black or African American<br />
American Indian or Alaska Native<br />
Asian------- 36 -12 14<br />
Filipino-------<br />
Hispanic or Latino -17 -17 -22<br />
Native Hawaiian/Pacific Islander<br />
White------- 0 4 5<br />
Two or More Races<br />
Socioeconomically Disadvantaged -16 19 18<br />
English Learners 13 -33 1<br />
Students with Disabilities 39 39 -17<br />
* "N/D” means that no data were available to the CDE or LEA to report. “B” means the school did not have a valid API Base and there is no Growth or target<br />
information. “C” means the school had significant demographic changes and there is no Growth or target information.<br />
2011-12 <strong>School</strong> <strong>Accountability</strong> <strong>Report</strong> <strong>Card</strong> for <strong>Bernardo</strong> <strong>Heights</strong> <strong>Middle</strong> <strong>School</strong> Page 11 of 13
Academic Performance Index Growth by Student Group - 2012 Growth API Comparison<br />
This table displays, by student group, the number of students included in the API and the 2012 Growth API at the school, district, and<br />
state level.<br />
Group<br />
2012 Growth API<br />
<strong>School</strong> District State<br />
# of Students Growth API # of Students Growth API # of Students Growth API<br />
All Students at the <strong>School</strong> 1,322 905 25,439 892 4,664,265 788<br />
Black or African American 47 875 715 803 313,217 710<br />
American Indian or Alaska Native 8 78 805 31,619 742<br />
Asian------- 232 959 4,821 953 404,682 905<br />
Filipino------- 87 932 1,737 885 124,840 869<br />
Hispanic or Latino 138 794 3,208 812 2,423,493 740<br />
Native Hawaiian/Pacific Islander 5 132 846 26,566 775<br />
White------- 747 910 13,801 896 1,222,181 853<br />
Two or More Races 58 879 939 905 88,438 849<br />
Socioeconomically Disadvantaged 172 818 3,624 795 2,779,679 737<br />
English Learners 169 832 3,949 838 1,530,298 716<br />
Students with Disabilities 141 682 2,833 703 530,935 607<br />
Adequate Yearly Progress<br />
The federal ESEA requires that all schools and districts meet the following Adequate Yearly Progress (AYP) criteria:<br />
• Participation rate on the state’s standards-based assessments in ELA and mathematics<br />
• Percent proficient on the state’s standards-based assessments in ELA and mathematics<br />
• API as an additional indicator<br />
• Graduation rate (for secondary schools)<br />
Detailed information about AYP, including participation rates and percent proficient results by student group, can be found at the<br />
CDE Adequate Yearly Progress (AYP) webpage at http://www.cde.ca.gov/ta/ac/ay/.<br />
Adequate Yearly Progress Overall and by Criteria (<strong>School</strong> Year 2011-12)<br />
AYP Criteria <strong>School</strong> District<br />
Made AYP Overall No No<br />
Met Participation Rate: English-Language Arts Yes Yes<br />
Met Participation Rate: Mathematics Yes Yes<br />
Met Percent Proficient: English-Language Arts No No<br />
Met Percent Proficient: Mathematics No No<br />
Met API Criteria Yes Yes<br />
Met Graduation Rate (if applicable) N/A Yes<br />
2011-12 <strong>School</strong> <strong>Accountability</strong> <strong>Report</strong> <strong>Card</strong> for <strong>Bernardo</strong> <strong>Heights</strong> <strong>Middle</strong> <strong>School</strong> Page 12 of 13
Federal Intervention Program (<strong>School</strong> Year 2012-13)<br />
<strong>School</strong>s and districts receiving federal Title I funding enter Program Improvement (PI) if they do not make AYP for two consecutive<br />
years in the same content area (ELA or mathematics) or on the same indicator (API or graduation rate). After entering PI, schools and<br />
districts advance to the next level of intervention with each additional year that they do not make AYP. For detailed information<br />
about PI identification, see the CDE PI Status Determinations webpage: http://www.cde.ca.gov/ta/ac/ay/tidetermine.asp.<br />
Program Improvement Status<br />
Indicator <strong>School</strong> District<br />
First Year of Program Improvement 2012-2013<br />
Year in Program Improvement Year 1<br />
Number of <strong>School</strong>s Currently in Program Improvement --- 2<br />
Percent of <strong>School</strong>s Currently in Program Improvement --- 5.4<br />
XI. Instructional Planning and Scheduling<br />
Professional Development<br />
This section provides information on the number of days provided for professional development and continuous professional growth<br />
in the most recent three year period. Questions that may be answered include:<br />
• What are the primary/major areas of focus for staff development and specifically how were they selected? For example, were<br />
student achievement data used to determine the need for professional development in reading instruction?<br />
• What are the methods by which professional development is delivered (e.g., after school workshops, conference attendance,<br />
individual mentoring, etc.)?<br />
• How are teachers supported during implementation (e.g., through in-class coaching, teacher-principal meetings, student<br />
performance, and data reporting, etc.)?<br />
Research supports the positive effects professional development has on increasing student learning. All teaching staff is afforded the<br />
opportunity to participate in district and site sponsored professional development. These workshops are presented in a semester or<br />
year-long series and support a wide variety of professional development. These include the use of effective instructional strategies,<br />
implementing the use of computer technology in teaching and learning, critical reading, writing and mathematics strategies,<br />
effective use of assessments, positive discipline in-services, and multicultural training. Teachers and administrators are actively<br />
involved in professional development activities at the school, district, state, and national level. The Poway Professional Assistance<br />
Program (PPAP) provides support for new teachers. Teachers are encouraged to participate in the National Board Certification<br />
process and recognized by the Poway Unified <strong>School</strong> District when they earn NBCT status.<br />
In PI<br />
2011-12 <strong>School</strong> <strong>Accountability</strong> <strong>Report</strong> <strong>Card</strong> for <strong>Bernardo</strong> <strong>Heights</strong> <strong>Middle</strong> <strong>School</strong> Page 13 of 13