APPENDIX I Toxicity Identification Evaluation Reports for Chollas ...
APPENDIX I Toxicity Identification Evaluation Reports for Chollas ...
APPENDIX I Toxicity Identification Evaluation Reports for Chollas ...

Create successful ePaper yourself
Turn your PDF publications into a flip-book with our unique Google optimized e-Paper software.
<strong>Toxicity</strong> <strong>Identification</strong> <strong>Evaluation</strong> of Sweetwater<br />
River Stormwater Using Selenastrum<br />
capricornutum August 2006<br />
4.1.2 Summary of TIE Per<strong>for</strong>med on October 18, 2005 Sample<br />
Table 3: Summary of Growth in TIE tests on Sweetwater Stormwater Sample Collected on October 18, 2005<br />
Test<br />
Control (Blank)<br />
– Dilution Water<br />
Mean Growth – Chlorophyll (RFU)<br />
50% 75%<br />
Stormwater Stormwater<br />
100%<br />
Stormwater<br />
NOEC LC 50<br />
Baseline 113.87 131.75 112.54 69.70 75 >100<br />
C-18 117.4 122.37 86.09 56.8 50 97.32<br />
EDTA 3 92.03 116.02 112.92 85.47 100 >100<br />
EDTA 8 83.91 131.37 131.28 106.96 100 >100<br />
PBO 0.25 87.07 119.17 109.66 83.64 100 >100<br />
PBO 0.50 93.16 137.63 116.7 71.34 100 >100<br />
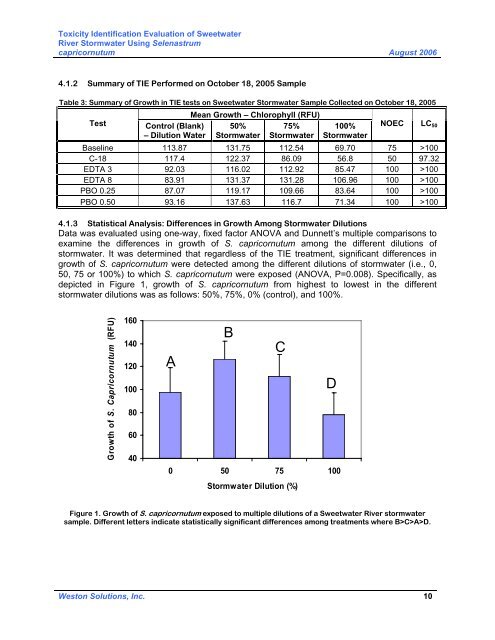
4.1.3 Statistical Analysis: Differences in Growth Among Stormwater Dilutions<br />
Data was evaluated using one-way, fixed factor ANOVA and Dunnett’s multiple comparisons to<br />
examine the differences in growth of S. capricornutum among the different dilutions of<br />
stormwater. It was determined that regardless of the TIE treatment, significant differences in<br />
growth of S. capricornutum were detected among the different dilutions of stormwater (i.e., 0,<br />
50, 75 or 100%) to which S. capricornutum were exposed (ANOVA, P=0.008). Specifically, as<br />
depicted in Figure 1, growth of S. capricornutum from highest to lowest in the different<br />
stormwater dilutions was as follows: 50%, 75%, 0% (control), and 100%.<br />
Growth of S. Capricornutum (RFU)<br />
160<br />
140<br />
120<br />
100<br />
80<br />
60<br />
40<br />
B<br />
C<br />
A<br />
D<br />
0 50 75 100<br />
Stormwater Dilution (%)<br />
Figure 1. Growth of S. capricornutum exposed to multiple dilutions of a Sweetwater River stormwater<br />
sample. Different letters indicate statistically significant differences among treatments where B>C>A>D.<br />
Weston Solutions, Inc. 10