

STUDY OF EMPLOYEE BENEFITS: 2006 & BEYOND - Prudential
STUDY OF EMPLOYEE BENEFITS: 2006 & BEYOND - Prudential
STUDY OF EMPLOYEE BENEFITS: 2006 & BEYOND - Prudential

You also want an ePaper? Increase the reach of your titles
YUMPU automatically turns print PDFs into web optimized ePapers that Google loves.
Teach Them Well<br />
Demographic and Social Trends Will Strongly Influence<br />
Future Benefit Offerings<br />
Thirty years ago, workplaces were treated as mostly homogeneous and companies<br />
struggled to make any benefits package available. Employers did not have the luxury<br />
or need to develop benefits solutions by employee segment.<br />
Today, the rapidly changing workforce is a reflection of our changing world and its<br />
economic forces. The pre-retiree and even retiree populations (from former “primary”<br />
careers) work alongside other generations. Multicultural and multilingual employees<br />
who are so important to our future, also have special benefits needs. Dual working<br />
parents, single parents, and empty nesters (no children at home) often require special<br />
consideration as well.<br />
Today, savvy companies and their HR functions seek to develop benefits programs<br />
that meet the needs of various employee segments to keep workforce retention and<br />
production high. Benefits providers must be effective partners, capable of developing<br />
benefits features and communications that meet the challenges of a modern 21st<br />
century workforce.<br />
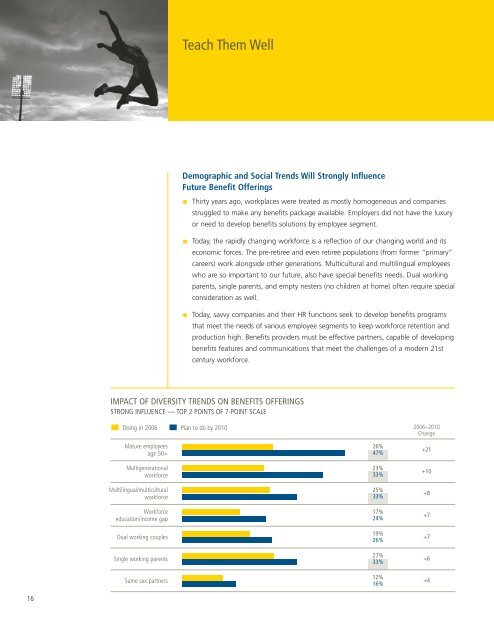
IMPACT <strong>OF</strong> DIVERSITY TRENDS ON <strong>BENEFITS</strong> <strong>OF</strong>FERINGS<br />
STRONG INFLUENCE — TOP 2 POINTS <strong>OF</strong> 7-POINT SCALE<br />
Doing in <strong>2006</strong> Plan to do by 2010<br />
Mature employees<br />
age 50+<br />
Multigenerational<br />
workforce<br />
Multilingual/multicultural<br />
workforce<br />
Workforce<br />
education/income gap<br />
Dual working couples<br />
Single working parents<br />
Same sex partners<br />
26%<br />
47%<br />
23%<br />
33%<br />
25%<br />
33%<br />
17%<br />
24%<br />
19%<br />
26%<br />
27%<br />
33%<br />
12%<br />
16%<br />
<strong>2006</strong>–2010<br />
Change<br />
+21<br />
+10<br />
+8<br />
+7<br />
+7<br />
+6<br />
+4<br />
16


