Detailed analysis of MSE spectra
Detailed analysis of MSE spectra
Detailed analysis of MSE spectra
SHOW LESS

Create successful ePaper yourself
Turn your PDF publications into a flip-book with our unique Google optimized e-Paper software.
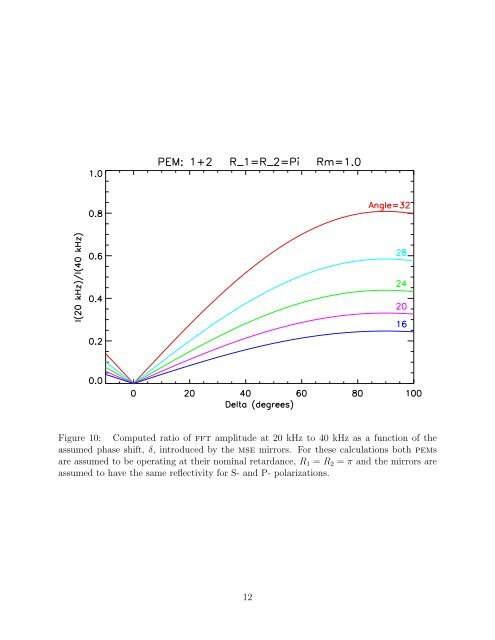
Figure 10: Computed ratio <strong>of</strong> fft amplitude at 20 kHz to 40 kHz as a function <strong>of</strong> the<br />
assumed phase shift, δ, introduced by the mse mirrors. For these calculations both pems<br />
are assumed to be operating at their nominal retardance, R 1 = R 2 = π and the mirrors are<br />
assumed to have the same reflectivity for S- and P- polarizations.<br />
12