Detailed analysis of MSE spectra
Detailed analysis of MSE spectra
Detailed analysis of MSE spectra

You also want an ePaper? Increase the reach of your titles
YUMPU automatically turns print PDFs into web optimized ePapers that Google loves.
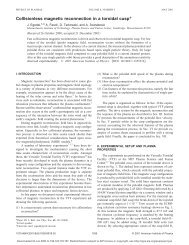
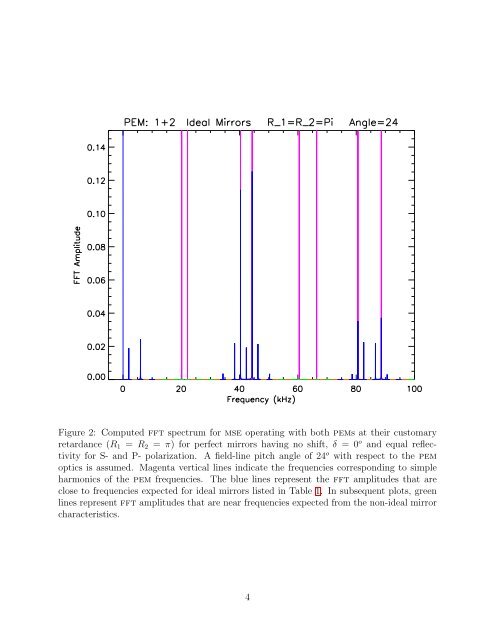
Figure 2: Computed fft spectrum for mse operating with both pems at their customary<br />
retardance (R 1 = R 2 = π) for perfect mirrors having no shift, δ = 0 o and equal reflectivity<br />
for S- and P- polarization. A field-line pitch angle <strong>of</strong> 24 o with respect to the pem<br />
optics is assumed. Magenta vertical lines indicate the frequencies corresponding to simple<br />
harmonics <strong>of</strong> the pem frequencies. The blue lines represent the fft amplitudes that are<br />
close to frequencies expected for ideal mirrors listed in Table 1. In subsequent plots, green<br />
lines represent fft amplitudes that are near frequencies expected from the non-ideal mirror<br />
characteristics.<br />
4