Annual Report - QPAC
Annual Report - QPAC
Annual Report - QPAC

Create successful ePaper yourself
Turn your PDF publications into a flip-book with our unique Google optimized e-Paper software.
QUEENSLAND PERFORMING ARTS TRUST<br />
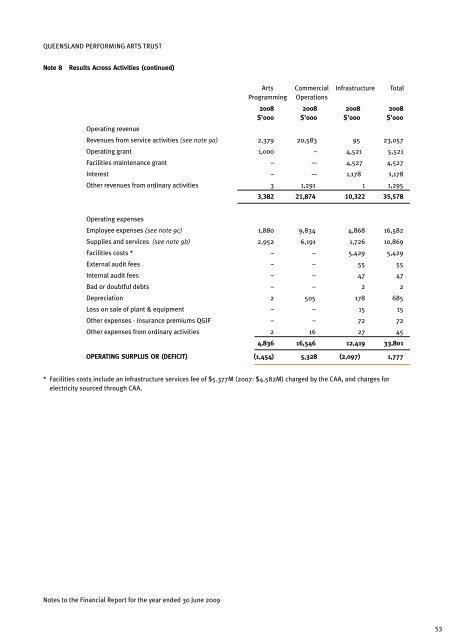
Note 8 Results Across Activities (continued)<br />
Operating revenue<br />
Arts Commercial Infrastructure Total<br />
Programming Operations<br />
2008 2008 2008 2008<br />
$’000 $’000 $’000 $’000<br />
Revenues from service activities (see note 9a) 2,379 20,583 95 23,057<br />
Operating grant 1,000 – 4,521 5,521<br />
Facilities maintenance grant – –- 4,527 4,527<br />
Interest – –- 1,178 1,178<br />
Other revenues from ordinary activities 3 1,291 1 1,295<br />
3,382 21,874 10,322 35,578<br />
Operating expenses<br />
Employee expenses (see note 9c) 1,880 9,834 4,868 16,582<br />
Supplies and services (see note 9b) 2,952 6,191 1,726 10,869<br />
Facilities costs * – – 5,429 5,429<br />
External audit fees – – 55 55<br />
Internal audit fees – – 47 47<br />
Bad or doubtful debts – – 2 2<br />
Depreciation 2 505 178 685<br />
Loss on sale of plant & equipment – – 15 15<br />
Other expenses - insurance premiums QGIF – – 72 72<br />
Other expenses from ordinary activities 2 16 27 45<br />
4,836 16,546 12,419 33,801<br />
OPERATING SURPLUS OR (DEFICIT) (1,454) 5,328 (2,097) 1,777<br />
* Facilities costs include an infrastructure services fee of $5.377M (2007: $4.582M) charged by the CAA, and charges for<br />
electricity sourced through CAA.<br />
Notes to the Financial <strong>Report</strong> for the year ended 30 June 2009<br />
53