Can back pain caused by symptom-giving sacroiliac joint relaxation ...
Can back pain caused by symptom-giving sacroiliac joint relaxation ...
Can back pain caused by symptom-giving sacroiliac joint relaxation ...

Create successful ePaper yourself
Turn your PDF publications into a flip-book with our unique Google optimized e-Paper software.
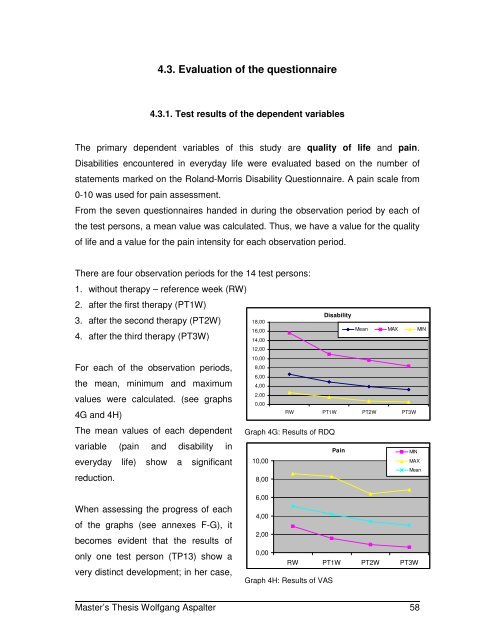
4.3. Evaluation of the questionnaire<br />
4.3.1. Test results of the dependent variables<br />
The primary dependent variables of this study are quality of life and <strong>pain</strong>.<br />
Disabilities encountered in everyday life were evaluated based on the number of<br />
statements marked on the Roland-Morris Disability Questionnaire. A <strong>pain</strong> scale from<br />
0-10 was used for <strong>pain</strong> assessment.<br />
From the seven questionnaires handed in during the observation period <strong>by</strong> each of<br />
the test persons, a mean value was calculated. Thus, we have a value for the quality<br />
of life and a value for the <strong>pain</strong> intensity for each observation period.<br />
There are four observation periods for the 14 test persons:<br />
1. without therapy – reference week (RW)<br />
2. after the first therapy (PT1W)<br />
3. after the second therapy (PT2W)<br />
4. after the third therapy (PT3W)<br />
For each of the observation periods,<br />
the mean, minimum and maximum<br />
values were calculated. (see graphs<br />
4G and 4H)<br />
The mean values of each dependent<br />
variable (<strong>pain</strong> and disability in<br />
everyday life) show a significant<br />
reduction.<br />
Disability<br />
18,00<br />
16,00<br />
Mean MAX MIN<br />
14,00<br />
12,00<br />
10,00<br />
8,00<br />
6,00<br />
4,00<br />
2,00<br />
0,00<br />
RW PT1W PT2W PT3W<br />
Graph 4G: Results of RDQ<br />
Pain<br />
MIN<br />
10,00<br />
MAX<br />
Mean<br />
8,00<br />
When assessing the progress of each<br />
of the graphs (see annexes F-G), it<br />
becomes evident that the results of<br />
only one test person (TP13) show a<br />
very distinct development; in her case,<br />
6,00<br />
4,00<br />
2,00<br />
0,00<br />
RW PT1W PT2W PT3W<br />
Graph 4H: Results of VAS<br />
Master’s Thesis Wolfgang Aspalter 58