Can back pain caused by symptom-giving sacroiliac joint relaxation ...
Can back pain caused by symptom-giving sacroiliac joint relaxation ...
Can back pain caused by symptom-giving sacroiliac joint relaxation ...

Create successful ePaper yourself
Turn your PDF publications into a flip-book with our unique Google optimized e-Paper software.
oth dependent variables, i.e. <strong>pain</strong> and disability, show continuous increase<br />
throughout the observation periods.<br />
4.3.2. Development of the primary dependent variables<br />
In order to assess the development of the dependent variables <strong>pain</strong> and disability<br />
throughout time, the values of the first observation period (RW) were compared to<br />
the values of the last observation period (PT3W). (see table annex H)<br />
The results of the observation period RW serve as a reference value at 100 %.<br />
Accordingly, the calculation of the difference between RW and PT3W shows the<br />
decrease in percent. A negative number indicates an increase in PT3W.<br />
RDQ (%) VAS (%)<br />
Max 86.21 81.28<br />
Mean 49.80 44.39<br />
Min excluding outlier 0.00 3.14<br />
MIN (outlier) -11.32 -30.64<br />
Table 4B: Decrease of dependent variables<br />
In table 4B, the mean, maximum<br />
and minimum values (including<br />
and excluding outlier) indicating<br />
the degree of change in <strong>pain</strong> and<br />
disability are shown in percent.<br />
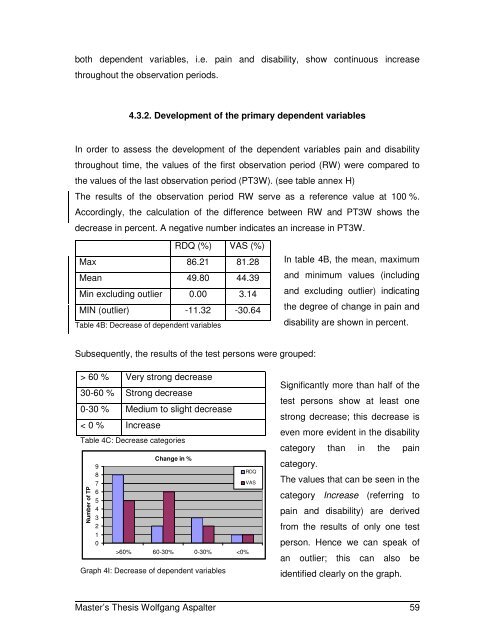
Subsequently, the results of the test persons were grouped:<br />
> 60 % Very strong decrease<br />
30-60 % Strong decrease<br />
0-30 % Medium to slight decrease<br />
< 0 % Increase<br />
Table 4C: Decrease categories<br />
Number of TP<br />
9<br />
8<br />
7<br />
6<br />
5<br />
4<br />
3<br />
2<br />
1<br />
0<br />
Change in %<br />
>60% 60-30% 0-30%