Group Financial Statements 2012 - Riverside
Group Financial Statements 2012 - Riverside
Group Financial Statements 2012 - Riverside

Create successful ePaper yourself
Turn your PDF publications into a flip-book with our unique Google optimized e-Paper software.
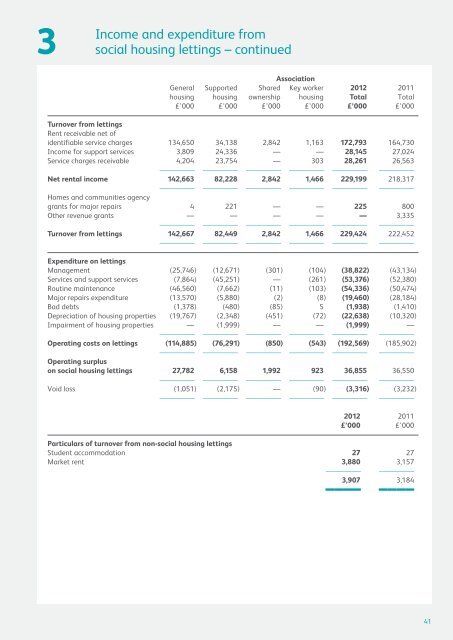
3<br />
Income and expenditure from<br />
social housing lettings – continued<br />
Association<br />
General Supported Shared Key worker <strong>2012</strong> 2011<br />
housing housing ownership housing Total Total<br />
£’000 £’000 £’000 £’000 £’000 £’000<br />
Turnover from lettings<br />
Rent receivable net of<br />
identifiable service charges 134,650 34,138 2,842 1,163 172,793 164,730<br />
Income for support services 3,809 24,336 — — 28,145 27,024<br />
Service charges receivable 4,204 23,754 — 303 28,261 26,563<br />
———— ———— ———— ———— ———— ————<br />
Net rental income 142,663 82,228 2,842 1,466 229,199 218,317<br />
———— ———— ———— ———— ———— ————<br />
Homes and communities agency<br />
grants for major repairs 4 221 — — 225 800<br />
Other revenue grants — — — — — 3,335<br />
———— ———— ———— ———— ———— ————<br />
Turnover from lettings 142,667 82,449 2,842 1,466 229,424 222,452<br />
———— ———— ———— ———— ———— ————<br />
Expenditure on lettings<br />
Management (25,746) (12,671) (301) (104) (38,822) (43,134)<br />
Services and support services (7,864) (45,251) — (261) (53,376) (52,380)<br />
Routine maintenance (46,560) (7,662) (11) (103) (54,336) (50,474)<br />
Major repairs expenditure (13,570) (5,880) (2) (8) (19,460) (28,184)<br />
Bad debts (1,378) (480) (85) 5 (1,938) (1,410)<br />
Depreciation of housing properties (19,767) (2,348) (451) (72) (22,638) (10,320)<br />
Impairment of housing properties — (1,999) — — (1,999) —<br />
———— ———— ———— ———— ———— ————<br />
Operating costs on lettings (114,885) (76,291) (850) (543) (192,569) (185,902)<br />
———— ———— ———— ———— ———— ————<br />
Operating surplus<br />
on social housing lettings 27,782 6,158 1,992 923 36,855 36,550<br />
———— ———— ———— ———— ———— ————<br />
Void loss (1,051) (2,175) — (90) (3,316) (3,232)<br />
———— ———— ———— ———— ———— ————<br />
<strong>2012</strong> 2011<br />
£’000 £’000<br />
Particulars of turnover from non-social housing lettings<br />
Student accommodation 27 27<br />
Market rent 3,880 3,157<br />
———— ————<br />
————<br />
3,907<br />
————<br />
3,184<br />
41