Group Financial Statements 2012 - Riverside
Group Financial Statements 2012 - Riverside
Group Financial Statements 2012 - Riverside

Create successful ePaper yourself
Turn your PDF publications into a flip-book with our unique Google optimized e-Paper software.
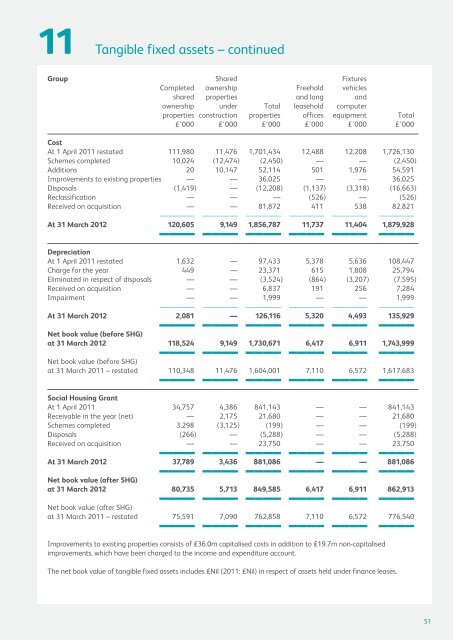
11<br />
Tangible fixed assets – continued<br />
<strong>Group</strong> Shared Fixtures<br />
Completed ownership Freehold vehicles<br />
shared properties and long and<br />
ownership under Total leasehold computer<br />
properties construction properties offices equipment Total<br />
£’000 £’000 £’000 £’000 £’000 £’000<br />
Cost<br />
At 1 April 2011 restated 111,980 11,476 1,701,434 12,488 12,208 1,726,130<br />
Schemes completed 10,024 (12,474) (2,450) — — (2,450)<br />
Additions 20 10,147 52,114 501 1,976 54,591<br />
Improvements to existing properties — — 36,025 — — 36,025<br />
Disposals (1,419) — (12,208) (1,137) (3,318) (16,663)<br />
Reclassification — — — (526) — (526)<br />
Received on acquisition — — 81,872 411 538 82,821<br />
———— ———— ———— ———— ———— ————<br />
At 31 March <strong>2012</strong><br />
————<br />
120,605<br />
————<br />
9,149<br />
————<br />
1,856,787<br />
————<br />
11,737<br />
————<br />
11,404<br />
————<br />
1,879,928<br />
Depreciation<br />
At 1 April 2011 restated 1,632 — 97,433 5,378 5,636 108,447<br />
Charge for the year 449 — 23,371 615 1,808 25,794<br />
Eliminated in respect of disposals — — (3,524) (864) (3,207) (7,595)<br />
Received on acquisition — — 6,837 191 256 7,284<br />
Impairment — — 1,999 — — 1,999<br />
———— ———— ———— ———— ———— ————<br />
At 31 March <strong>2012</strong><br />
————<br />
2,081<br />
————<br />
—<br />
————<br />
126,116<br />
————<br />
5,320<br />
————<br />
4,493<br />
————<br />
135,929<br />
———— ———— ———— ———— ———— ————<br />
Net book value (before SHG)<br />
at 31 March <strong>2012</strong> 118,524 9,149 1,730,671 6,417 6,911 1,743,999<br />
Net book value (before SHG)<br />
at 31 March 2011 – restated 110,348 11,476 1,604,001 7,110 6,572 1,617,683<br />
———— ———— ———— ———— ———— ————<br />
Social Housing Grant<br />
At 1 April 2011 34,757 4,386 841,143 — — 841,143<br />
Receivable in the year (net) — 2,175 21,680 — — 21,680<br />
Schemes completed 3,298 (3,125) (199) — — (199)<br />
Disposals (266) — (5,288) — — (5,288)<br />
Received on acquisition — — 23,750 — — 23,750<br />
————<br />
————<br />
————<br />
————<br />
————<br />
————<br />
————<br />
————<br />
————<br />
————<br />
————<br />
————<br />
———— ———— ———— ———— ———— ————<br />
———— ———— ———— ———— ———— ————<br />
Improvements to existing properties consists of £36.0m capitalised costs in addition to £19.7m non-capitalised<br />
improvements, which have been charged to the income and expenditure account.<br />
At 31 March <strong>2012</strong> 37,789 3,436 881,086 — — 881,086<br />
Net book value (after SHG)<br />
at 31 March <strong>2012</strong> 80,735 5,713 849,585 6,417 6,911 862,913<br />
Net book value (after SHG)<br />
at 31 March 2011 – restated 75,591 7,090 762,858 7,110 6,572 776,540<br />
The net book value of tangible fixed assets includes £Nil (2011: £Nil) in respect of assets held under finance leases.<br />
51