Group Financial Statements 2012 - Riverside
Group Financial Statements 2012 - Riverside
Group Financial Statements 2012 - Riverside

You also want an ePaper? Increase the reach of your titles
YUMPU automatically turns print PDFs into web optimized ePapers that Google loves.
11<br />
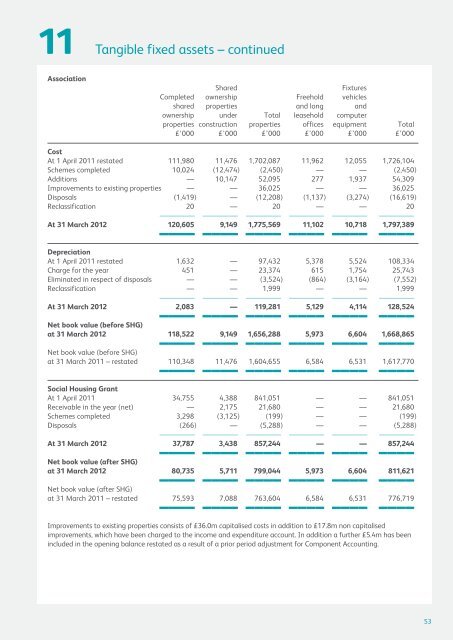
Tangible fixed assets – continued<br />
Association<br />
Shared<br />
Fixtures<br />
Completed ownership Freehold vehicles<br />
shared properties and long and<br />
ownership under Total leasehold computer<br />
properties construction properties offices equipment Total<br />
£’000 £’000 £’000 £’000 £’000 £’000<br />
Cost<br />
At 1 April 2011 restated 111,980 11,476 1,702,087 11,962 12,055 1,726,104<br />
Schemes completed 10,024 (12,474) (2,450) — — (2,450)<br />
Additions — 10,147 52,095 277 1,937 54,309<br />
Improvements to existing properties — — 36,025 — — 36,025<br />
Disposals (1,419) — (12,208) (1,137) (3,274) (16,619)<br />
Reclassification 20 — 20 — — 20<br />
———— ———— ———— ———— ———— ————<br />
At 31 March <strong>2012</strong><br />
————<br />
120,605<br />
————<br />
9,149<br />
————<br />
1,775,569<br />
————<br />
11,102<br />
————<br />
10,718<br />
————<br />
1,797,389<br />
Depreciation<br />
At 1 April 2011 restated 1,632 — 97,432 5,378 5,524 108,334<br />
Charge for the year 451 — 23,374 615 1,754 25,743<br />
Eliminated in respect of disposals — — (3,524) (864) (3,164) (7,552)<br />
Reclassification — — 1,999 — — 1,999<br />
———— ———— ———— ———— ———— ————<br />
At 31 March <strong>2012</strong><br />
————<br />
2,083<br />
————<br />
—<br />
————<br />
119,281<br />
————<br />
5,129<br />
————<br />
4,114<br />
————<br />
128,524<br />
———— ———— ———— ———— ———— ————<br />
Net book value (before SHG)<br />
at 31 March <strong>2012</strong> 118,522 9,149 1,656,288 5,973 6,604 1,668,865<br />
Net book value (before SHG)<br />
at 31 March 2011 – restated 110,348 11,476 1,604,655 6,584 6,531 1,617,770<br />
———— ———— ———— ———— ———— ————<br />
Social Housing Grant<br />
At 1 April 2011 34,755 4,388 841,051 — — 841,051<br />
Receivable in the year (net) — 2,175 21,680 — — 21,680<br />
Schemes completed 3,298 (3,125) (199) — — (199)<br />
Disposals (266) — (5,288) — — (5,288)<br />
———— ———— ———— ———— ———— ————<br />
At 31 March <strong>2012</strong> 37,787 3,438 857,244 — — 857,244<br />
———— ———— ———— ———— ———— ————<br />
———— ———— ———— ———— ———— ————<br />
———— ———— ———— ———— ———— ————<br />
Improvements to existing properties consists of £36.0m capitalised costs in addition to £17.8m non capitalised<br />
improvements, which have been charged to the income and expenditure account. In addition a further £5.4m has been<br />
included in the opening balance restated as a result of a prior period adjustment for Component Accounting.<br />
Net book value (after SHG)<br />
at 31 March <strong>2012</strong> 80,735 5,711 799,044 5,973 6,604 811,621<br />
Net book value (after SHG)<br />
at 31 March 2011 – restated 75,593 7,088 763,604 6,584 6,531 776,719<br />
53