IWMP-1 - Commissionerate of Rural Development Gujarat State
IWMP-1 - Commissionerate of Rural Development Gujarat State
IWMP-1 - Commissionerate of Rural Development Gujarat State

Create successful ePaper yourself
Turn your PDF publications into a flip-book with our unique Google optimized e-Paper software.
11<br />
2010-<br />
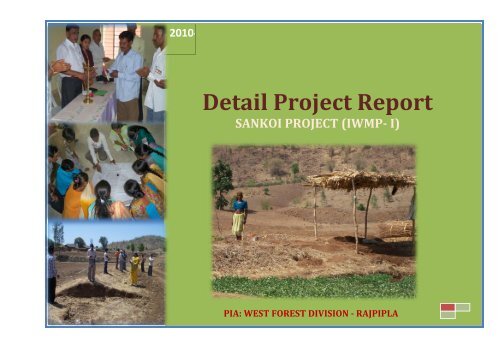
Detail Project Report<br />
SANKOI PROJECT (<strong>IWMP</strong>- I)<br />
PIA: WEST FOREST DIVISION - RAJPIPLA
Chapter 1 Project Background<br />
Table <strong>of</strong> Contents<br />
1.1Project Background……………………………………………………………………………………………………..……………....…....................................................................... 09<br />
Table no: 1 Basic Project Information ……………………………………………….……………………………..……………………..................................................................... 09<br />
Figure,1 Geographic location <strong>of</strong> Sankoi Project............................................................................................................................................................................................ 10<br />
1.2 Need <strong>of</strong> Watershed <strong>Development</strong> Programme. ………………………………………………………………………………...................................................................…. 11<br />
Table no. 2: Weightage <strong>of</strong> the project. …………………………………………………………………….……...……..................................................................................……… 11<br />
Table no. 2.1 Criteria and weightage for selection <strong>of</strong> watershed ……………………………………………………………………............…………................................ 12<br />
Table no.3: Watershed information …….………………………………………………………………………………………………........................................………………..…… 13<br />
1.3 Other developmental projects/schemes running in the Sankoi Project …………….……………………………….............................................. …………..……14<br />
Table no.4: <strong>Development</strong>al programmes running in the project area: ........................................................................................................ ...................................... 15<br />
Table no. 5: Previous Watershed programmes in the project area ........................................................................................................................................................15<br />
Figure,2 Geographical Condition <strong>of</strong> Sankoi project........................................................................................................................................................ ............................. 16<br />
Chapter 2 Project Implementing Agency<br />
2.1. Project Implementing Agency .................................................................................................................................................................................................................... 17<br />
2.2 About Project implementing Agency West Forest Division - Rajpipla....................................................................................................................................... 17<br />
2.2.1 The organization and its objectives: .................................................................... ................................................................................................................................ 17<br />
2.3 SWOT Analysis <strong>of</strong> the PIA: ............................................................................................................................................................................................................................ 18<br />
Table no. 6: PIA: .......................................................................................................................................................... ............................................................................................. 19<br />
Table no. 7: Staff at PIA level: ....................................................................................................................................................... ..................................................................... 19<br />
West Forest Division- Rajpipla Page 2
Chapter 3 Basic Information <strong>of</strong> the Project Area<br />
3.1. Geography and Geo-hydrology .................. ....................................................................... .............................................................................................. ........................ 20<br />
3.1.1 Land use pattern: .................................................................................................................................................................................................................................... ..... 20<br />
Table no. 8: Land use pattern: ........................................................................................................................................................................................................................... 21<br />
3.1.2 Soil and topography: ..................................................................................................................................................................................................... ............................. 21<br />
Table no. 9: Soil type and topography: ........................................................................................................................... ............................................................................... 22<br />
Table no. 10: Flood and drought condition: ................................................................................................................................................................................................. 22<br />
Table no. 11: Soil Erosion ............................................................................................................................................................................................ ................. ....................... 23<br />
Table no. 11.2: Soil Salinity/Alkalinity (Salinity ingress) ... ............................... .......................................................................... ........................................................ 23<br />
Table no. 11.3:Water logging condition ......................................................................................................................... ............................................................................... 24<br />
Table no.12: Climatic conditions .................................................................................................................................................................. .................................................... 24<br />
Table no. 13: Physiography and relief ............................................................................................................................................................................................................. 25<br />
3.1.3 Land and Agriculture: ................................................................................................................................................. ................................................................................ 25<br />
Table no. 14: Land ownership details......................................................................................................................................................... ..................................................... 26<br />
Table no. 15: Agriculture ....................................................................................................................................................................................................................................... 26<br />
Table no. 16: Irrigation ................................................................................................. ......................................................................................................................................... 27<br />
Table no. 17: Crop details: .................................................................................................................................................................................................................................... 28<br />
Figure ,3 Photographs <strong>of</strong> Bio-Physical Survey. ............................................................................................................................................................................................ 29<br />
3.1.4 Livestock: .................................................................................................................................................................... ...................................................................................... 30<br />
Table no. 18: Livestock .......................................................................................................................................................................................................................................... 30<br />
3.1.5 Drinking water ............................................................................................................................................................................................................ .................................. 31<br />
West Forest Division- Rajpipla Page 3
Table no. 19 : Drinking water...................................................................................................................................................................................................................... .... 31<br />
Table no. 20: Details <strong>of</strong> Common Property Resources ....................... ..................................................................................................................................................... 31<br />
3.2. Socio-Economic Pr<strong>of</strong>ile .................................................................................................................................................................................................................................. 33<br />
3.2.1 Demographic Status: ................................................................................................................................ ................................................................................................... 33<br />
Table no. 21: Demographic information ................................................................................................................................ ............................................ .......................... 33<br />
Table no. 22: Literacy rate ...................................................................................................................................................................................... ............................................. 34<br />
3.2.2 Migration Pattern: ..................................................................................................................................................................................................................... ................... 34<br />
Table no. 23: Migration details .......................................................................................................................................................................................................................... 35<br />
Table no. 24: Poverty............................................................................................................................................................................................................................................... 35<br />
3.2.3 Infrastructure facilities: ................................................................................................................................. ........................................................................................... 36<br />
Table no. 25: Village infrastructure ............................................................................................................................................... .................................................................... 36<br />
Table no. 26: Facilities / HH assets .................................................................................................................................................................................................................... 37<br />
Figure,4: Photographs <strong>of</strong> PRA.................................................................................................................................................................... ...................................................... 38<br />
3.3. Livelihood pattern: ........................................................................................................................................................................................................................... ............. 39<br />
Table no. 27: Per capita Income .......................................................................................................................................................................................................................... 39<br />
3.4 Dependence on Common Property Resource.............................................................. ...................................................................................................................... ... 39<br />
Table no.28: Dependence on Forest/CPR ........................................................................................................... ...................................................................................... ..... 39<br />
Table no. 29: Livelihood pattern (Occupational distribution).......................................................................................................................................................................40<br />
3.5 Comparative data <strong>of</strong> the crop productivity <strong>of</strong> the area: project area vs. District vs. <strong>State</strong> vs. Country: .............................................................................. 40<br />
Figure, 5 Comparative Productivity <strong>of</strong> Tur and Cotton in the project area, Bharuch dist., <strong>State</strong> and India Level.................................................. ............. 41<br />
Figure, 6 Comparative Productivity <strong>of</strong> Wheat Crop in the project area, Bharuch dist., <strong>State</strong> and India Level......................... ........................................... 42<br />
West Forest Division- Rajpipla Page 4
Chapter 4 Watershed Activities<br />
4.1. Scientific Planning: .............................................................................................. ........................................................... ...................................................................................... 44<br />
Table no. 30: Details <strong>of</strong> Scientific Planning and Inputs in <strong>IWMP</strong> projects ........................... ................................................................................................................... 46<br />
4.2. Institution building .......................................................................................................................................................................................................... ..................................... 47<br />
Table no. 31: Watershed Committee details......................................................................................................................................................................................................... 48<br />
Table no. 32: SHG details.............................................................................................................................. .................................................................................................................. 53<br />
Figure,7 Photographs <strong>of</strong> Focussed Group Discussion ......................................................................................... .......................................................................................... 55<br />
4.2.3 User Group: ................................................................................................................................................................................ ........................................................................... 56<br />
Table no. 33: UG detail............................................................................................................................................................................................ ............................. .......................... 56<br />
4.3. Physical activities to be undertaken under <strong>IWMP</strong>-I, Sankoi….................................................................................................................................................................58<br />
4.3.1 Entry Point activity (EPA) .......................................................................................................................................................................................................................... ........ 58<br />
Table no.34: Entry point activities (EPA) (All financial figures in lakh Rs. ).................................................................................................................................... ........ 58<br />
Figure,8 Photographs <strong>of</strong> EPA in Sankoi Project.................................................................................................................................................. .................................................. 59<br />
34.2 Estimation <strong>of</strong> Drinking Water Pipe Line..................................................................................................................................................................................................... 60<br />
34.1 Estimation <strong>of</strong> Hawada......................................................................................................................................................................................................................................... 60<br />
4.3.2.Watershed <strong>Development</strong> Works..................................................................................................................................................................................................................... 62<br />
Table no.35: Details <strong>of</strong> activities <strong>of</strong> preparatory phase (All financial figures in lakhs)...................................................................................................................... 64<br />
Table no.36: Activities related to Surface water resources in the project areas (all financial figures in lakh Rs.).................................................................. 64<br />
Table no. 37: Activities related to recharging ground water resources in the project area………................................................................................................... 66<br />
Table no. 38: Activities related to livelihoods by Self Help Groups (SHGs) in the project areas...................................................................................................... 66<br />
Table no. 39: Other activities <strong>of</strong> watershed works phase – Proposed target.............................................................................................................................................67<br />
West Forest Division- Rajpipla Page 5
Table no.40: Details <strong>of</strong> engineering structures in watershed works............................................................................................................................................................68<br />
Table No. 40.1: Estimation <strong>of</strong> Gully Plug .................................................................................................................................................................................................................. 71<br />
Table No. 40.2: Estimation <strong>of</strong> Stone Bunding ........................................................................................................................................................................................................72<br />
Table No 40.3 Estimation <strong>of</strong> Farm Bunding ......................................................................................................................................................................................................... 73<br />
Table No 40.4: Estimation <strong>of</strong> Nala Plug .......................... ........................................................................................................................................................................................74<br />
Table no 40.5: Estimation <strong>of</strong> Check dam ................................................ ..................................................................................................................................................................76<br />
Table no 40.6: Estimation <strong>of</strong> New Pond .................................................................................................. ................................................................................................................79<br />
Table no.41: Details <strong>of</strong> activities connected with vegetative cover in watershed works.................................................................................................................... 80<br />
Table No. 41.1: Estimation <strong>of</strong> fruit tree Plantation ................................................................................................................. ...........................................................................83<br />
Table No. 41.2: Estimation <strong>of</strong> fuel wood and timber Plantation ........................................................................................... ...................................................................... 83<br />
Table no.42: Details <strong>of</strong> allied / other activities.................................................................................................. . ............................................................................................... 84<br />
Table no.42.1: Estimation <strong>of</strong> Vermi Compost Unit.................................................................................................................... ......................................................................... 93<br />
Table no.42.2: Estimation <strong>of</strong> Animal Husbandary .......................................................................................................................................................................................... 94<br />
Table no.42.3: Estimation <strong>of</strong> utensils services................................................................................................................................................................................................. 95<br />
Table no.43: Details <strong>of</strong> activities in the CPRs in the project areas..................................................... ......................................................................................................... 96<br />
4.4. Capacity Building: ................................................................................................................................................................................................................................................. 98<br />
Table no. 44: Capacity Building Institution:.......................................................................................................................... .............................................................................. 98<br />
Table no. 45: Capacity Building plan......................................................................................................................................................................... ............................................. 99<br />
Table no.46: Information, education and Communication Activities........................................................................................................................................................ 99<br />
Figure,12 Photographs <strong>of</strong> Capacity Building :................................................................................................................................ ................................................................. 100<br />
West Forest Division- Rajpipla Page 6
Chapter 5 Budgeting<br />
Table no. 47: Village wise- activity wise budget............................................................................................................................................................................................... 101<br />
Table no. 48: Budget at a glance ........................................................................................................ .......................... ......................................................................................... 102<br />
Table no.49: Details <strong>of</strong> Convergence <strong>of</strong> <strong>IWMP</strong> with other Schemes......................................................................................................................................................... 102<br />
Table no.50: Details <strong>of</strong> Convergence <strong>of</strong> <strong>IWMP</strong> with other Schemes cost in lakh...................................................................................................................................103<br />
Chapter 6 Expected Outcome<br />
6.1 Expected Outcomes ......................................... .....................................................................................................................................................................................................107<br />
6.1.1 Employment .......................................................................... ..................................................... ..................................................................................... ................................. 107<br />
Table no. 51: Employment in Project area .................................................. ................................................................................................................ ……...............................108<br />
6.1.2.Migration ................................................................................................................................ .............................................................................................................................. 108<br />
Table no. 52: Details <strong>of</strong> seasonal migration from Project area ......................................................... ........................................................................................................ 108<br />
Table no. 6.1.3: Ground water Table .................................................................................................................... ............................................................................................... 109<br />
Table no. 53: Details <strong>of</strong> average ground water table depth in the project areas (in meters)......................................................................................................... 109<br />
6.1.4 Drinking water ........................................................................................................ ................................................................................................... …...................................109<br />
Table no. 54: Status <strong>of</strong> Drinking water ............................................................ ................................................................................................................................................... 109<br />
6.1.5 Crops .................................................................................................................................. ....................................................................................................................................110<br />
Table no. 55 : Details <strong>of</strong> crop area and yield in the project area ................................................................................................................................................................110<br />
Table no. 56: Area under horticulture...................................................................................................................................................................................................................113<br />
6.1.7 Vegetative cover ................................................................................................................................................................................................................................................ 113<br />
Table no. 57: Forest/vegetative cover ............................................................................... ................................................................................... ............................................. 113<br />
West Forest Division- Rajpipla Page 7
6.1.8 Livestock ....................................................................... ........................................................ ............................................................................................................................... 114<br />
Table no. 58: Details <strong>of</strong> livestock in the project areas ............................................................................................................................................ ......................................114<br />
6.1.9 Linckages..................................................................................................................................... ..........................................................................................................................118<br />
Table no. 59: Backward-Forward linkages .................................................................................................... ................................................................................................... 118<br />
6.2 Logical Framework Analysis ............................................................................................................................................................................................................................ 119<br />
Chapter 7 Quality and Sustainability Issue<br />
7.1 Plans for Monitoring and Evaluation............................................................................................................................................................................................................. 122<br />
7.2 Plans For Project management: .................................................. ................................................................................................................................. ..................................123<br />
7.3 Watershed <strong>Development</strong> Fund: ........................................................................................................................................................................................................................123<br />
7.4 User Charges: ................................................................................................................................................................................ ..........................................................................123<br />
Chapter 8 Mapping<br />
Figure.8.1: Map <strong>of</strong> Ground water ...........................................................................................................................................................................................................................124<br />
Figure.8.2: Land use map ......................................................................................................................................................................................................................................... 125<br />
Figure.8.3: River water body map..........................................................................................................................................................................................................................126<br />
Figure.8.4: Slope map ..................................................................................................................................................................................................................................................127<br />
Figure.8.5: Soil map .....................................................................................................................................................................................................................................................128<br />
Figure.8.6:Geomorphology map ..............................................................................................................................................................................................................................129<br />
Figure.8.7: Baseline map ............................................................................................................................................................................................................................................130<br />
Figure.8.8: Action plan map ....................................................................................................................................................................................................................................131<br />
West Forest Division- Rajpipla Page 8
CHAPTER-1<br />
PROJECT BACKGROUND<br />
1.1 Project Background<br />
Bharuch district comes under south <strong>Gujarat</strong> zone. Total geographical area <strong>of</strong> Bharuch district is 524683 ha. There are 543 village<br />
panchayats and 663 villages in the district. District is drained by Narmada, Dhadhar and Kim rivers. In 2009-10 there are 5 projects in Bharuch<br />
district namely Sankoi, Vasana, Rajwadi, Pingot and Jantran. It covers total area is 20686.9.<br />
Sankoi (<strong>IWMP</strong>-1) project is located in Jhagadia taluka, Bharuch district <strong>of</strong> <strong>Gujarat</strong>. This project is a cluster approach <strong>of</strong> 6 micro-watershed<br />
and nine villages. Total project area <strong>of</strong> this watershed is 5223.10 ha and all area has been undertaken to be treated under Integrated Watershed<br />
Management Program in the 2009-2010.<br />
The nearest town <strong>of</strong> the project is Netrang taluka which is 15 km away from the villages is well connected to the pucca road and well<br />
established market. The major community <strong>of</strong> the villages is Schedule Tribe that is 100 %. The livelihood <strong>of</strong> the project area is based on<br />
Agriculture, Animal Husbandry and wage labour<br />
Table no.1: Basic project information<br />
Sr.<br />
No.<br />
Name <strong>of</strong><br />
the<br />
project<br />
Name<br />
Villages<br />
Census code<br />
Gram<br />
Panchaya<br />
ts<br />
Taluka<br />
District<br />
Area <strong>of</strong> the<br />
project Ha.<br />
Area<br />
proposed to<br />
be treated Ha.<br />
Total<br />
project<br />
cost<br />
1 Sankoi Kharetha 210050159380000 Kharetha Jhagadi<br />
855.60 855.60 72.67<br />
Bharuch<br />
2 <strong>IWMP</strong>-1 Kund 210050159700000 Kharetha a<br />
152.60 152.60 18.31<br />
PIA<br />
West Forest Division- Rajpipla Page 9
3 Vandarveli 210050159390000 Kharetha 440.50 440.50 52.86 West<br />
4 Valpor 210050159720000 Bilatha 313.00 313.00 37.56 Forest<br />
5 Galiba 210050159730000 Bilatha 1007.70 1007.70 120.92 Division<br />
6 Fichvada 210050159710000 Kharetha 491.70 491.70 59.00 Rajpipla<br />
7 Rupghat 210050159930000 Bilatha 463.10 463.10 55.57<br />
8 Sankoi 210050159910000 Bilatha 1098.90 1098.90 131.87<br />
9 Varkhadi 210050159940000 Bilatha 400.00 400.00 48.00<br />
Bharuch District<br />
Sankoi Project<br />
Figure1, Geographic location <strong>of</strong> Sankoi project<br />
West Forest Division- Rajpipla Page 10
1.2 Need <strong>of</strong> watershed development program<br />
Watershed <strong>Development</strong> Programme is prioritised on the basis <strong>of</strong> thirteen parameters namely Poverty Index, Percentage <strong>of</strong> SC/ST,<br />
Actual wages, Percentage <strong>of</strong> small and marginal farmers, Ground water status, Moisture Index, Area under rainfed agriculture, Drinking water<br />
situation in the area, Percentage <strong>of</strong> the degraded land, Productivity potential <strong>of</strong> the land, Continuity <strong>of</strong> another watershed that has already<br />
developed/treated, Cluster approach for plain and Cluster approach for hilly terrain. Based on these thirteen parameters a composite ranking<br />
was given to Sankoi Watershed project as given in table no. 2.<br />
Total numbers <strong>of</strong> BPL families in this project are 1513 out <strong>of</strong> 1554, which is about 95%; hence the score is allotted 5. The percentage <strong>of</strong><br />
ST population in the area is 100 %; hence the score is allotted 3. The wage labour is 9.8% in the project area; hence the score is 5. The small and<br />
marginal farmers are above 30%. Ground water status <strong>of</strong> the project area is very less; hence the score is allotted 2.<br />
Since the rainfall received is erratic, the moisture index is low and the area is classified under forest area. Due to the Moderate Slope /<br />
Hilly topography, run<strong>of</strong>f is very high. Primary occupation <strong>of</strong> the project area is agriculture, based on rainfall. But due to the Moderate Slope /<br />
Hilly land, water is not available for cultivation purpose. So the production <strong>of</strong> the area is very low; hence the score is 10.<br />
All the parameters taken together give a cumulative score <strong>of</strong> 106 to the watershed. (Reference Table 2.1 below).<br />
Table no.2: Weightage <strong>of</strong> the project<br />
Project name<br />
Project type<br />
Weightage<br />
Sankoi <strong>IWMP</strong>-I i ii iii iv V vi vii viii ix x xi xii xiii Total<br />
5 3 5 3 2 0 5 5 5 10 5 10 10 68<br />
West Forest Division- Rajpipla Page 11
Table no. 2.1 Criteria and weightage for selection <strong>of</strong> watershed<br />
Sr.<br />
Maximum<br />
Criteria<br />
No.<br />
score<br />
Ranges & scores<br />
i Poverty index (% <strong>of</strong> poor<br />
to population)<br />
10 Above 80 % (10) 80 to 50 % (7.5) 50 to 20 % (5) Below 20<br />
% (2.5)<br />
ii % <strong>of</strong> SC/ ST population 10 More than 40 % (10) 20 to 40 % (5) Less than 20 % (3)<br />
iii Actual wages 5 Actual wages are<br />
significantly lower than<br />
minimum wages (5)<br />
Actual wages are<br />
equal to or higher<br />
than minimum wages<br />
(0)<br />
iv % <strong>of</strong> small and marginal 10 More than 80 % (10) 50 to 80 % (5) Less than 50 % (3)<br />
farmers<br />
v Ground water status 5 Over exploited (5) Critical (3) Sub critical (2) Safe (0)<br />
vi Moisture index/<br />
DPAP/ DDP Block<br />
15 -66.7 & below (15)<br />
DDP Block<br />
-33.3 to -66.6 (10)<br />
DPAP Block<br />
0 to -33.2 (0)<br />
Non DPAP/ DDP Block<br />
vii Area under rain-fed 15 More than 90 % (15) 80 to 90 % (10) 70 to 80% (5) Above 70<br />
agriculture<br />
viii Drinking water 10 No source (10) Problematic village<br />
(7.5)<br />
ix Degraded land 15 High – above 20 % (15) Medium – 10 to 20 %<br />
(10)<br />
x Productivity potential <strong>of</strong><br />
the land<br />
15 Lands with low<br />
production & where<br />
productivity can be<br />
significantly enhanced<br />
with reasonable efforts<br />
(15)<br />
Lands with moderate<br />
production & where<br />
productivity can be<br />
enhanced with<br />
reasonable efforts<br />
(10)<br />
Partially covered (5)<br />
Low- less than 10 %<strong>of</strong> TGA<br />
(5)<br />
Lands with high production<br />
& where productivity can be<br />
marginally enhanced with<br />
reasonable efforts (5)<br />
% (Reject)<br />
Fully<br />
covered<br />
(0)<br />
West Forest Division- Rajpipla Page 12
xi<br />
xii<br />
xiii<br />
Contiguity to another<br />
watershed that has<br />
already been developed/<br />
treated<br />
Cluster approach in the<br />
plains (more than one<br />
contiguous microwatersheds<br />
in the<br />
project)<br />
Cluster approach in the<br />
hills (more than one<br />
contiguous microwatersheds<br />
in the<br />
project)<br />
10 Contiguous to previously<br />
treated watershed &<br />
contiguity within the<br />
microwatersheds in the<br />
project (10)<br />
15 Above 6 microwatersheds<br />
in cluster<br />
(15)<br />
15 Above 5 microwatersheds<br />
in cluster<br />
(15)<br />
Contiguity within the<br />
microwatersheds in<br />
the project but non<br />
contiguous to<br />
previously treated<br />
watershed (5)<br />
4 to 6<br />
microwatersheds in<br />
cluster (10)<br />
3 to 5<br />
microwatersheds in<br />
cluster (10)<br />
Neither contiguous to<br />
previously treated<br />
watershed nor contiguity<br />
within the microwatersheds<br />
in the project (0)<br />
2 to 4 microwatersheds in<br />
cluster (5)<br />
2 to 3 microwatersheds in<br />
cluster (5)<br />
Total 150 150 90 41 2.5<br />
Table no.3: Watershed information<br />
Name <strong>of</strong> the<br />
project<br />
No. Of watersheds to be<br />
treated<br />
Sankoi <strong>IWMP</strong>-1 6<br />
Watershed code<br />
Kharetha - 5D1A6a1g<br />
Kund-5D1A4a1h<br />
Vandarveli - 5D1A6a1G<br />
Valpor - 5D1A6a1H<br />
Galiba - 5D1A6a1J<br />
Fichvada - 5D1A6a1H<br />
Rupghat - 5D1A3a1K<br />
Sankoi - 5D1A6a1G<br />
Varkhadi - 5D1A6a11<br />
Watershed<br />
regime/type/order<br />
Mini Watershed<br />
West Forest Division- Rajpipla Page 13
1.3 Other developmental projects/schemes running in the Sankoi project<br />
Jhagadia taluka is very back ward area, has been on top priority <strong>of</strong> a number <strong>of</strong> developmental projects. These programmes are namely<br />
Indira Awas Yojana (IAY), <strong>Gujarat</strong> Forest <strong>Development</strong> Project (G.F.D.P), Total Sanitation Campaign (TSC), Mahatma Gandhi National <strong>Rural</strong><br />
Employment Guarantee Scheme (MGNREGS), Tribal Sub Plan (TSP), Swarnajayanti Gram Swarojgar Yojana (SGSY) and Water and Sanitation<br />
Management Organisation (WASMO). Besides this, previously, one watershed project is also running in one village.<br />
{i} MGNREGS: Construction <strong>of</strong> check dams, deepening <strong>of</strong> village pond, farm bunding and Afforestation activity has been taken-up under<br />
MGNREGS.<br />
{ii} G.F.D.P: About five villages have covered by G.F.D.P. This works for CPR development in the village, provides employment to the people<br />
and conduct capacity building programs for villagers.<br />
{ii} Total Sanitation Campaign (TSC): Toilets are constructed under TSC programme in every village at each household level.<br />
{iv} Swarnjayanti Gram Swarozgar Yojana (SGSY) – Provides 50% subsidy linkage with bank for Animal Husbandry and some other<br />
livelihood activities in the project area.<br />
{v} TSP: This scheme works in only tribal area. This provides lift irrigation system, fisheries, and horticulture activities in the project area.<br />
{vi} Indira Awas Yojana: Provides home with toilet to the BPL families.<br />
{vii} WASMO: All villages have covered by this scheme for drinking water facility.<br />
{viii} IWDP-4: This project has covered one village in the project area.<br />
West Forest Division- Rajpipla Page 14
Table no.4: <strong>Development</strong>al programmes running in the project area:<br />
Sr. No.<br />
Name <strong>of</strong> the<br />
programme/scheme<br />
Sponsorin<br />
g agency<br />
Objectives <strong>of</strong> the<br />
programme/scheme<br />
Year <strong>of</strong><br />
commencement<br />
Villages<br />
covered<br />
Estimated<br />
number <strong>of</strong><br />
beneficiaries<br />
1 IAY D.R.D.A Housing facility 2005-2006 9 1273<br />
2 G.F.D.P. FOREST <strong>Gujarat</strong> Forest development Project 2009-2010 3<br />
3 TSC DRDA Sanitation campaign 2005-2006 9 1064<br />
4 MGNREGS DRDA Employment generation 2007-2008 9 1324<br />
5 TSP TSP Help tribal people 2000-2001 9 734<br />
6 SGSY DRDA Help to SHG & BPL families 2006 9 890<br />
7 WASMO Irrigation Drinking water facility 2007-2008 9 450<br />
255<br />
Table no. 5: Previous Watershed programmes in the project area:<br />
Sr Project<br />
no name<br />
Year<br />
started<br />
Name <strong>of</strong><br />
villages<br />
No. Of<br />
micro<br />
watershed<br />
Watershed<br />
codes<br />
Area<br />
under<br />
treatment<br />
Funding<br />
source<br />
Nodal<br />
agency PIA<br />
Total<br />
cost<br />
Rs.<br />
Exp.<br />
incurred<br />
up to<br />
start <strong>of</strong><br />
<strong>IWMP</strong><br />
% financial<br />
completion<br />
% physical<br />
completion<br />
1 Fichvada 2006-07 Fichvada 1 5D1A6a1H 150ha Govt DRDA T.P 900000 696953 77.43% 77.43%<br />
West Forest Division- Rajpipla Page 15
Figure-2: Geographical condition <strong>of</strong> the project area<br />
West Forest Division- Rajpipla Page 16
CHAPTER-2<br />
PROJECT IMPLEMENTING AGENCY<br />
2.1. Project Implementing Agency<br />
The Project Implementing Agencies (PIA) is selected by an appropriate mechanism by <strong>Gujarat</strong> <strong>State</strong> Watershed Management Agency<br />
(GSWMA), the <strong>State</strong> Level Nodal Agency (SLNA) for Integrated Watershed Management Programme (<strong>IWMP</strong>) in <strong>Gujarat</strong>. The PIAs are<br />
responsible for implementation <strong>of</strong> watershed project. These PIAs may include relevant line departments, autonomous organizations under<br />
<strong>State</strong>/ Central Governments, Government Institutes/ Research bodies, Intermediate Panchayats, Voluntary Organizations (VOs).The PIA for<br />
Sankoi watershed Project is District Social forestry division Bharuch.<br />
2.2 About Project Implementing Agency, Bharuch<br />
2.2.1 The organization and its objectives:<br />
PIA <strong>of</strong> the Sankoi project is Rajpipla West Forestry Division. The Deputy Conservator <strong>of</strong> Forest (DCF) is the head <strong>of</strong> division. PIA has<br />
dedicated and experienced staff comprising one Range Forest Officer (Nodal <strong>of</strong>ficer) and a watershed development team <strong>of</strong> civil engineer,<br />
agriculture expert and community mobiliser, Data Entry Operator, surveyor, and accountant. The objective <strong>of</strong> the PIA is supervising, planning,<br />
implementing, documenting and promoting watershed development projects and related developmental activities at project level as per<br />
guidelines. This also submits the documents at the district level.<br />
West Forest Division- Rajpipla Page 17
2.3 SWOT Analysis <strong>of</strong> the PIA:<br />
Strength:<br />
(1) Dedicated and experienced staff and a watershed development team<br />
(2) Independent state level department.<br />
(3) Strong linkages with national, state and district level institutions, agricultural universities, KVKs and NGOs for capacity building and<br />
technical guidance<br />
(4) Scientific planning in watershed projects with the help <strong>of</strong> BISAG, Gandhinagar,<br />
(5) Project level monitoring, coordination & Co-operation Committee<br />
Opportunities:<br />
(1) A number <strong>of</strong> different other development schemes <strong>of</strong> the government are running; so there can be horizontal integration and convergence<br />
<strong>of</strong> programmes<br />
(2) Better financial provision under <strong>IWMP</strong><br />
(3) Usage <strong>of</strong> new ICT tools like GIS, GPS<br />
Threats:<br />
(1) Moderate Slope / Hilly land in the project area, the activities planned to be taken up may yield limited impact<br />
West Forest Division- Rajpipla Page 18
Table no. 6: PIA:<br />
Sr. No. Names <strong>of</strong> project Details <strong>of</strong> PIA<br />
1 Sankoi - <strong>IWMP</strong>-1<br />
(i) Type <strong>of</strong> organization<br />
PIA (Project Implementation Agency)<br />
(ii Name <strong>of</strong> organization<br />
West Forest Division Rajpipla<br />
(iii) Designation & Address<br />
DFO Vadiya Pales Rajpipla<br />
(iv) Telephone (02640) 220124<br />
(v) Fax (02640) 220124<br />
(vi) E-mail<br />
dcfrjpw@yahoo.com<br />
Table no. 7: Staff at PIA level:<br />
Sr<br />
no<br />
Name Age Sex Designation Qualification<br />
Experience<br />
year<br />
Job assigned<br />
Monthly<br />
remuneration<br />
1 C.D. Chaudhari 55 M RFO B.sc Agri. 27<br />
Project<br />
Management<br />
33897<br />
2 Patel Nilamben V. 30 F WDT. Eng. Diploma Civil 9 Technical 8000<br />
3 Parekh Sanjaybhai B. 35 M WDT. Agri. MRS 5<br />
Agri.<br />
<strong>Development</strong><br />
8000<br />
4 Gavit Sushmaben B. 32 F WDT. Com. MSW 5 Com. Mobi. 8000<br />
5 Vankar Amrutbhai B. 41 M WDT. Surveyor Surveyor 11 Surveyor 6000<br />
6 Vasava Kelvin G. 22 M<br />
WDT. Computer<br />
Computer<br />
ITI. COPA 1<br />
Operator<br />
Operator<br />
5000<br />
West Forest Division- Rajpipla Page 19
CHAPTER-3<br />
BASIC INFORMATION OF THE PROJECT AREA<br />
3.1. Geography and Geo-hydrology<br />
3.1.1 Land use pattern:<br />
The net geographical area <strong>of</strong> Sankoi 5223.10 ha and all has proposed for <strong>IWMP</strong>-1, out <strong>of</strong> which 56.84% area is rainfed area. Project<br />
covers about 67.8% area under forest cover. About 91.40% <strong>of</strong> land is under agriculture which is almost rain-fed; mainly Kharif crops are taken<br />
in the area. Somehow extent farmers take Rabi crops in their farms. But they don’t cultivate Zaid crops in their fields. About 9% <strong>of</strong> the total land<br />
is classified under wasteland out <strong>of</strong> which only 1.5 percent land is cultivable and rest is uncultivable and hilly. About 1.58% land is also comes<br />
under permanent pasture land.<br />
West Forest Division- Rajpipla Page 20
Table no. 8: Land use pattern:<br />
Sr. No.<br />
Names <strong>of</strong><br />
villages<br />
Geographical<br />
Area <strong>of</strong> the<br />
village (Ha.)<br />
Forest Area<br />
(Ha.)<br />
Land under<br />
agricultural use<br />
(Ha.)<br />
Rain fed<br />
area (Ha.)<br />
Permanent<br />
pastures<br />
(Ha.)<br />
Wasteland (Ha.)<br />
Cultivable<br />
Noncultivable<br />
1 Kharetha 855.60 595.20 783.70 260.40 14.00 14.00 57.90<br />
2 Kund 152.60 152.60 152.60 152.60 - - -<br />
3 Vandarveli 440.50 330.00 392.40 110.60 24.00 24.00 24.10<br />
4 Valpor 313.00 105.10 276.90 208.60 6.00 6.00 30.10<br />
5 Galiba 1007.70 736.50 962.00 271.30 12.60 12.60 33.10<br />
6 Fichvada 491.70 323.60 402.80 168.10 15.00 15.00 73.90<br />
7 Rupghat 463.10 73.70 421.80 389.40 6.00 6.00 35.30<br />
8 Sankoi 1098.90 1098.90 1098.90 1098.90 - - -<br />
9 Varkhadi 400.00 90.80 283.00 209.20 5.20 5.20 111.80<br />
3.1.2 Soil and topography:<br />
Sankoi watershed project falls under south <strong>Gujarat</strong> Agro Climatic Zone. The soil is mainly Yellowish and Black in surface colour. The<br />
depth <strong>of</strong> soil is moderate to deep about 12 to 22 cm. The predominant texture <strong>of</strong> soil is loamy and clay. The soil fertility is very poor with low<br />
Nitrogen and Phosphorus. The topography <strong>of</strong> the area is Moderate Slope / Hilly ranging from 0-15% slope.<br />
West Forest Division- Rajpipla Page 21
The rainfall is good but due to the Moderate Slope / Hilly topography resulted in recurrent phenomenon <strong>of</strong> drought in every four to five<br />
years in this area. The average rainfall <strong>of</strong> this area is about 988.2 mm (from past five year data). This uneven distribution is leading to run<strong>of</strong>f <strong>of</strong><br />
soil every year to the streams and rivulets.<br />
Table no. 9: Soil type and topography:<br />
Sr. No.<br />
1<br />
Name <strong>of</strong> the Agro-climatic<br />
zone covers project area<br />
Area in<br />
(ha)<br />
Names <strong>of</strong> the<br />
villages<br />
Major soil types<br />
a)Type b) Area in ha<br />
Topography<br />
855.60 Kharetha Yellowish 855.60 Moderate Slope / Hilly<br />
2 152.60 Kund Yellowish 152.60 Moderate Slope / Hilly<br />
3 440.50 Vandarveli Yellowish 440.50 Moderate Slope / Hilly<br />
4 313.00 Valpor Yellowish, Black 313.00 Moderate Slope / Hilly<br />
5 South <strong>Gujarat</strong> 1007.70 Galiba Yellowish, Black 1007.70 Moderate Slope / Hilly<br />
6 491.70 Fichvada Yellowish 491.70 Moderate Slope / Hilly<br />
7 463.10 Rupghat Yellowish 463.10 Moderate Slope / Hilly<br />
8 1098.90 Sankoi Yellowish 1098.90 Moderate Slope / Hilly<br />
9 400.00 Varkhadi Yellowish, Black 400.00 Moderate Slope / Hilly<br />
West Forest Division- Rajpipla Page 22
Table no. 10: Flood and drought condition:<br />
Sr No Name Of Village Flood (Incidence) Drought (Incidence)<br />
1 Kharetha<br />
2 Kund<br />
3 Vandarveli<br />
4 Valpor<br />
5 Galiba<br />
6 Fichvada<br />
7 Rupghat<br />
8 Sankoi<br />
9 Varkhadi<br />
NA<br />
Once in Four to Five Years<br />
Table no. 11.1: Soil Erosion<br />
Cause Type <strong>of</strong> erosion Area affected (ha)<br />
Water erosion<br />
a Sheet 3978.40<br />
b Rill 745.95<br />
c Gully 248.65<br />
d Ravenous -<br />
Sub-Total 4973<br />
Wind erosion 4973<br />
Total<br />
Run <strong>of</strong>f<br />
(mm/ year)<br />
Average soil loss<br />
(Tonnes/ ha/ year)<br />
988.20 Yet not Measured<br />
West Forest Division- Rajpipla Page 23
Table no. 11.2: Soil Salinity/Alkalinity (Salinity ingress)<br />
Name <strong>of</strong> the Village Survey Number Soil pH<br />
Kharetha 91,167,144,137A 8.1<br />
Kund Forest 7.9<br />
Vandarveli 14,9,20,33 8.3<br />
Valpor 64,5,94,110 8.3<br />
Galiba 15,64,42,192 8.1<br />
Fichvada 8,46,38,45 8<br />
Rupghat 147,159,259,42 8.1<br />
Sankoi 15, Forest 8.2<br />
Varkhadi 29,44,16,35 8.1<br />
Type <strong>of</strong> Salinity<br />
(Inherent/Ingress)<br />
Ingress (Bhasmik)<br />
Table no. 11.3: Water logging Conditions<br />
Name <strong>of</strong> the Village Survey Number Reasons<br />
Kharetha<br />
Kund<br />
Vandarveli<br />
Valpor<br />
Galiba<br />
Fichvada<br />
Rupghat<br />
Sankoi<br />
Varkhadi<br />
NA<br />
West Forest Division- Rajpipla Page 24
Table no. 12: Climatic conditions:<br />
Name <strong>of</strong> project<br />
Sankoi-<strong>IWMP</strong>-1<br />
Village Name<br />
Kharetha<br />
Kund<br />
Vandarveli<br />
Valpor<br />
Galiba<br />
Fichvada<br />
Rupghat<br />
Sankoi<br />
Varkhadi<br />
Average rainfall- last<br />
5 years<br />
Average temperature ( o C)<br />
Summer<br />
Winter<br />
Max Min Max Min<br />
988.20 44 32 37 22<br />
Table no. 13: Physiography and relief<br />
Village Name Elevation (mt) Slope range (%) Major streams<br />
Kharetha 210<br />
Kund 207<br />
Vandarveli 200<br />
Valpor 196<br />
Galiba 196<br />
0-15% Karjan River<br />
Fichvada 231<br />
Rupghat 146<br />
Sankoi 203<br />
Varkhadi 156<br />
West Forest Division- Rajpipla Page 25
3.1.3 Land and Agriculture:<br />
Due to Moderate Slope / Hilly soil and lack <strong>of</strong> surface water sources, ground water has sufficient base for irrigation as well as for drinking<br />
purpose in every village. The average land holding <strong>of</strong> the project is about 1.25 ha ranging from 1 to 4 ha village to village. Lack <strong>of</strong> irrigation<br />
sources force the majority <strong>of</strong> the farmers to migrate to ensure their livelihood or work as a wage labour in another farmer’s field. This affects<br />
directly the demographic pr<strong>of</strong>ile <strong>of</strong> the village. The major crops in the project area cultivated by the farmers are Tur and Cotton in kharif season.<br />
Some <strong>of</strong> the farmers take wheat crop in Rabi season if rainfall is good. The land conservation measures such as bore in some villages help them<br />
to take up a Rabi crop <strong>of</strong> wheat in the residual moisture. But other soil and water conservation structures like farm bunding, nala plug, Check<br />
dam, recharge channel, gully plug, gabion structure and new pond will also help the farmers to taken up other crops like sugarcane, rice,<br />
irrigated wheat, vegetables and Zaid crops also.<br />
Table no. 14: Land ownership details<br />
Sr No<br />
Village<br />
Total owned land<br />
Gen OBC SC ST<br />
1 Kharetha 96<br />
2 Kund 0<br />
3 Vandarveli 31<br />
4 Valpor 79<br />
5 Galiba 124<br />
6 Fichvada 39<br />
7 Rupghat 65<br />
8 Sankoi 2<br />
9 Varkhadi 2 96<br />
HHs giving<br />
land on<br />
lease<br />
NA<br />
HHs taking<br />
land on<br />
lease<br />
West Forest Division- Rajpipla Page 26
Table no. 15: Agriculture<br />
Sr. No.<br />
Village<br />
Net sown area (Ha)<br />
One time Two times Three times<br />
1 Kharetha 188.48 Nil<br />
2 Kund 39.83 Nil<br />
3 Vandarveli 42.48 20.00<br />
4 Valpor 165.10 6.75<br />
5 Galiba 219.00 8.00<br />
NA<br />
6 Fichvada 79.24 Nil<br />
7 Rupghat 341.00 7.00<br />
8 Sankoi 73.61 Nil<br />
9 Varkhadi 190.15 2.00<br />
Table no. 16: Irrigation<br />
Sr no<br />
Village<br />
Well / Bore<br />
Availability months Net area (Ha) Gross area (Ha)<br />
1 Kharetha 0 0 0<br />
2 Kund 0 0 0<br />
3 Vandarveli 6 20 20<br />
4 Valpor 7 6.75 6.75<br />
5 Galiba 7 8 8<br />
6 Fichvada 0 0 0<br />
7 Rupghat 8 7 7<br />
8 Sankoi 0 0 0<br />
9 Varkhadi 7 2 2<br />
West Forest Division- Rajpipla Page 27
Table no. 17: Crop details:<br />
Village<br />
Kharif (Monsoon)<br />
Tur Cotton Rice<br />
Area<br />
(Ha)<br />
Production<br />
(Kg)<br />
Productivity<br />
(Kg/Ha)<br />
Area<br />
(Ha)<br />
Production<br />
(Kg)<br />
Productivity<br />
(Kg/Ha)<br />
Area<br />
(Ha)<br />
Production<br />
(Kg)<br />
1 Kharetha 91 36592 400 69 27600 400 28 9800 350<br />
2 Kund 23 9200 400 11 4400 400 6 2100 350<br />
3 Vandarveli 27 12150 450 9 4050 450 7 2800 400<br />
4 Valpor 87 43500 500 48 21600 450 31 12400 400<br />
5 Galiba 104 46800 450 78 35100 450 37 15725 425<br />
6 Fichvada 38 15200 400 26 10400 400 15 6000 400<br />
7 Rupghat 167 83500 500 105 52500 500 69 31050 450<br />
8 Sankoi 35 14000 400 24 10800 450 14 5600 400<br />
9 Varkhadi 109 49050 450 56 22400 400 25 10625 425<br />
Total 681 309992 455 426 188850 443 232 96100 415<br />
Sr.<br />
No.<br />
Productivity<br />
(Kg/Ha)<br />
Sr.<br />
No.<br />
Village<br />
Juvar<br />
Rabi (Winter)<br />
Wheat<br />
Area (Ha) Production (Kg) Productivity (Kg/Ha) Area (Ha) Production (Kg) Productivity (Kg/Ha)<br />
1 Kharetha 0 0 0 0 0 0<br />
2 Kund 0 0 0 0 0 0<br />
3 Vandarveli 15 5250 350 5 17.5 3.5<br />
4 Valpor 5 2000 400 1.75 612.5 350<br />
5 Galiba 6 2400 400 2 600 300<br />
6 Fichvada 0 0 0 0 0 0<br />
7 Rupghat 6 240 400 1 400 400<br />
8 Sankoi 0 0 0 0 0 0<br />
9 Varkhadi 1.5 600 400 0.5 150 300<br />
Total 33.5 12650 377.6 10.25 1780 173.65<br />
West Forest Division- Rajpipla Page 28
Figure-3: Biophysical survey <strong>of</strong> the villages<br />
West Forest Division- Rajpipla Page 29
3.1.4 Livestock:<br />
In the Sankoi project, there are 705 cows, 448 buffaloes, 707 goats, 545 bullocks and 610 hens. In maximum villages poultry is the main<br />
source <strong>of</strong> livelihood and in some villages cows and buffaloes are the source <strong>of</strong> income. Mainly cows and buffaloes are the local breed. Lack <strong>of</strong><br />
surface water, fodder and pasture availability for the animals has reduced the numbers in the project area. This leads to heavy migration <strong>of</strong> the<br />
villagers to other parts <strong>of</strong> the state. Milk production is very low in the project area. There is no dairy cooperative in any village. Average milk <strong>of</strong><br />
cow is 1-1.5 lit/day and for buffalo is 2-3 lit/day.<br />
Table no. 18: Livestock<br />
Sr. No.<br />
Village<br />
No<br />
Buffalo<br />
Milk<br />
(lit/day)<br />
No<br />
Cow<br />
Milk<br />
(lit/day)<br />
Total Milk<br />
(Buffalo+Cow)<br />
Milk (lit/day)<br />
No<br />
Goat Bullock Hen<br />
Milk<br />
(lit/day)<br />
1 Kharetha 45 135 185 370 505 150 0 55 27<br />
2 Kund 20 60 40 80 140 35 0 20 25<br />
3 Vandarveli 25 75 35 70 145 55 0 40 70<br />
4 Valpor 90 270 80 160 430 62 0 41 65<br />
5 Galiba 106 318 120 240 558 115 0 71 100<br />
6 Fichvada 53 159 45 90 249 80 0 50 85<br />
7 Rupghat 34 102 50 100 202 50 0 80 102<br />
8 Sankoi 30 90 60 120 210 70 0 50 79<br />
9 Varkhadi 45 135 90 180 315 90 0 138 57<br />
West Forest Division- Rajpipla Page 30
3.1.5 Drinking water:<br />
Sources <strong>of</strong> drinking water in the project area are open well and pump. These provide drinking water facilities to the villagers up to 9-10<br />
month regularly and remaining time irregularly. So these remaining months they face the problem <strong>of</strong> drinking water. The quality <strong>of</strong> the water is<br />
contaminated also. The ground water table <strong>of</strong> the villages are also very low about 40-45mt.<br />
Table no. 19: Drinking water<br />
Sr. No. Village Ground water table (mt) Source <strong>of</strong> drinking water Availability in months Quality<br />
1 Kharetha<br />
2 Kund<br />
3 Vandarveli<br />
4 Valpor<br />
5 Galiba<br />
6 Fichvada<br />
7 Rupghat<br />
8 Sankoi<br />
9 Varkhadi<br />
40 to 45 Open Well, Handpump<br />
9 month regular,<br />
3 month irregular<br />
Contaminated<br />
Table no. 20: Details <strong>of</strong> Common Property Resources<br />
Sr.<br />
No<br />
.<br />
Names <strong>of</strong><br />
project<br />
CPR Particulars<br />
Pvt.<br />
persons<br />
Total Area (ha)<br />
Area owned/ In possession <strong>of</strong><br />
Govt. (specify<br />
deptt.)<br />
PRI<br />
Any other<br />
(Pl. Specify)<br />
Area available for treatment (ha)<br />
Pvt.<br />
persons<br />
Govt. (sp.<br />
deptt.)<br />
PRI<br />
Any other<br />
(Pl. Specify)<br />
1 Kharetha<br />
Wasteland/ degraded land 25.1<br />
Pastures 12.08 21.53<br />
Forest 595.08<br />
West Forest Division- Rajpipla Page 31
2 Kund<br />
3 Vanderveli<br />
4 Valpor<br />
5 Galiba<br />
6 Fichwada<br />
7 Rupghat<br />
8 Sankoi<br />
9 Varkhadi<br />
Total 632.26 21.53<br />
Forest 152.6 8.8<br />
Total 152.6 8.82<br />
Wasteland/ degraded land 4.44<br />
Pastures 24.01 7.85<br />
Forest 329.96<br />
Total 358.41 7.85<br />
Pastures 5.95 2<br />
Forest 105.14<br />
Smashan 1.03<br />
Total 112.12 2<br />
Wasteland/ degraded land 12.08<br />
Pastures 12.55 10<br />
Forest 731.12 15.85<br />
Dhor Dabbo 0.85<br />
Total 756.6 25.85<br />
Wasteland/ degraded land 34.44 10.85<br />
Pastures 24.62 12<br />
Forest 330.55<br />
Total 389.61 22.85<br />
Pastures 5.18 5<br />
Forest 73.68 4.35<br />
Total 78.86 9.35<br />
Wasteland/ degraded land 973.99 13.73<br />
Forest 114.33<br />
Total 1088.32 13.73<br />
Wasteland/ degraded land 19.56 7.84<br />
Pastures 7.02<br />
Forest 90.81<br />
Total 117.39 7.84<br />
West Forest Division- Rajpipla Page 32
3.2. Socio-Economic Pr<strong>of</strong>ile<br />
3.2.1 Demographic Status:<br />
Sankoi project covers 9 villages in Jhagadia taluka. It covers 1554 household with 7778 population (as per base-line survey) out <strong>of</strong> which<br />
3923 are male and 3855 are female. Sex ratio <strong>of</strong> the area is 982 female to 1000 male. This ratio varies from village to village from 910 to 1015.<br />
In the project area only Schedule Tribe are there. The average family size <strong>of</strong> the villages is 4. There are 1513 BPL families in the project area. The<br />
literacy rate <strong>of</strong> the area is 42.47%, out <strong>of</strong> which male literacy rate is 28.0% and female literacy rate is 39.09%. This is very low due to lack <strong>of</strong><br />
awareness in villagers. High school is far away from the villages and transport facility is also very bad in the villages so people can’t go to the<br />
high school. Majority <strong>of</strong> population is involved as a wage labour in agriculture and animal husbandry.<br />
Table no. 21: Demographic information<br />
Sr.<br />
No.<br />
Village Population SC ST<br />
1 Kharetha 1322 655 667<br />
Total Male Female Total Male Female % Total Male Female %<br />
1322 655 667 100<br />
2 Kund 189 99 90 189 99 90 100<br />
3 Vandarveli 251 125 126 251 125 126 100<br />
4 Valpor 880 443 437 880 443 437 100<br />
5 Galiba 1371 691 680 NA<br />
1371 691 680 100<br />
6 Fichvada 578 292 286 578 292 286 100<br />
7 Rupghat 589 283 306 589 283 306 100<br />
8 Sankoi 1819 936 883 1819 936 883 100<br />
9 Varkhadi 779 399 380 779 399 380 100<br />
West Forest Division- Rajpipla Page 33
Table no. 22: Literacy rate<br />
Sr. No.<br />
Village<br />
Total<br />
Population<br />
Literacy<br />
Total % Male % Female %<br />
1 Kharetha 1322 505 38 365 28 140 11<br />
2 Kund 189 57 30 45 24 12 6<br />
3 Vandarveli 251 98 39 57 23 41 16<br />
4 Valpor 880 328 37 223 25 105 12<br />
5 Galiba 1371 542 40 360 26 182 13<br />
6 Fichvada 578 127 22 93 16 34 6<br />
7 Rupghat 589 239 41 157 27 82 14<br />
8 Sankoi 1819 1144 63 684 38 460 25<br />
9 Varkhadi 779 264 34 194 25 70 9<br />
3.2.2 Migration Pattern:<br />
Migration percentage <strong>of</strong> the project area is 9 to 10%. People migrate during summer season to different parts <strong>of</strong> the state like Surat and<br />
Rajkot as daily wagers, agricultural labours and construction workers. Lack <strong>of</strong> landholding, fodder availability and grazing land for smaller<br />
ruminant force these people to migrate to other places.<br />
West Forest Division- Rajpipla Page 34
Table no. 23: Migration details<br />
Migration Migration by months Main<br />
Sr.<br />
Total<br />
Village<br />
reason for<br />
No.<br />
population<br />
Up to 3 3-6 More than<br />
Total Male Female<br />
months months 6 months migration<br />
1 Kharetha 1322 135 88 47 135<br />
2 Kund 189 15 10 5 15<br />
3 Vandarveli 251 25 18 7 25<br />
4 Valpor 880 90 78 12 90<br />
Lack <strong>of</strong><br />
5 Galiba 1371 135 95 40 135 NA NA Employme<br />
6 Fichvada 578 55 44 11 55<br />
nt<br />
7 Rupghat 589 60 47 13 60<br />
8 Sankoi 1819 110 73 37 110<br />
9 Varkhadi 779 75 46 29 75<br />
Income<br />
(Rs.)during<br />
migration / month<br />
3000to4000<br />
Table no. 24: Poverty<br />
Sr. No.<br />
Village<br />
Total<br />
Household<br />
BPL<br />
0-16 16-20 Total<br />
Total Land less HH<br />
% <strong>of</strong> land less HH<br />
1 Kharetha 247 311 23 334 13 5<br />
2 Kund 38 50 0 50 2 5<br />
3 Vandarveli 59 55 4 59 3 5<br />
4 Valpor 191 193 27 220 9 5<br />
5 Galiba 273 216 102 318 12 4<br />
6 Fichvada 103 146 14 160 6 6<br />
7 Rupghat 126 68 68 136 5 4<br />
8 Sankoi 332 256 129 385 16 5<br />
9 Varkhadi 185 218 54 272 9 5<br />
West Forest Division- Rajpipla Page 35
3.2.3 Infrastructure facilities:<br />
Majority <strong>of</strong> villages in the project is connected with pucca road. Only one village Varkhadi doesn’t have pucca road. There is Lower<br />
primary school in every village but no upper primary and high school in the villages. People go to the Netrang taluka for their upper education<br />
which is 15 km away from the villages. Villages do not have any Primary Health Centre, bank and Post <strong>of</strong>fice for which villagers have to go to<br />
Netrang taluka which is 15 Km. away from the villages. People <strong>of</strong> these villages go the nearest taluka place for selling and buying <strong>of</strong> the products.<br />
No villages have milk collection centre and milk cooperative. About 67-70% households have electrical facility and 40-45% families have latrine<br />
facility.<br />
Table no. 25: Village infrastructure<br />
Sr.<br />
No<br />
.<br />
Village<br />
Pucca<br />
road to<br />
the<br />
village<br />
(Y/N)<br />
Schools<br />
LP UP HS<br />
Colleges<br />
(No.)<br />
Post Office<br />
(Distance)<br />
Banks<br />
(No.)<br />
Distanc<br />
e from<br />
nearest<br />
market<br />
yard<br />
Milk<br />
collectio<br />
n centre<br />
(No.)<br />
Milk<br />
cooperati<br />
ve (No.)<br />
Other<br />
cooperativ<br />
es / CBIs<br />
(Number)<br />
1 Kharetha Y Y N N N N Y 13 N N N N<br />
2 Kund Y Y N N N N N 12 N N N N<br />
3 Vandarveli Y Y N N N N N 11 N N N N<br />
4 Valpor Y Y N N N N N 15 N N N N<br />
5 Galiba Y Y N N N N N 14 N N N N<br />
6 Fichvada N Y N N N N N 20 N N N N<br />
7 Rupghat Y Y N N N N N 17 N N N N<br />
8 Sankoi Y Y N N N N N 10 N N N N<br />
9 Varkhadi N Y N N N N N 17 N N N N<br />
Any<br />
other<br />
institu<br />
tion<br />
West Forest Division- Rajpipla Page 36
Table no. 26 : Facilities / HH assets<br />
Sr.<br />
No.<br />
Village<br />
HHs with<br />
electricity<br />
HHs<br />
with<br />
safety<br />
latrines<br />
Land<br />
line<br />
HHs with<br />
phones<br />
Mobile<br />
HHs with vehicle<br />
2-<br />
wheeler<br />
4-<br />
wheeler<br />
HHs with<br />
TV set<br />
HHs with<br />
cooking<br />
gas<br />
HHs with<br />
Drinking<br />
water<br />
HHs<br />
with<br />
freedge<br />
1 Kharetha 113 110 7 4 7 0 14 N 0 1<br />
2 Kund 30 12 1 3 2 0 3 N 0 2<br />
3 Vandarveli 40 23 2 4 4 1 5 N 0 0<br />
4 Valpor 187 85 4 13 10 1 10 N 0 2<br />
5 Galiba 185 125 13 8 14 0 33 N 0 7<br />
6 Fichvada 64 49 20 15 4 0 4 N 0 1<br />
7 Rupghat 92 55 13 7 8 0 3 N 0 0<br />
8 Sankoi 162 142 43 27 40 2 18 N 0 2<br />
9 Varkhadi 179 89 3 15 12 0 10 N 0 3<br />
West Forest Division- Rajpipla Page 37
Figure 4, PRA in Sankoi Project<br />
West Forest Division- Rajpipla Page 38
3.3. Livelihood pattern:<br />
The villagers earn their livelihood from agriculture and animal husbandry and during summer seasons they migrate for daily wage<br />
labourers in Rajkot, Ankleshwar and Surat.<br />
Table no. 27: Income<br />
Sr. No. Village Agriculture Animal husbandry Casual labour Others Total<br />
1 Kharetha 4935 830 2100 2075 9940<br />
2 Kund 4103 792 2075 1980 8950<br />
3 Vandarveli 5109 726 2050 1815 9700<br />
4 Valpor 6159 418 2200 1043 9820<br />
5 Galiba 5813 442 2070 1105 9430<br />
6 Fichvada 4930 660 2025 1650 9265<br />
7 Rupghat 5679 690 2200 1724 10293<br />
8 Sankoi 5738 636 2195 1589 10158<br />
9 Varkhadi 6153 390 2180 975 9698<br />
3.4 Dependence on forest/Common Property Resource<br />
Forest is covered in all villages. Villagers use forest for fuel and fodder purpose.<br />
Table no.28: Dependence on Forest/CPR<br />
Sr. No.<br />
Village<br />
Fuel Other Total<br />
% sells Income % sells Income income<br />
1 Kharetha 12 1200 9 875 2075<br />
2 Kund 12 1080 10 900 1980<br />
3 Vandarveli 11 1025 8 790 1815<br />
4 Valpor 11 1043 0 0 1043<br />
5 Galiba 12 1105 0 0 1105<br />
6 Fichvada 11 1025 7 625 1650<br />
7 Rupghat 10 1019 7 705 1724<br />
8 Sankoi 11 1134 4 455 1589<br />
9 Varkhadi 10 975 0 0 975<br />
West Forest Division- Rajpipla Page 39
Table no. 29: Livelihood pattern (Occupational distribution)<br />
Sr.<br />
No.<br />
Village<br />
Total<br />
workforce<br />
Agriculture<br />
Animal<br />
husbandry (AH)<br />
Agriculture +<br />
AH<br />
Casual<br />
labour<br />
Services Handicraft Others<br />
1 Kharetha 660 403 79 99 66 7 0 7<br />
2 Kund 95 58 11 14 10 1 0 1<br />
3 Vandarveli 125 76 15 19 13 1 0 1<br />
4 Valpor 441 269 53 66 44 4 0 4<br />
5 Galiba 687 419 82 103 69 7 0 7<br />
6 Fichvada 290 177 35 44 29 3 0 3<br />
7 Rupghat 292 168 35 44 29 3 10 3<br />
8 Sankoi 915 558 110 137 92 9 0 9<br />
9 Varkhadi 391 231 47 59 39 4 8 4<br />
3.5. Comparative data <strong>of</strong> the crop productivity <strong>of</strong> the area: project area vs. District vs. <strong>State</strong> vs. Country vs. World<br />
“The term productivity in general means the total output per unit <strong>of</strong> factor input. For example land productivity means output per<br />
hectare <strong>of</strong> land. Productivity is an average and is calculated by dividing the total output <strong>of</strong> a particular crop by the total cultivated area under<br />
that crop.”<br />
Data are made available by the Baseline survey (for all sixteen villages), Handbook <strong>of</strong> Agriculture, ICAR publication 2006 (For <strong>Gujarat</strong><br />
and India), and Final district plan (DAP) <strong>of</strong> Dept. <strong>of</strong> Agriculture (for Bharuch). The results indicate that Sankoi project has very low productivity<br />
compared to world, India, <strong>Gujarat</strong> and Bharuch. The productivity is low not only because that the land is unproductive or the farmer’s lack the<br />
skills to manage their crop but also due lack to <strong>of</strong> source <strong>of</strong> irrigation.<br />
West Forest Division- Rajpipla Page 40
In Sankoi project people grow crops are Tur and Cotton in Kharif season. And if irrigation facility is good and rainfall is good, they take<br />
Rabi crops like Wheat and Rabi sorghum. The main crop <strong>of</strong> the project area is Tur. The productivity <strong>of</strong> Tur in India is 678 kg/ha. In <strong>Gujarat</strong> state<br />
the productivity <strong>of</strong> this is 989 kg/ ha. In Bharuch district this is 725 kg/ha. In the project area out <strong>of</strong> 5223.10 ha, Tur is grown in only 681 ha<br />
area with the production <strong>of</strong> 309.99 tonne. So the productivity <strong>of</strong> the area is 455 kg/ha. This is very low with respective to district, state as well<br />
as national level.<br />
Again this is the same condition with cotton. The productivity <strong>of</strong> Cotton in India is 466 kg/ha. In <strong>Gujarat</strong> state the productivity <strong>of</strong> this is<br />
625 kg/ ha. In Bharuch district this is 510 kg/ha. In the project area Cotton is grown in only 426 ha area with the production <strong>of</strong> 188.85 tonne<br />
and the productivity <strong>of</strong> the area is 443 kg/ha.<br />
The productivity <strong>of</strong> Wheat in India is 2891 kg/ha. In <strong>Gujarat</strong> state the productivity <strong>of</strong> this is 2400 kg/ ha. In Bharuch district this is<br />
2500kg/ha. In the project area Wheat is grown in only 10.25 ha area with the production <strong>of</strong> 1.78 tonne and the productivity <strong>of</strong> the area is 173.65<br />
kg/ha.<br />
Figure-5<br />
Comparative productivity <strong>of</strong> Tur and Cotton crop in project area, Bharuch district, state and India level<br />
West Forest Division- Rajpipla Page 41
Figure-6<br />
Comparative productivity <strong>of</strong> Wheat crop in project area, Bharuch district, state and India level<br />
Sankoi project has low productivity because <strong>of</strong> following reason:<br />
1 Traditional Farming Method:<br />
In Sankoi project farmers use traditional farming. They don’t use new technology and high yield varieties <strong>of</strong> crop. Farmers don’t use<br />
proper FYM, Vermi-compost in their farm. That leads to low yield in their farm.<br />
2 Soil erosion:<br />
Due to the Moderate Slope / Hilly land erosion <strong>of</strong> the soil is very high in the project area. So top layer <strong>of</strong> the soil/ fertile soil is degraded.<br />
West Forest Division- Rajpipla Page 42
3 Soil fertility very low:<br />
In Sankoi project fertility <strong>of</strong> the soil is very low. Soil is less nutritive in nitrogen and phosphorus.<br />
4 No irrigation facilities:<br />
Due to the Moderate Slope / Hilly soil, run <strong>of</strong>f is very <strong>of</strong>f. Water conservation structures are very less in Sankoi project. So irrigation<br />
facility is very low in the project area. Farmers use only rainfed farming in their field.<br />
5 Lack <strong>of</strong> finance for farmer<br />
In Sankoi project above 95% <strong>of</strong> the villagers are BPL. So they can’t purchase High yielding varieties seeds and machinery in their field.<br />
And they are unable in adopting new farming technology in the field.<br />
6 Lack <strong>of</strong> storage, marketing and transport facility:<br />
Farmers use their products for domestic purpose and remaining they sell in the nearest market and get less amount <strong>of</strong> money. They have<br />
no storage facility and transport facility so that they could sell their products in good market and get good return.<br />
West Forest Division- Rajpipla Page 43
CHAPTER-4<br />
WATERSHED ACTIVITY<br />
Watershed Activities<br />
Watershed management as a strategy has been adopted by Government <strong>of</strong> India especially in the rain-fed regions <strong>of</strong> semi-arid tropics.<br />
These regions are characterized by low and undependable rain, low soil fertility, poor infrastructure development, low literacy and high<br />
incidence <strong>of</strong> migration. Several studies have identified that there is a dire need <strong>of</strong> a systematic and scientific approach to deal with watershed<br />
development. The common guidelines generate a fresh and flexible framework for the next generation watershed development.<br />
4.1. Scientific Planning:<br />
i) Cluster Approach<br />
This envisages a broader vision <strong>of</strong> Geo-hydrological unit which involves treating a cluster <strong>of</strong> micro-watershed. The Sankoi project<br />
consists <strong>of</strong> 6 micro- watersheds. Further this watershed project is in continuation with other watershed projects namely Vasana, Rajwadi,<br />
Pingot, Jantran Projects this gives an element <strong>of</strong> continuation <strong>of</strong> the programme.<br />
ii)<br />
Base line Survey<br />
To access the impact <strong>of</strong> any watershed development programme a detailed baseline survey has conducted. This acts a benchmark for any<br />
intervention during and post implementation <strong>of</strong> any development programme. A detailed baseline survey was undertaken which involved<br />
household census survey, Bio-physical survey and Village level data collection from Talati –cum mantri. Household census survey includes a<br />
detailed questionnaire which was been filled by visiting each and every household in the village. This gave in the details <strong>of</strong> the demographic<br />
pr<strong>of</strong>ile <strong>of</strong> the village, the literacy percentage, SC/ST population, number <strong>of</strong> BPL household, cattle population, net consumption rate in the village,<br />
average milk production <strong>of</strong> the cattle and various schemes running and their benefits.<br />
West Forest Division- Rajpipla Page 44
Bio-physical survey was undertaken to identify various natural resources available in the village. It included the soil typology, well in the<br />
area, crop taken in the field, Cropping pattern, fertilizer used and various sources <strong>of</strong> irrigation in the field.<br />
iii)<br />
Participatory <strong>Rural</strong> Appraisal (PRA)<br />
The past experience <strong>of</strong> watershed has given tremendous input to focus on creating accountability <strong>of</strong> the stakeholders towards the<br />
programme. This has created an emphasis to include all the stakeholder communities and their local and indigenous Technological Knowledge<br />
(ITK) while planning for any activity. Participatory approach provides a new path for planning, implementing, and monitoring and postwithdrawal<br />
activities with a complete accountability <strong>of</strong> the stakeholders. Various PRA techniques like resource mapping, social mapping and<br />
season calendars were used to understand the physical and social orientation <strong>of</strong> the village in general and watershed in specific. These tools put<br />
the villagers in ease than the complicated questionnaires. Various tools like Matrix ranking, Venn diagram were used to identify various local<br />
vegetations (apt for afforestation), Fodders crops, various institutions and their significance in the life <strong>of</strong> the farmers. Daily routine activity<br />
helps the daily chart or life span <strong>of</strong> the villagers.<br />
iv)<br />
Use <strong>of</strong> GIS and Remote sensing for planning<br />
Use <strong>of</strong> various high science tools has been promoted at various stages <strong>of</strong> watershed development.<br />
a) Prioritization<br />
Geographical Information System (GIS) has been used for prioritization process. Various layer maps were created like Geomorphological,<br />
Soil, BPL Population, SC/ST population, Ground water Status, Drinking water situation Slope percent. These were all given<br />
proper weightage according to the DoLR specification. This helped in prioritization <strong>of</strong> various watershed areas.<br />
West Forest Division- Rajpipla Page 45
) Planning<br />
A action plan matrix was formulated by <strong>State</strong> Level Nodal Agency (SLNA) taking into account various features like the slope percent, soil<br />
Depth, Soil Texture, Soil erosion in the area for wasteland, forest land and agricultural land. Global positioning System (GPS) was used to<br />
identify each and every water conservation structures available in the project area. This was used to create a map. Contour Map <strong>of</strong> vertical<br />
interval <strong>of</strong> 1 meter at a scale <strong>of</strong> 1:8000 was used for identifying various locations for soil and water conservation structures.<br />
Table no. 30: Details <strong>of</strong> Scientific Planning and Inputs in <strong>IWMP</strong> projects<br />
Scientific criteria/ inputs used<br />
Whether scientific criteria was used<br />
(A) Planning<br />
Cluster approach<br />
yes<br />
Whether technical back-stopping for the project has been arranged? If yes, mention the name <strong>of</strong> the Institute<br />
yes<br />
Baseline survey<br />
yes<br />
Hydro-geological survey<br />
yes<br />
Contour mapping<br />
yes<br />
Participatory Net Planning (PNP)<br />
yes<br />
Remote sensing data-especially soil/ crop/ run-<strong>of</strong>f cover<br />
Ridge to Valley treatment<br />
yes<br />
Online IT connectivity between<br />
(1) Project and DRDA cell/ZP yes<br />
(2) DRDA and SLNA yes<br />
(3) SLNA and DoLR yes<br />
Availability <strong>of</strong> GIS layers<br />
1. Cadastral map yes<br />
2. Village boundaries yes<br />
3. Drainage yes<br />
4. Soil (Soil nutrient status) yes<br />
5. Land use yes<br />
6. Ground water status yes<br />
7. Watershed boundaries yes<br />
West Forest Division- Rajpipla Page 46
8. Activity yes<br />
Crop simulation models #<br />
No<br />
Integrated coupled analyzer/ near infrared visible spectroscopy/ medium spectroscopy for high speed soil<br />
nutrient analysis<br />
No<br />
Normalized difference vegetation index (NDVI)#<br />
No<br />
(B) Inputs<br />
1. Bio-pesticides yes<br />
2. Organic manures yes<br />
3. Vermicompost yes<br />
4. Bio-fertilizer yes<br />
5. Water saving devices yes<br />
6. Mechanized tools/ implements yes<br />
7. Bio-fencing yes<br />
8. Nutrient budgeting yes<br />
9. Automatic water level recorders & sediment samplers no<br />
Any other (please specify)<br />
4.2. Institution building<br />
i) Watershed Committee (WC)<br />
It is a committee that is constituted by Gram Sabha to implement the watershed project with technical support <strong>of</strong> WDT in the village. This<br />
committee is registered under society Registration Act 1860. The Gram Sabha <strong>of</strong> the village selects the chairman <strong>of</strong> the watershed committee<br />
with the secretary who will be a paid functionary. A watershed Committee was formed accordingly in each village <strong>of</strong> the Sankoi project.<br />
Capacity building training to the watershed committee is given by WDT as well as PIA. The watershed committee has a pivotal role to play<br />
during and after the project implementation period.Table no. 31: Watershed Committee details<br />
West Forest Division- Rajpipla Page 47
Sl.<br />
No<br />
.<br />
Name <strong>of</strong><br />
Village<br />
Names <strong>of</strong> WCs<br />
Date <strong>of</strong><br />
Registrati<br />
on as a<br />
Society<br />
(dd/mm/<br />
yyyy)<br />
M/<br />
F<br />
SC ST SF MF LF<br />
Designation<br />
Landless<br />
UG SHG GP<br />
1<br />
Vasava Savilalbhai Khalpabhai<br />
President M ST √<br />
2 Vasava Devabhai Lakadiya Member M ST √<br />
3 Vasava Rameshbhai Muljibhai Member M ST √<br />
4 Vasava Ramanbhai Rayajibhai Member M ST √<br />
5 Vasava Ramanbhai G. Member M ST √<br />
Under<br />
6 Kharetha Vasava Gulabbhai D. Member M ST<br />
Progress<br />
7 C. D. Chaudhari RFO M ST<br />
√<br />
8 Vasava Mangiben Sunilbhai Member F ST √<br />
9 Vasava Vanitaben S. Member F ST √<br />
10 Vasava Radhaben Bhimabhai Member F ST √<br />
11 Patel Nilamben Valjibhai WDT. Eng. F<br />
Any<br />
other<br />
1<br />
Vasava Kanubhai Mathurbhai<br />
President M ST √<br />
2 Vasava Pohana Buchiyabhai Member M ST √<br />
3 Vasava Somabhai Mathurbhai Member M ST √<br />
4 Vasava Chaganbhai Madviya Member M ST √<br />
5 Vasava Bachubhai Bavabhai Member M ST √<br />
Under<br />
6 Kund Vasava Govindbhai Namubhai Member M ST √<br />
Progress<br />
7 C. D. Chaudhari RFO M ST<br />
8 Vasava Champaben Ramesh Member F ST √<br />
9 Vasava Amaratben Kanubhai Member F ST √<br />
10 Vasava Jitaliben Chunilalbhai Member F ST √<br />
11 Patel Nilamben Valjibhai WDT. Eng. F<br />
West Forest Division- Rajpipla Page 48
1<br />
Vasava Narapatbhai<br />
Bhisubhai<br />
President M ST √<br />
2 Vasava Ramesh Dalsukhbhai Member M ST √<br />
3 Vasava Somabhai Bachubhai Member M ST √<br />
4 Vasava Gurajibhai Zinabhai Member M ST √<br />
5 Vasava Madhusing Rupsing<br />
Under<br />
Member M ST √<br />
Vandarveli<br />
6 Vasava Manorbhai Jelamsang Progress Member M ST √<br />
7 C. D. Chaudhari RFO M ST<br />
8 Vasava Ganpatbhai Sakiya Member M ST √<br />
9 Vasava Gitaben Ishwarbhai Member F ST √<br />
10 Vasava Vanitaben Somabhai Member F ST √<br />
11 Patel Nilamben Valjibhai WDT. Eng. F<br />
1<br />
Vasava Harshad Bhupatsing<br />
President M ST √<br />
2 Vasava Madhavsing N. Member M ST √<br />
3 Vasava Manubhai Maljibhai Member M ST √<br />
4 Vasava Babubhai Saradha Member M ST √<br />
5 Vasava Gitaben Madhavbhai Member F ST √<br />
Under<br />
6 Valpor Vasava Sarasvatiben Rajesh Progress Member F ST √<br />
7 C. D. Chaudhari RFO M ST<br />
8 Vasava Kapilaben Sursing Member F ST √<br />
9 Vasava Rushatbhai Puniya Member M ST √<br />
10 Vasava Chiman Tuliyabhai Member M ST √<br />
11 Patel Nilamben Valjibhai WDT. Eng. F<br />
West Forest Division- Rajpipla Page 49
1<br />
Vasava Vandanbhai Arunbhai<br />
President M ST √<br />
2 Vasava Ramilaben Raghubhai Member F ST √<br />
3 Vasava Jivantiben Ranjibhai Member F ST √<br />
4 Vasava Shaileshbhai Druvsing Member M ST √<br />
5 Vasava Bhudhdhilal Sursing Member M ST √<br />
6 Vasava Nayanaben Somabhai Under Member F ST √<br />
Galiba<br />
7 C. D. Chaudhari Progress RFO M ST<br />
8 Vasava Pushapaben D. Member F ST √<br />
9 Vasava Somabhai Zaverbhai Member M ST √<br />
10 Vasava BhupendraFatesing Member M ST √<br />
11 Vasava Vinubhai Sureshbhai Member M ST √<br />
13 Patel Nilamben Valjibhai WDT. Eng. F<br />
1<br />
Vasava Mohanbhai Parsing<br />
President M ST √<br />
2 Vasava Rupajibhai Tetiyabhai Member M ST √<br />
3 Vasava Sukavantiben Natavar Member F ST √<br />
4 Vasava Ravitaben Chhatrasing Member F ST √<br />
5 Vasava Gamiyabhai Hirabhai Member M ST √<br />
6 Vasava Khansing Somabhai Under Member M ST √<br />
Fichavada<br />
7 C. D. Chaudhari Progress RFO M ST<br />
8 Vasava Harising Rayajibhai Member M ST √<br />
9 Vasava Bhigajibhai Devajibhai Member M ST √<br />
10 Vasava Somabhai Karamsing Member M ST √<br />
11 Vasava Bhartiben Gopalbhai Member F ST √<br />
13 Patel Nilamben Valjibhai WDT. Eng. F<br />
West Forest Division- Rajpipla Page 50
1<br />
Vasava Ishwarbhai Kalidas<br />
President M ST √<br />
2 Vasava MansangOliyabhai Member M ST √<br />
3 Vasava Rajeshbhai Ramdas Member M ST √<br />
4 Vasava Dilipbhai Hirabhai Member M ST √<br />
5 Vasava Govindbhai Biniyabhai Member M ST √<br />
6 Vasava Amarsing Navalbhai Under Member M ST √<br />
Rupghat<br />
7 C. D. Chaudhari Progress RFO M ST<br />
8 Vasava Sukamaben Ramesh Member F ST √<br />
9 Vasava Lalitaben Devsang Member F ST √<br />
10 Vasava Vanitaben Mohanbhai Member F ST √<br />
11 Vasava Manjulaben Subhash Member F ST √<br />
13 Patel Nilamben Valjibhai WDT. Eng. F<br />
1<br />
Vasava Sukhadevbhai Venilal<br />
President M ST √<br />
2 Vasava Nandlalbhai Bhulabhai Member M ST √<br />
3 Vasava Chandrasing Ratilal Member M ST √<br />
4 Vasava Narendra Dineshbhai Member M ST √<br />
5 Vasava Chhaganbhai Namala Member M ST √<br />
Under<br />
6 Sankoi Vasava Minaben Ganpatbhai<br />
Progress<br />
Member F ST √<br />
7 C. D. Chaudhari RFO M ST<br />
8 Vasava Jyostnaben Vijaybhai Member F ST √<br />
9 Vasava Ramilaben Raghubhai Member F ST √<br />
10 Vasava Bahadurbhai Lallubhai Member M ST √<br />
11 Patel Nilamben Valjibhai WDT. Eng. F<br />
West Forest Division- Rajpipla Page 51
1<br />
Vasava Pratapbhai Raniyabhai<br />
President M ST √<br />
2 Vasava Dungarji Ramjibhai Member M ST √<br />
3 Vasava Narsing Kotaniyabhai Member M ST √<br />
4 Vasava Fatesing Vadagiyabhai Member M ST √<br />
5 Vasava Prabhatbhai Gavaliya Member M ST √<br />
Under<br />
6 Varkhadi Vasava Jamalsing Navalbhai Member M ST<br />
Progress<br />
7 C. D. Chaudhari RFO M ST<br />
√<br />
8 Vasava Savitaben Kelvinbhai Member F ST √<br />
9 Vasava Deviben Gambhirbhai Member F ST √<br />
10 Vasava Ukadiben devajibhai Member F ST √<br />
11 Patel Nilamben Valjibhai WDT. Eng. F<br />
ii ) Self Help Group<br />
Self Help Groups are motivated, small homogenous groups organized together through credit and thrift activities. Self help group<br />
initiative especially for women help uplift their livelihood. Generally self help groups include landless and poor women.<br />
Before formation <strong>of</strong> the SHGs, during PRA activities, Focussed Group Discussions (FGDs) were held with the women, which came up with<br />
the following observations:<br />
a) Lack <strong>of</strong> proper credit facilities due to low intervention <strong>of</strong> formal financial credit institution.<br />
b) Excessive exploitation <strong>of</strong> weaker section by money lenders<br />
c) Lack <strong>of</strong> attitude for saving among poor people<br />
d) Lack <strong>of</strong> knowledge on credit and thrift activity and banking.<br />
With a detailed discussion with some <strong>of</strong> the local NGOs working in the area like AKRSP, it was planned to have some capacity building<br />
training regarding SHG activities. It was also proposed to have some livelihood activities which will promote women empowerment.<br />
West Forest Division- Rajpipla Page 52
Table no. 32: SHG detail<br />
Sr.<br />
No.<br />
Name <strong>of</strong> the<br />
village<br />
With only<br />
Men<br />
Total no. <strong>of</strong> registered SHGs<br />
With only<br />
Women<br />
With<br />
both<br />
1 Kharatha 1 5 - 6<br />
2 Kund 1 2 - 3<br />
3 Vanderveli 3 - 3<br />
4 Valpor 0 5 - 5<br />
5 Galiba 1 8 - 9<br />
No. <strong>of</strong> members<br />
No. <strong>of</strong> ST in each<br />
category<br />
No. <strong>of</strong> BPL in<br />
each category<br />
Total Categories M F Total M F Total M F Total<br />
Landless 9 48 57 9 48 57 9 7 16<br />
SF 3 15 18 3 15 18<br />
MF<br />
LF<br />
Total 12 63 75 12 63 75 9 7 16<br />
Landless 11 21 32 11 21 32 11 21 32<br />
SF 0 0 0 0<br />
MF<br />
LF<br />
Total 11 21 32 11 21 32 11 21 32<br />
Landless 24 24 0 24 24 16 16<br />
SF 7 7 0 7 7<br />
MF<br />
LF<br />
Total 0 31 31 0 31 31 0 16 16<br />
Landless 32 32 0 32 32 24 24<br />
SF 21 21 0 21 21<br />
MF<br />
LF<br />
Total 0 53 53 0 53 53 0 24 24<br />
Landless 5 23 28 5 23 28 5 23 28<br />
SF 6 62 68 6 62 68<br />
MF<br />
LF<br />
Total 11 85 96 11 85 96 5 23 28<br />
West Forest Division- Rajpipla Page 53
6 Fichwada 1 6 - 7<br />
7 Rupghat 2 3 - 5<br />
8 Sankoi 5 16 - 21<br />
9 Varkhadi 1 2 0 3<br />
Landless 7 17 24 7 17 24 11 16 27<br />
SF 4 32 36 4 32 36<br />
MF<br />
LF<br />
Total 11 49 60 11 49 60 11 16 27<br />
Landless 12 5 17 12 5 17 11 25 36<br />
SF 10 28 38 10 28 38<br />
MF<br />
LF<br />
Total 22 33 55 22 33 55 11 25 36<br />
Landless 55 171 226 55 171 226 55 102 157<br />
SF 0 0 0 0<br />
MF<br />
LF<br />
Total 55 171 226 55 171 226 55 102 157<br />
Landless 11 22 33 11 22 33 11 17 28<br />
SF 0 0 0 0<br />
MF<br />
LF<br />
Total 11 22 33 11 22 33 11 17 28<br />
West Forest Division- Rajpipla Page 54
Figure 7 Focused Group Discussions with Villagers.<br />
West Forest Division- Rajpipla Page 55
4.2.3 User Group:<br />
User Groups are normally formed to manage an activity or asset created under the programme on a long term basis. The user group collect<br />
user charges from their members, oversee the works and manage the benefits.<br />
It was decided that each group would formulate certain internal rules and have a feeling <strong>of</strong> ownership with community spirit.<br />
Table no. 33: UG details<br />
Sr. Name <strong>of</strong> the<br />
Total no. <strong>of</strong> UGs<br />
No. <strong>of</strong> members<br />
No. <strong>of</strong> ST in each<br />
category<br />
No. <strong>of</strong> BPL in each<br />
category<br />
No. village Men Women Both Total Categories M F Total M F Total M F Total<br />
(i)Landless<br />
1 Kharetha 6 6<br />
(iv) LF<br />
(ii) SF 37 37 37 0 37 4 4<br />
(iii) MF 5 5 5 5<br />
Total 42 0 42 42 0 42 4 0 4<br />
2 Kund 2 2<br />
(i)Landless<br />
(iv) LF<br />
(ii) SF 14 14 14 0 14 14 14<br />
(iii) MF 0 0 0 0<br />
Total 14 0 14 14 0 14 14 0 14<br />
3 Vanderveli 3 1 4<br />
(i)Landless<br />
(iv) LF<br />
(ii) SF 28 1 29 28 1 29 3 3<br />
(iii) MF 3 3 3 3<br />
Total 31 1 32 31 1 32 3 0 3<br />
4 Valpor 1 1 2<br />
(i)Landless<br />
(iv) LF<br />
(ii) SF 12 2 14 12 2 14 2 2<br />
(iii) MF 0 0 0<br />
Total 12 2 14 12 2 14 2 0 2<br />
West Forest Division- Rajpipla Page 56
5 Galiba 10 1 11<br />
(i)Landless<br />
(iv) LF<br />
(ii) SF 73 1 74 73 1 74 7 7<br />
(iii) MF 3 3 3 3<br />
Total 76 1 77 76 1 77 7 0 7<br />
6 Fichwada 3 1 4<br />
(i)Landless<br />
(iv) LF<br />
(ii) SF 27 1 28 27 1 28 1 1<br />
(iii) MF 0 0<br />
Total 27 1 28 27 1 28 1 0 1<br />
7 Rupghat 2 0 2<br />
(i)Landless<br />
(iv) LF<br />
(ii) SF 13 0 13 13 0 13 2 2<br />
(iii) MF 3 3 3 3<br />
Total 16 0 16 16 0 16 2 0 2<br />
8 Sankoi 2 0 2<br />
(i)Landless<br />
(iv) LF<br />
(ii) SF 16 0 16 16 0 16 5 5<br />
(iii) MF 0 0<br />
Total 16 0 16 16 0 16 5 0 5<br />
9 Varkhadi 2 0 2<br />
(i)Landless<br />
(iv) LF<br />
(ii) SF 13 1 14 13 1 14 2 2<br />
(iii) MF 0 0<br />
Total 13 1 14 13 1 14 2 0 2<br />
West Forest Division- Rajpipla Page 57
4.3. Physical activities to be undertaken under <strong>IWMP</strong>, Sankoi<br />
4.3.1 Entry Point activity (EPA)<br />
EPA activities are taken up under watershed projects to build a rapport with the village community at the beginning <strong>of</strong> the project;<br />
generally, certain important works which are in urgent demand <strong>of</strong> the local community are taken up. A group Discussion was conducted with<br />
village people in Gram Sabha regarding the EPA activity. The villagers discussed various activities which they felt is important, which revive the<br />
common natural resources. EPA was selected on the basis <strong>of</strong> Drinking water problem, Repairing <strong>of</strong> structures for irrigation water facilities and<br />
for animal drinking problem. It was also taken into priority that there should be an instrument <strong>of</strong> convergence which will result in sustainability<br />
<strong>of</strong> activities. Different types <strong>of</strong> activities like check dam repairing, bore well, hawada, filter plant and sintax tank for drinking water in school,<br />
well repairing, pipelines, new ponds have been taken up in EPA.<br />
Table no.34: Entry point activities (EPA) (All financial figures in lakh Rs.)<br />
Sl.<br />
No.<br />
Names <strong>of</strong><br />
Villages<br />
Amount<br />
earmarked<br />
for EPA (lakh)<br />
Entry Point Activities planned<br />
Estimated<br />
cost (lakh)<br />
Conv.<br />
(lakh)<br />
Depart. <strong>of</strong><br />
conv.<br />
1 Kharetha 2.91 Check dam Repairing, Bore well and Hawada 3.81 0.90 WASMO<br />
2 Kund 0.73 Hawada, Filter plant and Sintex tank 1.23 0.50 WASMO<br />
3 Vandarveli 2.11 Well Repairing, Hawada 2.11<br />
4 Valpor 1.50 Pipeline, Filter plant and Sintex tank 2.00 0.50 WASMO<br />
5 Galiba 4.84 Pond deepning ,outlet, Bore well and Hawada repairing 5.69 0.85 WASMO<br />
6 Fichvada 2.36 New Pond, Filter plant and Sintex tank 2.86 0.50 WASMO<br />
7 Rupghat 2.22 Check dam Repairing, Filter plant and Sintex tank 2.72 0.50 WASMO<br />
8 Shankoi 5.27 Protection wall-4 No. on main Road nala 5.27<br />
9 Varkhadi 1.92 Pipeline, Motor, borewell, , Filter plant and Sintex tank 3.25 0.50, 0.83 WASMO, TASP<br />
Total 23.86 28.94 5.08<br />
West Forest Division- Rajpipla Page 58
West Forest Division- Rajpipla Page 59
Figure 8, Activity <strong>of</strong> Specified by Villager for Entry Point (EPA)<br />
34.2Estimation <strong>of</strong> Drinking water pipe line at village Valpor Entry point Activity<br />
No Particulars No L B H Qty Rate Per Amount<br />
1 Excavation 1 1 0.45 0.60 0.27 69.60 18.79<br />
2 Pipe line 6 kg/Sq.cm 1 1 1.00 275.00 275.00<br />
3 Sand filling in bed 1 1 0.45 0.10 0.05 500.00 22.50<br />
316.29<br />
4 10 % <strong>of</strong> cost for bend ,at,Valve etc. 31.63<br />
Total cost per m. 347.92<br />
Total cost :- 300 347.92 104376.00<br />
SAY :- 104300.00<br />
Estimation <strong>of</strong> Hawada at village Kund<br />
NO DESCRIPTION NO L B D/H QTY T.QTY Rate per Amount<br />
1 Excavation for foundation<br />
* Foundation 1 8.30 5.00 0.25 10.38 10.38 69.6 Cu.m 722.10<br />
2 Cement concrete in 1:4:8<br />
1 8.30 5.00 0.25 10.38 10.38 2270.9 Cu.m 23560.59<br />
3 Cement concrete in 1:2:4<br />
* Bottom Layer 1 8.30 5.00 0.15 6.23<br />
* Long Vertical wall O/o 2 5.30 0.15 0.75 1.19<br />
* Short vertical wall I/I 2 1.20 0.15 0.75 0.27 7.69 3214.50 Cu.m 24711.47<br />
4 Providing cement plaster in 20mm tk<br />
* Bottom 1 8.30 5.00 41.50<br />
West Forest Division- Rajpipla Page 60
* Long vertical wall O/o 2 5.30 0.75 7.95<br />
* Short vertical wall O/o 2 1.50 0.75 2.25<br />
* Long vertical wall I/I 2 5.00 0.75 7.50<br />
* Short vertical wall I/I 2 1.20 0.75 1.80<br />
5 Mild Steel bars<br />
* Long wall top 2 5.30 0.15 1.59<br />
* Short wall top 2 1.20 0.15 0.36 62.95 113.3 Sq.m 7132.24<br />
( S.O.R.P.No. 62 Sr.No. 5 )<br />
* Bottom base steel ( both side )<br />
* 8 mm dia. 0.15m c/c<br />
Nos=8.30/0.15+1=56.33 say 56 nos 56 X 5.00 X 0.395 110.60<br />
* 8 mm dia. 0.15m c/c<br />
Nos=5.00/0.15+1=34.33 say 34 nos 34 X 8.30 X 0.395 111.47<br />
* Vertical Bars<br />
* long wall- 8mm dia. Bars o.15 m c/c<br />
Nos=5.15/0.15+1=35.33 say 35 nos 2 X 35 X 0.75 X 0.62 32.55<br />
* Short wall<br />
Nos=1.35/0.15+1=10 nos 2 X 10 X 0.75 X 0.62 9.30<br />
* Distribution bars<br />
* L=5.15+5.15+1.35+1.35=13.00m<br />
Nos=0.75/0.15+1=6 nos.<br />
6 Name Plate 1 Nos.<br />
2 X 6.00 X 13.00 X 0.75 X<br />
0.395 46.22 310.13 43 Kg 13335.76<br />
1 nos 1 nos 1200 Nos 1200.00<br />
TOTAL AMOUNT :- 70662.15<br />
West Forest Division- Rajpipla Page 61
4.3.2. Watershed <strong>Development</strong> Works:<br />
Watershed development works are to be done during second phase <strong>of</strong> watershed project. A multi-tier ridge to valley sequence approach<br />
should be approached towards implementation <strong>of</strong> watershed development projects. A net budget <strong>of</strong> 50 percent is allotted for this work.<br />
Ridge Area Treatment Plans:<br />
It is very important to treat the ridge as this is where the major water resources originate. This involves mainly hilly and forest region in<br />
Sankoi watershed. For the ridge area treatment <strong>of</strong> Sankoi watershed following structure are been Proposed after interaction among Gram sabha,<br />
watershed committee, Range Forest Officer (RFO), Project Manager and other field staff <strong>of</strong> project.<br />
1. Check dam<br />
2. Contour trench<br />
3. Gully plug<br />
4. Stone bunding<br />
5. Farm bunding<br />
1. Check dams<br />
Check Dam is a structure constructed using cement and concrete across the river <strong>of</strong> comparatively wider water channel. This structure is<br />
preferred where the height <strong>of</strong> both the banks <strong>of</strong> river is considerably high and the width <strong>of</strong> river channel or stream is less.<br />
Advantages <strong>of</strong> check dams<br />
The advantages <strong>of</strong> check dams are that they store surface water for use both during and after the monsoon. They help in ground water<br />
recharge <strong>of</strong> the area. Recharge <strong>of</strong> water helps in raising the water table in the area. Avaiability <strong>of</strong> water ensures the increase <strong>of</strong> agricultural yield<br />
by multi-cropping.<br />
West Forest Division- Rajpipla Page 62
2. Contour trench<br />
These trenches act as trap for the water and minimise soil erosion. The trenches do not need to be very large to be effective.<br />
3. Gully plug<br />
A small gully bund like this one Prevents a new Gully being formed in the middle <strong>of</strong> the farm, thus preventing erosion from the<br />
beginning itself. Such bunds would make two parts <strong>of</strong> one field, thus making it difficult to plough, but some farmers are ready to do it.<br />
4. Stone bunding:<br />
After filling the Staggered Trenches, the excess water flows out in the form <strong>of</strong> little streams. To stop these streams, the obstruction walls<br />
<strong>of</strong> the length equal to the width <strong>of</strong> the streams are made with the help <strong>of</strong> stones. Such walls are created at an interval <strong>of</strong> 200 to 300 meters along<br />
the channels <strong>of</strong> the streams. These walls are known as Stone bunding.<br />
5. Percolation tank<br />
Percolation Tank is the arrangement in which the retaining walls <strong>of</strong> clay are made and a dam (waste weir) is constructed using cement<br />
concrete. This tank is preferred at the site where two to three rain water streams meet. The outlet is also planned so that excess water overflows<br />
out <strong>of</strong> it. The Storage Tank is a good basin for water storage.<br />
West Forest Division- Rajpipla Page 63
Table no.35: Details <strong>of</strong> activities <strong>of</strong> preparatory phase (All financial figures in lakh Rs.)<br />
Sr. No.<br />
Name <strong>of</strong><br />
villages<br />
Initiation <strong>of</strong><br />
village level<br />
institution<br />
(lakh)<br />
Capacity<br />
building<br />
(lakh)<br />
IEC<br />
activities<br />
(lakh)<br />
Baseline<br />
survey<br />
(lakh)<br />
Hydrogeological<br />
survey<br />
(lakh)<br />
Any other<br />
(please<br />
specify)<br />
(lakh)<br />
Estimated Cost<br />
(Rs. in lakh)<br />
1 Kharetha 0.73 2.23 1.02 0.22 0.07 0.092 4.36<br />
2 Kund 0.18 0.56 0.26 0.06 0.02 0.023 1.10<br />
3 Vandarveli 0.53 1.62 0.74 0.16 0.05 0.067 3.17<br />
4 Valpor 0.38 1.15 0.53 0.11 0.04 0.047 2.26<br />
5 Galiba 1.21 3.72 1.70 0.36 0.12 0.152 7.26<br />
6 Fichvada 0.59 1.81 0.83 0.18 0.06 0.074 3.54<br />
7 Rupghat 0.56 1.70 0.78 0.17 0.06 0.070 3.34<br />
8 Sankoi 1.32 4.04 1.85 0.40 0.13 0.166 7.91<br />
9 Varkhadi 0.48 1.48 0.67 0.14 0.05 0.060 2.88<br />
Table no.36: Activities related to Surface water resources in the project areas (all financial figures in lakh Rs.)<br />
Village<br />
name<br />
Kharetha<br />
Kund<br />
Proposed target<br />
Augmentation/ repair <strong>of</strong> existing<br />
structures Construction <strong>of</strong> new structures Total target<br />
Area to<br />
Area to<br />
Area to<br />
Est.<br />
be Storage Estimated<br />
be<br />
be<br />
Cost<br />
irrigated capacity cost<br />
irrigated Storage<br />
irrigated Storage<br />
No. (ha) (lit.) (lakh)<br />
(lakh)<br />
No. (ha) capacity<br />
(ha) cap.(lit)<br />
Type <strong>of</strong> structures<br />
Pond 1 7.65 11250 1.8 8 11250 1.8<br />
Check dam 2 12 22000 4 6 35.29 66667 12.0 47 88889 16<br />
Percolation tank 2 2.50 5000 1.0 3 5000 1<br />
TOTAL 2 12 22000 4 8 37.79 71667 13 50 93889 18.8<br />
Pond 1 6.38 9375 1.5 6 9375 1.5<br />
Check dam 1 4.41 8333 1.5 4 8333 1.5<br />
Percolation tank 2 2.50 5000 1.0 3 5000 1<br />
TOTAL 0 0 0 0 4 13.29 22708 4 13.29 22708 4<br />
Est.<br />
Cost<br />
(lakh)<br />
West Forest Division- Rajpipla Page 64
Vanderveli Pond 1 8.50 12500 2 9 12500 2<br />
Check dam 1 9 16667 3 5 33.82 63889 11.5 43 80556 14.5<br />
Percolation tank 3 3.75 7500 1.5 3.75 7500 1.5<br />
TOTAL 1 9 16667 3 9 46.07 83889 15 54.90 100556 18<br />
Valpor Pond 1 6.38 9375 1.5 6 9375 1.5<br />
Check dam 4 26.21 49500 8.91 26 49500 8.91<br />
Percolation tank<br />
TOTAL 0 0 0 0 5 32.58 58875 10.41 33 58875 10.41<br />
Galiba Pond 1 8.50 12500 2 9 12500 2<br />
Check dam 1 4 8333 1.5 15 104.12 196667 35.4 109 205000 36.9<br />
Percolation tank<br />
TOTAL 1 4 8333 1.5 16 112.62 209167 37.4 117 217500 38.9<br />
Fichwada Pond<br />
Check dam 7 61.76 116667 21 62 116667 21<br />
Percolation tank<br />
TOTAL 0 0 0 0 7 61.76 116667 21 62 116667 21<br />
Rupghat Pond 1 8.50 12500 2.0 9 12500 2.0<br />
Check dam 6 20.59 38889 7.0 21 38889 7.0<br />
Percolation tank 2 2.50 5000 1.0 3 5000 1.0<br />
TOTAL 0 0 0 0 9 31.59 56389 10 32 56389 10<br />
Sankoi Pond 1 6.38 9375 1.5 6 9375 1.5<br />
Check dam 2 13 24333 4.38 10 87.71 165667 29.82 101 190000 34.2<br />
Percolation tank<br />
TOTAL 2 13 24333 4.38 11 94.08 175042 31.32 107 199375 35.7<br />
Varkhadi Pond 0 0 0<br />
Check dam 3 20.59 38889 7 21 38889 7<br />
Percolation tank<br />
TOTAL 0 0 0 0 3 20.59 38889 7 21 38889 7<br />
West Forest Division- Rajpipla Page 65
Table no.37: Activities related to recharging ground water resources in the project areas (all financial figures in lakh Rs.)<br />
S. No.<br />
Name <strong>of</strong><br />
Villages<br />
Type <strong>of</strong> structures<br />
Construction <strong>of</strong> new recharging structures<br />
No.<br />
Area to be<br />
irrigated (ha)<br />
Estimated cost<br />
(lakh)<br />
Area to be<br />
irrigated (ha)<br />
Total target<br />
Estimated cost (lakh)<br />
1 Kharetha Open wells 3 12 4.50 12 4.50<br />
2 Kund Open wells 2 10 3.00 10 3.00<br />
3 Vandrveli Open wells 2 10 3.00 10 3.00<br />
4 Valpor Open wells 1 4 1.50 4 1.50<br />
5 Galiba Open wells 1 3 1.50 3 1.50<br />
6 Fichvada Open wells 1 4 1.50 4 1.50<br />
7 Rupghat Open wells 0 0 0.00 0 0.00<br />
8 Sankoi Open wells 5 19 7.50 19 7.50<br />
9 Varkhadi Open wells 2 7 3.00 7 3.00<br />
Total for the Project 17 69 25.5 69 25.5<br />
Table no. 38: Activities related to livelihoods by Self Help Groups (SHGs) in the project areas<br />
Sr. No.<br />
Names <strong>of</strong> Villages<br />
1 Sankoi-1<br />
Name <strong>of</strong> activity<br />
Major activities <strong>of</strong> the SHGs<br />
No. <strong>of</strong> SHGs<br />
involved<br />
Average annual income from<br />
activity per SHG (Rs.)<br />
Nursery 40 35000<br />
Vermi Net House 36 30000<br />
Animal Husbandry 7 46500<br />
Floor mill 7 36000<br />
Poultry unit 12 78000<br />
mini oil mill 23 15000<br />
Fisheries 10 75000<br />
Utensil service 7 59500<br />
Gaucher Dev.& fruit tree plantation 9 70000<br />
West Forest Division- Rajpipla Page 66
Table no. 39: Other activities <strong>of</strong> watershed works phase – Proposed target (cost in lakh)<br />
S.<br />
No.<br />
Name <strong>of</strong><br />
villages<br />
Ridge area<br />
treatment<br />
Drainage line<br />
treatment<br />
Nursery<br />
raising<br />
Land<br />
development<br />
Crop<br />
demonstrations<br />
Pasture<br />
development<br />
Fishery<br />
development<br />
Rmt cost NO cost Ha cost Ha cost Ha cost Ha cost Unit cost<br />
Total<br />
Estimated<br />
cost (Rs. In<br />
lakhs)<br />
1 Khaetha 2661 1.0 42 27.2 68.41 0.76 26 24.65 1.85 0.24 2 0.26 - 0 54.1<br />
2 Kund 2661 1.0 11 4 32.4 0.36 6 12.58 1.15 0.15 2 0.26 - 0 18.4<br />
3 Vanderveli 2661 1.0 15 17.88 43 0.48 21 21.23 4.00 0.52 2 0.26 - 0 41.4<br />
4 Valpor 1330 0.5 21 19.51 54 0.6 29 15.33 1.92 0.25 1 0.13 - 0 36.3<br />
5 Galiba 2661 1.0 61 51.15 68 0.75 35 21.68 4.00 0.52 8 1.04 3 1.5 77.6<br />
6 fichwada 2661 1.0 24 28.1 49.5 0.55 23 18.06 2.00 0.26 4 0.52 3 1.5 50.0<br />
7 Rupghat 2661 1.0 59 23.71 22.5 0.25 67 22.86 2.00 0.26 4 0.52 2 1 49.6<br />
8 Sankoi 6652 2.5 50 45.4 100.81 1.12 65 37.12 7.69 1.00 8 1.04 - 0 88.2<br />
9 Varkhadi 1330 0.5 29 14.54 36 0.4 27 18.57 7.69 1.00 4 0.52 2 1 36.5<br />
total 25278.0 9.5 312.0 231.5 474.6 5.3 299.0 192.1 32.3 4.2 35.0 4.6 10.0 5.0 452.1<br />
West Forest Division- Rajpipla Page 67
Table no.40: Details <strong>of</strong> engineering structures in watershed works*<br />
S.<br />
No.<br />
Village<br />
name<br />
1 Kharetha<br />
2 Kund<br />
Name <strong>of</strong> structures<br />
Type <strong>of</strong> treatment<br />
Ridg<br />
e<br />
area<br />
(R)<br />
Drai<br />
nage<br />
line<br />
(D)<br />
Land<br />
dev.<br />
(L)<br />
Priva<br />
te<br />
Type <strong>of</strong> land<br />
Comm<br />
unity<br />
Others<br />
(pl.<br />
specify)<br />
Executing<br />
agency<br />
UG,SHG,<br />
No. <strong>of</strong><br />
units<br />
(No./<br />
cu.m./<br />
rmt)<br />
Target<br />
Estimated cost<br />
(Rs. in lakh)<br />
Others (pl.<br />
specify)<br />
M W O T<br />
Gully Plug L P WC 19 2.77 2011<br />
Farm bunding L P WC 2495 1.25 2012<br />
Contour trench R C UG 2661 1 2011<br />
Stone bund L P WC 1112 4.81 2012<br />
Nala Plug D C F WC 34 11.2 2013<br />
New Pond L C UG 1 1.8 2013<br />
Percolation Tank L P WC 2 1 2014<br />
New well L P WC 3 4.5 2013<br />
Outlet L C UG 1 2 2012<br />
Check dam D C F UG 6 12 2014<br />
Check dam Desilting D C UG 2 4 2014<br />
Total<br />
46.34<br />
Gully Plug L P WC 8 0.91 2011<br />
Contour trench R C UG 2661 1 2011<br />
Stone bund L P WC 901 3.89 2012<br />
Nala Plug D C F WC 10 2.5 2013<br />
New Pond L C UG 1 1.5 2013<br />
Percolation Tank L P WC 2 1 2014<br />
New well L P WC 2 3 2013<br />
Outlet L C UG 1 2.00 2014<br />
Check dam D C UG 1 1.5 2014<br />
Total<br />
16.05<br />
Expected<br />
month &<br />
year <strong>of</strong><br />
completion<br />
(mm/yyyy)<br />
West Forest Division- Rajpipla Page 68
3 Vanderveli<br />
4 Valpor<br />
5 Galiba<br />
Gully Plug L P WC 14 1.30 2011<br />
Farm bunding L P WC 7304 3.66 2012<br />
Contour trench R C UG 2661 1.00 2011<br />
Stone bund L P WC 598 2.59 2012<br />
Nala Plug D C F WC 9 3.38 2013<br />
New Pond L P UG 1 2.00 2013<br />
Percolation Tank L P WC 3 1.50 2014<br />
New well L P WC 2 3.00 2013<br />
Outlet L C UG 1 2.50 2012<br />
Check dam D C UG 5 11.50 2014<br />
Check dam Repairing D C UG 1 3.00 2014<br />
Total 35.43<br />
Gully Plug L P WC 26 3.86 2011<br />
Farm bunding L P WC 2295 1.15 2012<br />
Contour trench R C UG 1330 0.50 2011<br />
Stone bund L P WC 109 0.47 2012<br />
Nala Plug D C F WC 17 10.60 2013<br />
New Pond L C UG 1 1.50 2013<br />
New well L P WC 1 1.50 2013<br />
Outlet L C UG 1 2.00 2012<br />
Check dam D C F UG 4 8.91 2014<br />
Total<br />
30.49<br />
Gully Plug L P WC 32 4.72 2011<br />
Farm bunding L P WC 3325 1.67 2012<br />
Contour trench R C UG 2661 1.00 2011<br />
Stone bund L P WC 561 2.43 2012<br />
Nala Plug D C F WC 45 14.25 2013<br />
New Pond L C UG 1 2.00 2013<br />
New well L P WC 1 1.50 2013<br />
Outlet L C UG 1 3.00 2012<br />
Check dam D C F UG 15 35.40 2014<br />
Check dam Repairing D C UG 1 1.50 2014<br />
Total<br />
67.46<br />
West Forest Division- Rajpipla Page 69
6 Fichwada<br />
7 Rupghat<br />
8 Sankoi<br />
Gully Plug L P WC 20 3.08 2011<br />
Farm bunding L P WC 1996 1.00 2012<br />
Contour trench R C UG 2661 1.00 2011<br />
Stone bund L P WC 651 2.82 2012<br />
Nala Plug D C F WC 17 7.10 2013<br />
New Pond L C UG 1 2.00 2013<br />
New well L P WC 1 1.50 2013<br />
Outlet L C UG 1 2.50 2012<br />
Check dam D C F UG 7 21.00 2014<br />
Check dam Desilting UG 2014<br />
Total 42.00<br />
Gully Plug L P WC 63 7.40 2011<br />
Farm bunding L P WC 5198 2.60 2012<br />
Contour trench R C UG 2661 1.00 2011<br />
Stone bund L P WC 435 1.88 2012<br />
Nala Plug D C F WC 56 16.71 2013<br />
New Pond L C UG 1 2.00 2013<br />
Percolation Tank L P WC 2 1.00 2014<br />
Outlet L C WC 1 2.50 2014<br />
Check dam D C F UG 3 7.00 2014<br />
Total 42.10<br />
Gully Plug L P WC 58 5.61 2011<br />
Farm bunding L P WC 3791 1.90 2012<br />
Contour trench R C UG 6652 2.50 2011<br />
Stone bund L P WC 2318 10.02 2012<br />
Nala Plug D C F WC 38 11.20 2013<br />
New Pond L C UG 1 1.50 2013<br />
New well L P WC 5 7.50 2013<br />
Outlet L C UG 1 2.50 2012<br />
Check dam D C F UG 10 29.82 2014<br />
Check dam Repairing D C UG 2 4.38 2014<br />
Total 76.93<br />
West Forest Division- Rajpipla Page 70
9 Varkhadi<br />
Gully Plug L P WC 24 3.07 2011<br />
Farm bunding L P WC 5770 2.89 2012<br />
Contour trench R C UG 1330 0.50 2011<br />
Stone bund L P WC 569 2.46 2012<br />
Nala Plug D C F WC 26 7.54 2013<br />
New Pond UG 2013<br />
Percolation Tank WC 2014<br />
New well L P WC 2 3.00 2013<br />
Outlet L C UG 1 2.50 2012<br />
Check dam D C F UG 3 7.00 2014<br />
Check dam Desilting UG 2014<br />
Total 28.96<br />
Table no. 40.1 Technical structure <strong>of</strong> Gully plug<br />
Table no. 40.1.1 Estimation <strong>of</strong> Gully Plug<br />
SR.NO DESCRIPTION No L B H Qty Rate Amount<br />
1 Excavation 1 1.00 2.00 0.30 0.60 69.60 41.76<br />
2 Below G.L Stone 1 1.00 2.00 0.30 0.60 523.30 523.30<br />
3 Above G.l 1 1.00 2.00+1.25/2<br />
4 1 1.00 1.63 1.25 2.03 523.30 1770.50<br />
5 Per 1 mt cost 2335.56<br />
West Forest Division- Rajpipla Page 71
Table no. 40.1.2 Technical specification Gully Plug<br />
SR.No PARTICULARS VALUE UNITS<br />
1 Top width <strong>of</strong> bund 1.25 M<br />
2 Bottom width <strong>of</strong> bund 2 M<br />
3 Depth above G.L 1.25 M<br />
4 Depth <strong>of</strong> foundation 0.3 M<br />
5 Cross section <strong>of</strong> bund 1.63 SQ.M<br />
Table no. 40.2 Estimation <strong>of</strong> Stone Bunding<br />
SR.NO DESCRIPTION No L B H Qty Rate Amount<br />
1 Above G.l stone bund 1 1.00 1.00+0.60/2 0.75<br />
2 1 1.00 0.80 0.75 0.60 523.30 523.30<br />
3 Per 1 mt cost 523.30<br />
0.60 M<br />
0.75 M<br />
1.00 M<br />
SR.No PARTICULARS VALUE UNITS<br />
1 Top width <strong>of</strong> bund 0.60 M<br />
2 Bottom width <strong>of</strong> bund 1.00 M<br />
3 Depth above G.L 0.75 M<br />
5 Cross section <strong>of</strong> bund 0.60 Sq.m<br />
West Forest Division- Rajpipla Page 72
Table no. 40.3 Estimation <strong>of</strong> Farm Bunding<br />
SR.NO DESCRIPTION No L B H Qty Rate Amount<br />
1 Farm Bund 1 1.00 2.1+0.75/2 0.75<br />
1 1.00 1.425 0.75 1.06875 46.9 50.1<br />
SR. No PARTICULARS VALUE UNITS<br />
1 Top width <strong>of</strong> bund 0.75 M<br />
2 Bottom width <strong>of</strong> bund 2.1 M<br />
3 Height <strong>of</strong> bund 1.25 M<br />
4 Cross section <strong>of</strong> bund 1.425 Sq.m<br />
West Forest Division- Rajpipla Page 73
Estimation <strong>of</strong> Nala plug 6.00 m<br />
NO DESCRIPTION NO L B D/H QTY T.QTY Rate Per Amount<br />
1<br />
2<br />
3<br />
4<br />
Excavation for foundation ….<br />
Body wall 1 2.00 1.20 1.20 2.88<br />
Apron 1 1.70 1.20 0.60 1.22<br />
End wall 1 1.70 0.60 0.60 0.61<br />
Wing wall 2 1.80 0.90 0.90 2.92<br />
Key wall - L & R side 2 2.15 1.20 0.90 4.64 12.28 69.60 Cu.m 854.4096<br />
Cement concrete in 1:4:8<br />
Body wall 1 2.00 1.20 0.10 0.24<br />
Apron 1 2.00 2.85 0.10 0.57<br />
End wall 1 1.70 0.60 0.10 0.10<br />
Wing wall 2 1.95 0.90 0.10 0.35<br />
Key wall - L & R side 2 2.15 1.20 0.10 0.52 1.779 2270.90 Cu.m 4039.9311<br />
coarse rubble masonary in c.m 1:6<br />
Body wall up to g.l 1 2.00 0.90 1.10 1.98<br />
Body wall up to g.l to top( B=<br />
0.9+0.6/2=.75) 1 2.00 0.75 1.00 1.50<br />
Apron 1 2.00 1.50 0.30 0.90<br />
End wall up to top 1 2.00 0.30 0.50 0.30<br />
Wing wall up to g.l. 2 1.80 0.60 0.80 1.73<br />
Wing wall up to g.l to top. ( h =<br />
1.30+0.30/2 ) 2 1.80 0.60 0.80 1.73<br />
Key wall - L & R side up to g.l. 2 2.00 0.60 1.10 2.64<br />
Key wall - L g.l to top 2 2.00 0.60 1.20 2.88 13.66 1998 Cu.m 27283.3224<br />
concrete ( 1 : 2 : 4 ) with black stone<br />
Body wall 1 2.00 0.60 0.10 0.12<br />
Apron 1 2.00 1.50 0.20 0.60<br />
End wall 1 2.00 0.30 0.10 0.06<br />
Wing wall 2 2.00 0.60 0.10 0.24<br />
Key wall - L & R side 2 2.00 0.60 0.10 0.24 1.26 3215 Cu.m 4050.27<br />
West Forest Division- Rajpipla Page 74
cement plastering in cm 1:3 ( 20mm<br />
tk )<br />
Body wall 2 2.00 1.10 4.40<br />
Apron 1 2.00 1.50 3.00<br />
5<br />
End wall 2 2.00 0.45 1.80<br />
End wall top 1 2.00 0.30 0.60<br />
Wing wall top 2 2.00 0.60 2.40<br />
Fair side <strong>of</strong> wing wall 2 1.80 0.80 2.88<br />
Key wall - L & R side top 2 2.00 0.60 2.40<br />
Key wall - L & R both side 4 2.00 0.60 4.80 22.28 113.3 Sq.m 2524.324<br />
6 Name plate. 1 nos 1200 Nos 1200<br />
TOTAL :- 39952.2571<br />
SAY :- 39900.00<br />
Cross section <strong>of</strong> Nala Plug<br />
Cross section <strong>of</strong> Nala Plu<br />
West Forest Division- Rajpipla Page 75
Table no. 40.5 Estimation <strong>of</strong> Check dam<br />
Estimate <strong>of</strong> Check dam<br />
NO DESCRIPTION NO L B D/H QTY T.QTY RATE PER AMOUNT<br />
Excavation for foundation …<br />
Body wall...... 1 5.00 2.00 1.50 15.00<br />
Key wall (L) side........ 1 2.25 2.00 1.50 6.75<br />
1<br />
Key wall (R) side........ 1 2.25 2.00 1.50 6.75<br />
Side wall......... 2 1.80 2.00 1.50 10.80<br />
End wall....... 1 9.00 0.60 0.60 3.24<br />
Apron..... 1 5.00 1.80 0.60 5.40<br />
47.94 69.6 3336.624<br />
C.C 1:4:8 …..<br />
Body wall...... 1 5.00 2.00 0.30 3.00<br />
Key wall (L) side........ 1 2.25 2.00 0.30 1.35<br />
2<br />
Key wall (R) side........ 1 2.25 2.00 0.30 1.35<br />
Side wall......... 2 1.80 2.00 0.30 2.16<br />
End wall....... 1 9.00 0.60 0.30 1.62<br />
Apron..... 1 5.00 2.50 0.30 3.75<br />
13.23 2271 30044.01<br />
C.C 1:2:4 …..<br />
3<br />
Body wall up to G.L....... 1 5.00 1.50 1.20 9.00<br />
Body wall up to G.L to top… 1 5.50 1.125 1.50 9.28<br />
(B=.75+1.5/2=1.125)<br />
Key wall top 2 2.25 0.75 0.15 0.51<br />
End wall top..... 1 5.50 0.30 0.15 0.25<br />
Side wall top..... 2 2.50 0.75 0.15 0.56<br />
Apron.... 1 5.50 2.45 0.30 4.04<br />
23.64<br />
3215 75990.78<br />
West Forest Division- Rajpipla Page 76
C.C 1:3:6<br />
Key wall up to G.L........ 2 2.25 1.50 1.20 8.10<br />
Key wall up to G.L to top...... 2 2.25 1.125 2.00 10.13<br />
.(B=.75+1.5/2=1.125)<br />
4<br />
Side wall up to G.L...... 2 2.75 1.50 1.20 9.90<br />
Side wall up to G.L to top… 2 2.75 1.125 2.00 12.38<br />
(B.=.75+1.5/2=1.125) 0.00<br />
End wall up to G.L... 1 5.00 0.30 0.30 0.45<br />
End wall up to G.L to top..... 1 5.50 0.30 0.30 0.50<br />
41.45 2509 103997.9<br />
Cement plaster in 20 mm tk<br />
Body wall top.. 1 5.50 0.75 4.13<br />
Body wall D/S side... 1 5.50 1.50 8.25<br />
Body wall u/S side... 1 5.50 1.50 8.25<br />
5<br />
Side wall top... 2 2.75 0.75 4.13<br />
Side wall inner side.. 2 2.50 2.15 10.75<br />
Side wall front side.. 2 1.125 2.15 4.84<br />
Endwall side…. 2 5.50 0.30 3.30<br />
End wall top… 1 5.50 0.30 1.65<br />
45.29 113 5131.074<br />
6 Name plate 1 1 Nos 500 500<br />
TOTAL AMOUNT :- 219000.42<br />
SAY :- 219000.00<br />
West Forest Division- Rajpipla Page 77
Cross section <strong>of</strong> check dam<br />
West Forest Division- Rajpipla Page 78
Table no. 40.6 Estimation <strong>of</strong> New pond<br />
NO DESCRIPTION NO L B D/H QTY T.QTY RATE PER AMOUNT<br />
1 Excavation work <strong>of</strong> pond 1 65+45/2 58+40/2 1.50<br />
55.00 49.00 1.50 4042.50 4042.50 49.60 200508<br />
West Forest Division- Rajpipla Page 79
Table no.41: Details <strong>of</strong> activities connected with vegetative cover in watershed works<br />
S.<br />
No<br />
.<br />
Name <strong>of</strong><br />
village<br />
Name <strong>of</strong> structure/<br />
work<br />
Type <strong>of</strong> treatment<br />
(i)<br />
Ridg<br />
e<br />
area<br />
(R)<br />
Drai<br />
nage<br />
line<br />
(D)<br />
(iii)<br />
Lan<br />
d<br />
dev.<br />
(L)<br />
Priv<br />
ate<br />
Type <strong>of</strong> land<br />
Com<br />
mun<br />
ity<br />
Oth<br />
ers<br />
(pl.<br />
spec<br />
ify)<br />
Executin<br />
g agency<br />
UG<br />
SHG<br />
Others<br />
(pl.<br />
specify)<br />
Area<br />
(ha)<br />
No. <strong>of</strong><br />
plants<br />
Target<br />
Estima<br />
ted<br />
cost<br />
(Rs. in<br />
lakh)<br />
Expected<br />
month &<br />
year <strong>of</strong><br />
completio<br />
n (mm/<br />
yyyy)<br />
1 Kharetha<br />
2 Kund<br />
3<br />
Vanderve<br />
li<br />
Distribution <strong>of</strong><br />
horticulture plant<br />
L P WC 1.18 475 1.9 2013<br />
Fruit tree plantation L C SHG 1 400 1.29 2012<br />
Farm forestry L P WC 10.9 12100 1.21 2013<br />
Fuel wood and Timber<br />
plantation<br />
L C SHG 5 12110 1.21 2014<br />
fodder development L C SHG 2 0.26 2013<br />
Nursery L C SHG 68.41 76000 0.76 2014<br />
Total 88.49 101085 6.63<br />
Distribution <strong>of</strong><br />
horticulture plant<br />
L P WC 0.5 207.5 0.83 2013<br />
Farm forestry L P WC 3.6 4000 0.4 2013<br />
Fuel wood and Timber<br />
plantation<br />
L C SHG 5 12110 1.211 2014<br />
fodder development L C SHG 2.0 0.26 2013<br />
Nursery L C SHG 32.40 36000 0.36 2014<br />
Total 43.52 52317 3.06<br />
Distribution <strong>of</strong><br />
horticulture plant<br />
L P WC 0.86 345 1.38 2013<br />
Fruit tree plantation L C SHG 1 400 1.29 2012<br />
Farm forestry L P WC 7 8000 0.8 2013<br />
fodder development L C SHG 2 0.26 2013<br />
West Forest Division- Rajpipla Page 80
4 Valpor<br />
5 Galiba<br />
6 Fichwada<br />
Nursery L C SHG 43 48000 0.48 2014<br />
Total 59.27 68855 5.42<br />
Distribution <strong>of</strong><br />
horticulture plant<br />
L P WC 0.86 348 1.39 2013<br />
Fruit tree plantation L C SHG 1 400 1.29 2012<br />
Farm forestry L P WC 8.6 9600 0.96 2013<br />
Fuel wood and Timber<br />
plantation<br />
L C SHG 5 12110 1.211 2014<br />
fodder development L C SHG 1 0.13 2013<br />
Nursery L C SHG 54 60000 0.6 2014<br />
Total 70.52 82457 5.58<br />
Distribution <strong>of</strong><br />
horticulture plant<br />
L P WC 1.63 650 2.6 2013<br />
Fruit tree plantation L C SHG 1 400 1.29 2012<br />
Farm forestry L P WC 11.3 12600 1.26 2013<br />
Fuel wood and Timber<br />
plantation<br />
L C SHG 5 12110 1.211 2014<br />
fodder development L C SHG 8 1.04 2013<br />
Nursery L C SHG 68 75000 0.75 2014<br />
Total 94.47 100760 8.15<br />
Distribution <strong>of</strong><br />
horticulture plant<br />
L P WC 1.03 412.5 1.65 2013<br />
Fruit tree plantation L C SHG 1 400 1.29 2012<br />
Farm forestry L P WC 9.1 10100 1.01 2013<br />
Fuel wood and Timber<br />
plantation<br />
L C SHG 5 12110 1.211 2014<br />
fodder development L C SHG 4 0.52 2013<br />
Nursery L C SHG 49.50 55000 0.55 2014<br />
Total 69.63 78022 6.23<br />
West Forest Division- Rajpipla Page 81
7 Rupghat<br />
8 Sankoi<br />
9 Varkhadi<br />
Distribution <strong>of</strong><br />
horticulture plant<br />
L P WC 1.10 442.5 1.77 2013<br />
Fruit tree plantation L C SHG 1 400 1.29 2012<br />
Farm forestry L P WC 10.9 12100 1.21 2013<br />
Fuel wood and Timber<br />
plantation<br />
L C SHG 5 12110 1.211 2014<br />
fodder development L C SHG 2 0.52 2013<br />
Nursery L C SHG 22.50 25000 0.25 2014<br />
Total<br />
42.50 50052 6.25<br />
Distribution <strong>of</strong><br />
horticulture plant<br />
L P WC 1.625 650 2.6 2013<br />
Fruit tree plantation L C SHG 1 400 1.29 2012<br />
Farm forestry L P WC 27.0 29990 2.999 2013<br />
Fuel wood and Timber<br />
plantation<br />
L C SHG 5 12110 1.211 2014<br />
fodder development L C SHG 8 1.04 2013<br />
Nursery L C SHG 100.81 112000 1.12 2014<br />
Total<br />
143.43 155150 10.26<br />
Distribution <strong>of</strong><br />
horticulture plant<br />
L P WC 0.681 272.5 1.09 2013<br />
Fruit tree plantation L C SHG 1 400 1.29 2012<br />
Farm forestry L P WC 9.5 10600 1.06 2013<br />
Fuel wood and Timber<br />
plantation<br />
L C SHG 5 12110 1.211 2014<br />
fodder development L C SHG 4 0.52 2013<br />
Nursery L C SHG 36.00 40000 0.4 2014<br />
Total<br />
56.23 63382 5.57<br />
West Forest Division- Rajpipla Page 82
Estimation <strong>of</strong> Fruit tree plantation<br />
Sr. No. Description No L B H QTY T.QTY<br />
RATE<br />
Rs.<br />
T.AMOUNT Rs.<br />
1 Site clearance & ploughing with cultivation Lump sump 5500 5500.00<br />
2 Excavation <strong>of</strong> plant pit 533 0.45 0.45 0.45 48.57 48.57 69.6 3380.45<br />
3 No. <strong>of</strong> Mango plants 400 400 55 22000.00<br />
4 No. <strong>of</strong> drumstick plants 133 133 12 1596.00<br />
5<br />
Three times <strong>of</strong> weeding & soil work, with<br />
transportation charges 533 533 8.5 4530.50<br />
6 400 mt fencing work 400 Per Rmt 400 230 92000.00<br />
TOTAL :- 129006.95<br />
Estimation <strong>of</strong> Fuel wood and timber plantation in 1 hac.<br />
Sr.<br />
No. Description No.<br />
Length<br />
(m)<br />
Width<br />
(m)<br />
Width<br />
(m) Unit Quantity<br />
Rate<br />
Rs.<br />
Amount Rs.<br />
1 Site clearance 1 Per hac. 6048.00<br />
2 Digging <strong>of</strong> pits for plants in S<strong>of</strong>t soil 1111 0.3 0.3 0.3 29.997 69.60 2087.79<br />
3 Rate per plant 1111 1111 4.00 4444.00<br />
4<br />
Transport <strong>of</strong> plants from Nursery to camp<br />
site with Loading and unloading <strong>of</strong> plants<br />
1111 1111 3.00 3333<br />
5<br />
Cost <strong>of</strong> Fertilizer & insecticides including<br />
application. 1111 1111 2.00 2222.00<br />
6 Weeding and soil working 2 times 1111 1111 6.00 6666.00<br />
7 Site cleaning <strong>of</strong> prosopis 400 400 13.00 5200.00<br />
8 TOTAL :- 30000.791<br />
West Forest Division- Rajpipla Page 83
Table no.42: Details <strong>of</strong> allied / other activities<br />
Sr. No.<br />
Name <strong>of</strong><br />
village<br />
1 Kharetha<br />
Type <strong>of</strong> land<br />
Executing<br />
agency<br />
Target<br />
Name <strong>of</strong> activity<br />
Others UG, SHG and Estimated Expected month &<br />
Private Community (pl.<br />
specify)<br />
Others (pl.<br />
specify)<br />
cost (Rs.<br />
in lakh)<br />
year <strong>of</strong> completion<br />
(mm/yyyy)<br />
Vermi compost net house C SHG 1.25 2014<br />
Kitchen Garden kit P UG 0.15 2011<br />
Animal husbandry C SHG 2.26 2012<br />
Poultry unit C SHG 0.60 2012<br />
Tailoring Machine P UG 0.35 2013<br />
Cattle camp C UG 0.90 2014<br />
Cycle Repairing kit with cabin P WC 1.00 2011<br />
Floriculture Demo. Plot P UG 0.59 2014<br />
High yielding varieties seed<br />
Distribution P UG 0.75 2013<br />
Crop Demonstration P UG 0.24 2014<br />
Lift irrigation unit P UG 1.50 2011<br />
Mini oil mill Unit C SHG 0.10 2011<br />
Revolving fund C SHG 0.15 2013<br />
Leaf plate and Cup making<br />
Machine C SHG 0.10 2012<br />
Hair saloon with cabin P UG 0.50 2013<br />
Floor mill with rice mill with<br />
engine machine C SHG 1.50 2012<br />
Cantering C WC 1.00 2014<br />
Mixer machine C SHG 1.75 2014<br />
Sugarcane juice machine P UG 0.50 2013<br />
Masonry kit P UG 0.10 2012<br />
Total 15.29<br />
West Forest Division- Rajpipla Page 84
Sr. No.<br />
Name <strong>of</strong><br />
village<br />
Name <strong>of</strong> activity<br />
Private<br />
Type <strong>of</strong> land<br />
Community<br />
Others<br />
(pl.<br />
specify)<br />
Executing<br />
agency<br />
UG, SHG and<br />
Others (pl.<br />
specify)<br />
Estimated<br />
cost (Rs.<br />
in lakh)<br />
Target<br />
Expected month &<br />
year <strong>of</strong> completion<br />
(mm/yyyy)<br />
Vermi compost net house C SHG 0.30 2014<br />
Kitchen Garden kit P UG 0.03 2011<br />
Animal husbandry C SHG 2.26 2012<br />
Poultry unit C SHG 0.14 2012<br />
Tailoring Machine P UG 0.14 2013<br />
Cattle camp C UG 0.30 2014<br />
2 Kund<br />
Cycle Repairing kit with cabin P WC 0.50 2011<br />
Floriculture Demo. Plot P UG 0.20 2014<br />
High yielding varieties seed<br />
Distribution P UG 0.35 2013<br />
Crop Demonstration P UG 0.15 2014<br />
Lift irrigation unit P UG 0.75 2011<br />
Mini oil mill Unit C SHG 0.10 2011<br />
Revolving fund C SHG 0.10 2013<br />
Leaf plate and Cup making<br />
Machine C SHG 0.10 2012<br />
Hair saloon with cabin P UG 0.50 2013<br />
Sugarcane juice machine P UG 0.50 2013<br />
Total 6.42<br />
West Forest Division- Rajpipla Page 85
Sr. No.<br />
Name <strong>of</strong><br />
village<br />
3 Vanderveli<br />
Name <strong>of</strong> activity<br />
Private<br />
Type <strong>of</strong> land<br />
Community<br />
Others<br />
(pl.<br />
specify)<br />
Executing<br />
agency<br />
UG, SHG and<br />
Others (pl.<br />
specify)<br />
Estimated<br />
cost (Rs.<br />
in lakh)<br />
Target<br />
Expected month &<br />
year <strong>of</strong> completion<br />
(mm/yyyy)<br />
Vermi compost net house C SHG 0.70 2014<br />
Kitchen Garden kit P UG 0.25 2011<br />
Animal husbandry C SHG 2.26 2012<br />
Poultry unit C SHG 0.60 2012<br />
Tailoring Machine P UG 0.21 2013<br />
Cattle camp C UG 0.60 2014<br />
Cycle Repairing kit with cabin P WC 0.50 2011<br />
Floriculture Demo. Plot P UG 0.30 2014<br />
High yielding varieties seed<br />
Distribution P UG 0.50 2013<br />
Crop Demonstration P UG 0.52 2014<br />
Lift irrigation unit P UG 1.50 2011<br />
Mini oil mill Unit C SHG 0.30 2011<br />
Revolving fund C SHG 0.15 2013<br />
Leaf plate and Cup making<br />
Machine C SHG 0.10 2012<br />
Hair saloon with cabin P UG 0.50 2013<br />
Floor mill with rice mill with<br />
engine machine C SHG 1.50 2012<br />
Utensil service C SHG 2.00 2014<br />
Total 12.49<br />
West Forest Division- Rajpipla Page 86
Sr. No.<br />
Name <strong>of</strong><br />
village<br />
4 Valpor<br />
Type <strong>of</strong> land<br />
Executing<br />
agency<br />
Target<br />
Name <strong>of</strong> activity<br />
Others UG, SHG and Estimated Expected month &<br />
Private Community (pl.<br />
specify)<br />
Others (pl.<br />
specify)<br />
cost (Rs.<br />
in lakh)<br />
year <strong>of</strong> completion<br />
(mm/yyyy)<br />
Vermi compost net house C SHG 0.90 2014<br />
Kitchen Garden kit P UG 0.16 2011<br />
Animal husbandry C SHG 2.26 2012<br />
Tailoring Machine P UG 0.21 2013<br />
Cattle camp C UG 0.60 2014<br />
Cycle Repairing kit with cabin P WC 0.50 2011<br />
Floriculture Demo. Plot P UG 0.25 2014<br />
High yielding varieties seed<br />
Distribution P UG 0.13 2013<br />
Crop Demonstration P UG 0.52 2014<br />
Lift irrigation unit P UG 1.50 2011<br />
Mini oil mill Unit C SHG 0.30 2011<br />
Revolving fund C SHG 0.15 2013<br />
Leaf plate and Cup making<br />
Machine C SHG 0.10 2012<br />
Hair saloon with cabin P UG 0.50 2013<br />
Floor mill with rice mill with<br />
engine machine C SHG 1.50 2012<br />
Utensil service C SHG 2.00 2014<br />
Total 11.58<br />
West Forest Division- Rajpipla Page 87
Sr. No.<br />
Name <strong>of</strong><br />
village<br />
5 Galiba<br />
Type <strong>of</strong> land<br />
Executing<br />
agency<br />
Target<br />
Name <strong>of</strong> activity<br />
Others UG, SHG and Estimated Expected month &<br />
Private Community (pl.<br />
specify)<br />
Others (pl.<br />
specify)<br />
cost (Rs.<br />
in lakh)<br />
year <strong>of</strong> completion<br />
(mm/yyyy)<br />
Vermi compost net house C SHG 1.22 2014<br />
Kitchen Garden kit P UG 0.40 2011<br />
Animal husbandry C SHG 4.52 2012<br />
Poultry unit C SHG 1.20 2012<br />
Tailoring Machine P UG 0.35 2013<br />
Cattle camp C UG 1.20 2014<br />
Cycle Repairing kit with cabin P WC 1.00 2011<br />
Floriculture Demo. Plot P UG 1.40 2014<br />
High yielding varieties seed<br />
Distribution P UG 1.86 2013<br />
Crop Demonstration P UG 0.52 2014<br />
Lift irrigation unit P UG 3.75 2011<br />
Mini oil mill Unit C SHG 0.30 2011<br />
Revolving fund C SHG 0.25 2013<br />
Leaf plate and Cup making<br />
Machine C SHG 0.20 2012<br />
Hair saloon with cabin P UG 0.50 2013<br />
Floor mill with rice mill with<br />
engine machine C SHG 1.50 2012<br />
Utensil service C SHG 2.00 2014<br />
Fisheries P UG 1.50 2014<br />
Sugarcane juice machine P UG 0.50 2013<br />
Bidi making kit P UG 0.10 2012<br />
Total 24.27<br />
West Forest Division- Rajpipla Page 88
Sr. No.<br />
Name <strong>of</strong><br />
village<br />
6 Fichwada<br />
Type <strong>of</strong> land<br />
Executing<br />
agency<br />
Target<br />
Name <strong>of</strong> activity<br />
Others UG, SHG and Estimated Expected month &<br />
Private Community (pl.<br />
specify)<br />
Others (pl.<br />
specify)<br />
cost (Rs.<br />
in lakh)<br />
year <strong>of</strong> completion<br />
(mm/yyyy)<br />
Vermi compost net house C SHG 1.00 2014<br />
Kitchen Garden kit P UG 0.15 2011<br />
Poultry unit C SHG 0.60 2012<br />
Tailoring Machine P UG 0.21 2013<br />
Cattle camp C UG 0.60 2014<br />
Cycle Repairing kit with cabin P WC 0.50 2011<br />
Floriculture Demo. Plot P UG 0.18 2014<br />
High yielding varieties seed<br />
Distribution P UG 0.40 2013<br />
Crop Demonstration P UG 0.26 2014<br />
Lift irrigation unit P UG 1.50 2011<br />
Mini oil mill Unit C SHG 0.30 2011<br />
Revolving fund C SHG 0.15 2013<br />
Leaf plate and Cup making<br />
Machine C SHG 0.10 2012<br />
Hair saloon with cabin P UG 0.50 2013<br />
Floor mill with rice mill with<br />
engine machine C SHG 1.50 2012<br />
Utensil service C SHG 2.00 2014<br />
Fisheries P UG 1.50 2014<br />
Total 11.45<br />
West Forest Division- Rajpipla Page 89
Sr. No.<br />
Name <strong>of</strong><br />
village<br />
7 Rupghat<br />
Type <strong>of</strong> land<br />
Executing<br />
agency<br />
Target<br />
Name <strong>of</strong> activity<br />
Others UG, SHG and Estimated Expected month &<br />
Private Community (pl.<br />
specify)<br />
Others (pl.<br />
specify)<br />
cost (Rs.<br />
in lakh)<br />
year <strong>of</strong> completion<br />
(mm/yyyy)<br />
Vermi compost net house C SHG 0.30 2014<br />
Kitchen Garden kit P UG 0.15 2011<br />
Animal husbandry C SHG 2.26 2012<br />
Poultry unit C SHG 0.60 2012<br />
Tailoring Machine P UG 0.14 2013<br />
Cattle camp C UG 0.30 2014<br />
Cycle Repairing kit with cabin P WC 0.50 2011<br />
Floriculture Demo. Plot P UG 0.43 2014<br />
High yielding varieties seed<br />
Distribution P UG 0.60 2013<br />
Crop Demonstration P UG 0.26 2014<br />
Lift irrigation unit P UG 1.50 2011<br />
Mini oil mill Unit C SHG 0.10 2011<br />
Revolving fund C SHG 0.15 2013<br />
Leaf plate and Cup making<br />
Machine C SHG 0.10 2012<br />
Hair saloon with cabin P UG 0.50 2013<br />
Floor mill with rice mill with<br />
engine machine C SHG 1.50 2012<br />
Utensil service C SHG 2.00 2014<br />
Fisheries P UG 1.00 2014<br />
Handy craft unit (Bamboo) P UG 0.40 2012<br />
Total 12.79<br />
West Forest Division- Rajpipla Page 90
Sr. No.<br />
Name <strong>of</strong><br />
village<br />
8 Sankoi<br />
Type <strong>of</strong> land<br />
Executing<br />
agency<br />
Target<br />
Name <strong>of</strong> activity<br />
Others UG, SHG and Estimated Expected month &<br />
Private Community (pl.<br />
specify)<br />
Others (pl.<br />
specify)<br />
cost (Rs.<br />
in lakh)<br />
year <strong>of</strong> completion<br />
(mm/yyyy)<br />
Vermi compost net house C SHG 2.00 2014<br />
Kitchen Garden kit P UG 0.20 2011<br />
Animal husbandry C SHG 4.52 2012<br />
Poultry unit C SHG 1.80 2012<br />
Tailoring Machine P UG 0.49 2013<br />
Cattle camp C UG 1.55 2014<br />
Cycle Repairing kit with cabin P WC 1.00 2011<br />
Floriculture Demo. Plot P UG 1.35 2014<br />
High yielding varieties seed<br />
Distribution P UG 1.86 2013<br />
Crop Demonstration P UG 1.00 2014<br />
Lift irrigation unit P UG 6.75 2011<br />
Mini oil mill Unit C SHG 0.70 2011<br />
Revolving fund C SHG 0.35 2013<br />
Leaf plate and Cup making<br />
Machine C SHG 0.20 2012<br />
Hair saloon with cabin P UG 0.50 2013<br />
Floor mill with rice mill with<br />
engine machine C SHG 1.50 2012<br />
Utensil service C SHG 2.00 2014<br />
Centaring C SHG 1.00 2011<br />
Bidi making kit P UG 0.10 2012<br />
Masonry kit P UG 0.30 2013<br />
Sugarcane juice machine P UG 0.50 2012<br />
Mixer machine C SHG 1.75 2012<br />
Total 31.42<br />
West Forest Division- Rajpipla Page 91
Sr. No.<br />
Name <strong>of</strong><br />
village<br />
9 Varkhadi<br />
Type <strong>of</strong> land<br />
Executing<br />
agency<br />
Target<br />
Name <strong>of</strong> activity<br />
Others UG, SHG and Estimated Expected month &<br />
Private Community (pl.<br />
specify)<br />
Others (pl.<br />
specify)<br />
cost (Rs.<br />
in lakh)<br />
year <strong>of</strong> completion<br />
(mm/yyyy)<br />
Vermi compost net house C SHG 0.55 2014<br />
Kitchen Garden kit P UG 0.15 2011<br />
Poultry unit C SHG 0.60 2012<br />
Tailoring Machine P UG 0.14 2013<br />
Cattle camp C UG 0.60 2014<br />
Cycle Repairing kit with cabin P WC 0.50 2011<br />
Floriculture Demo. Plot P UG 0.23 2014<br />
High yielding varieties seed<br />
Distribution P UG 0.40 2013<br />
Crop Demonstration P UG 0.26 2014<br />
Lift irrigation unit P UG 1.50 2011<br />
Mini oil mill Unit C SHG 0.10 2011<br />
Revolving fund C SHG 0.15 2013<br />
Leaf plate and Cup making<br />
Machine C SHG 0.10 2012<br />
Hair saloon with cabin P UG 0.50 2013<br />
Floor mill with rice mill with<br />
engine machine C SHG 1.50 2012<br />
Utensil service C SHG 2.00 2014<br />
Handy craft unit (Bamboo) P UG 0.40 2013<br />
Fisheries P UG 1.00 2012<br />
Sugarcane juice machine P UG 0.50 2012<br />
Total 11.18<br />
West Forest Division- Rajpipla Page 92
Estimation <strong>of</strong> Vermi compost unit<br />
No Description No L B H Qty T.Qty Rate Per Amount<br />
1 Excavtion for pole foundation 6 0.6 0.6 0.6 1.296 1.296<br />
Excavation Long wall 2 6 0.3 0.45 1.62 1.62<br />
2 3 0.3 0.45 0.81 0.81<br />
3.726 69.6 Cu.m 259.3296<br />
2 Excavtion p.c.c. 1:4:8 6 0.6 0.6 0.6 1.296 1.296<br />
2 6 0.3 0.1 0.36 0.36<br />
2 3 0.3 0.1 0.18 0.18<br />
1.836 2270.9 Cu.m 4169.372<br />
3 Outer side brick Masonary 2 6 0.23 0.75 2.07 2.07<br />
2 3 0.23 0.75 1.035 1.035<br />
3.105 3.105 2403.4 Cu.m 7462.557<br />
4 M.S.Pole 1.25 " 6 3 18<br />
Vertical pole 4 3 12<br />
Top horizontal long side 3 3 9<br />
Top horizontal Short Side 39 39 129 k.g. 5031<br />
5 90% Green net<br />
Long side 2 7 3 21<br />
short side 2 4 3 12<br />
Top <strong>of</strong> green house 1 6 3 18<br />
51 51 40 Sq.m. 2040<br />
6 Esiana fortyda verm. 25 30 30 150 kg 4500<br />
7 Cement plaster<br />
Long side wall 4 6 0.3 7.2<br />
short side wall 2 3 0.3 1.8<br />
long wall top 2 6 0.23 2.76<br />
short wall top 2 3 0.23 1.38<br />
8 Nat bulots , labour charges Lump sump 1345<br />
13.14 71.8 Sq.m. 943.452<br />
25750.71<br />
West Forest Division- Rajpipla Page 93
Cost estimation <strong>of</strong> animal husbandry<br />
PROJECT REPORT OF ANIMAL HUSBANDARY<br />
Particulars<br />
Total expenditure<br />
Invest <strong>of</strong> 10 nos. <strong>of</strong> Buffallos = 10 x 22000 220000<br />
TOTAL :- 220000<br />
Monthly Expenditure<br />
10kg cattle food per buffalos per day<br />
10kg x 10 buffalo's x 30 per day= 3000 kg requirement <strong>of</strong><br />
cattle food per month ( 43 x 525 ) 22575<br />
Per day per buffallo, green grass = 20 kg<br />
Total expenditure = 20kg x 10 buf. X 30 days = 6000 kg<br />
( 6000 x 0.40 ) 2400<br />
Veterinary charges ( 200 x 10 ) 2000<br />
TOTAL :- 26975<br />
MONTHLY INCOME<br />
Per day buffallo total production = 10 lit.<br />
10 lit x 10 buf. X 30 day = 3000 lit.<br />
Per lit = 24 Rs /- ( 3000 x 24 ) 72000<br />
Production <strong>of</strong> dung per Animal = 1 ton<br />
Per 10 Animal = 1 x 10 = 10 ton<br />
( 10 X 4000 ) 4000<br />
Empty begs ( 40 x 10 ) 400<br />
TOTAL :- 76400<br />
Total income <strong>of</strong> milk production 76400 x 10 :- 764000<br />
Total expenditure ( 12 * 26975 ):- 323700<br />
Net Pr<strong>of</strong>it 440300<br />
Annual income per Animal 44030<br />
MONTHLY INCOME PER ANIMAL:- 4403<br />
West Forest Division- Rajpipla Page 94
Estimation <strong>of</strong> Utensil services<br />
Sr. No. Particulars No Rate Per Amount<br />
Kitchen Set<br />
1 Plate, Bowl, Glass, Spoon. 250 125 Set 31250<br />
2 Chairs 180 300 no 54000<br />
3 Table 10 4500 no 45000<br />
4 Water pip 3 1500 no 4500<br />
5 Big & Small Tapela,Big Spoon,Tavdi,Kthrot etc. 1 40000 Set 40000<br />
6 chulo and pipe 3 7000 set 21000<br />
7 Patharana 1 5250 set 5250<br />
Total :- 201000<br />
West Forest Division- Rajpipla Page 95
Table no.43: Details <strong>of</strong> activities in the CPRs in the project areas<br />
Target<br />
S. No.<br />
Name(s) <strong>of</strong> the<br />
villages<br />
CPR<br />
particulars<br />
Activity proposed<br />
Target area under<br />
the activity (ha)<br />
Estimated<br />
expenditure (Rs.)<br />
Expected no.<br />
<strong>of</strong><br />
beneficiaries<br />
1 Kharetha Gouchar Fodder <strong>Development</strong> 4 0.52 10<br />
Fuel wood and timber plantation 5 1.21 11<br />
Fruit tree plantation 1 1.29 11<br />
New Pond 7.65 1.80 7<br />
Outlet 5.9 2.00 7<br />
Total 23.6 6.8 46.0<br />
2 Vanderveli Gouchar Fodder <strong>Development</strong> 2 0.26 10<br />
New Pond 8.5 2.00 8<br />
Fuel wood and timber plantation 5 1.21 11<br />
Fruit tree plantation 1 1.29 11<br />
Outlet 7.4 2.50 8<br />
Total 23.9 7.3 48.0<br />
3 Valpor Gouchar Fodder <strong>Development</strong> 1 0.13 11<br />
Fuel wood and timber plantation 5 1.21 9<br />
Fruit tree plantation 1 1.29 7<br />
New Pond 8.5 1.50 5<br />
Outlet 7.4 2.50 5<br />
Total 22.9 6.6 37.0<br />
4 Galiba Gouchar Fuel wood and timber plantation 5 1.21 9<br />
Fruit tree plantation 1 1.29 10<br />
Fodder <strong>Development</strong> 8 1.04 10<br />
New Pond 8.5 2.00 8<br />
Outlet 7.4 3.00 8<br />
Total 29.9 8.5 45.0<br />
West Forest Division- Rajpipla Page 96
5 Fichwada Gouchar<br />
Fodder <strong>Development</strong> 4 0.52 11<br />
Fuel wood and timber plantation 5 1.21 9<br />
Fruit tree plantation 1 1.29 10<br />
Outlet 7.4 2.50 7<br />
Fuel wood and timber plantation 5 1.21 9<br />
Total 22.4 6.7 46.0<br />
6 Rupghat Gouchar Fruit tree plantation 1 1.29 10<br />
Fodder <strong>Development</strong> 4 0.52 9<br />
New Pond 8.5 2.00 8<br />
Outlet 7.4 2.50 8<br />
Total 43.3 13.0 81<br />
7 Sankoi Waste land Check dam 28.4 8.25 10<br />
Check dam repairing 15.1 4.38 12<br />
New Pond 7.9 1.50 7<br />
Outlet 8.6 2.50 7<br />
Total 60.1 16.6 36.0<br />
8 Varkhadi Waste land Outlet 7.4 2.50 7<br />
Fuel wood and timber plantation 5 1.21 9<br />
Fruit tree plantation 1 1.29 10<br />
Fodder <strong>Development</strong> 4 0.52 9<br />
Total 17.4 5.5 35.0<br />
West Forest Division- Rajpipla Page 97
4.4 Capacity Building<br />
Capacity building is a process to strengthen the abilities <strong>of</strong> people, organizations and systems to make effective and efficient use <strong>of</strong><br />
resources in order to make achieve their own goals on a sustainable basis” (German Technical Corporation). The definition pretty much<br />
captures the essence <strong>of</strong> capacity building exercise in a holistic way by mentioning organization and system along with people. From a long time,<br />
the focus has been on people only. This leads to a distorted and suboptimal outcome <strong>of</strong> the whole capacity building exercise. No wonder, the<br />
realization has dawned upon the policymakers and they have started to emphasize upon the holistic approach rather than a piecemeal one.<br />
Table no. 44: Capacity Building Institution:<br />
S.<br />
No.<br />
Name <strong>of</strong> the<br />
Training<br />
Institute<br />
Full Address<br />
with contact<br />
no., website &<br />
e-mail<br />
1 KVK Chaswad<br />
Type <strong>of</strong><br />
Institute#<br />
Research<br />
institute<br />
Area(s) <strong>of</strong><br />
specialization$<br />
Accredita<br />
tion<br />
details<br />
Reference<br />
Year<br />
Trainings<br />
No. <strong>of</strong><br />
trainings<br />
assigned<br />
No. <strong>of</strong><br />
trainees to<br />
be trained<br />
Agriculture/Horticulture<br />
/Animal husbandry GoI 2011-2014 3 90<br />
2 AKRSP Netrang NGO Capacity building Private 2010-2014 3 450<br />
3<br />
Navsari<br />
Agriculture uni. Navsari University<br />
4 BISAG Gandhinagar<br />
Agriculture/Horticulture<br />
/Animal husbandry GoI 2011-2014 2 70<br />
Space<br />
Application Remote sensing & GIS GoG 2010-2015 3 9<br />
West Forest Division- Rajpipla Page 98
Table no. 45: Capacity Building plan:<br />
Sr. No.<br />
Name <strong>of</strong><br />
Project<br />
1 Sankoi-I<br />
Project Stakeholders<br />
Total no. <strong>of</strong><br />
persons<br />
No. <strong>of</strong> persons to<br />
be trained<br />
No. <strong>of</strong> training<br />
programmes<br />
Estimated cost<br />
(lakh)<br />
PIA 5 5 5 1.50<br />
WDTs 4 4 5 1.94<br />
UGs 245 90 5 6.60<br />
SHGs 450 450 7 17.90<br />
WCs 111 18 5 0.90<br />
Others (Pl. specify) 150 90 2 1.00<br />
Total 965 657 29 29.84<br />
Table no.46: Information, Education and Communication Activities:<br />
Sr. No. Activity Executing agency<br />
Estimated<br />
expenditure (Rs.)<br />
Outcome<br />
(may quantify, wherever possible)<br />
1 Street plays Local Drama Groups 75000<br />
2 Video shows Rajpipla West Forest Division 45000<br />
3 Pamphlets and posters Rajpipla West Forest Division 27000<br />
Awareness for the important <strong>of</strong><br />
watershed project<br />
4 Banners & Hordings Rajpipla West Forest Division 55000<br />
West Forest Division- Rajpipla Page 99
Figure- Capacity Building Training Activities<br />
West Forest Division- Rajpipla Page 100
CHAPTER-5<br />
BUDGETING<br />
The first step in budgeting is dividing the cost <strong>of</strong> the project into various component s as detailed in the common guidelines and done<br />
accordingly in table no. 47. It helps us in further identifying activities under different components and allocate appropriate funds.<br />
Table no. 47: Village wise- activity wise budget (Rs. In Lakh)<br />
Sr. No. Village Activity<br />
EPA<br />
Institution<br />
and CB<br />
DPR<br />
Watershed<br />
development<br />
Work<br />
Livelihood<br />
for asset<br />
less<br />
Production<br />
system and<br />
Microenterprises<br />
Consolidation<br />
TOTAL<br />
1 Kharetha 2.91 3.63 0.73 36.34 7.27 9.45 3.63 63.96<br />
2 Kund 0.73 0.92 0.18 9.16 1.83 2.38 0.92 16.12<br />
3 Vandarveli 2.11 2.64 0.53 26.43 5.29 6.87 2.64 46.51<br />
4 Valpor 1.5 1.88 0.38 18.78 3.76 4.88 1.88 33.06<br />
5 Galiba 4.84 6.05 1.21 60.46 12.09 15.72 6.05 106.42<br />
6 Fichvada 2.36 2.95 0.59 29.5 5.9 7.67 2.95 51.92<br />
7 Rupghat 2.22 2.78 0.56 27.79 5.56 7.22 2.78 48.91<br />
8 Sankoi 5.27 6.59 1.32 65.93 13.19 17.14 6.59 116.03<br />
9 Varkhadi 1.92 2.4 0.48 24 4.8 6.24 2.4 42.24<br />
TOTAL 23.86 29.84 5.98 298.39 59.69 77.57 29.84 525.17<br />
West Forest Division- Rajpipla Page 101
Table no. 48: Budget at a glance<br />
Sr. No. Budget component Cost (lakh)<br />
1 Administrative costs 59.68<br />
2 Monitoring 5.97<br />
3 Evaluation 5.97<br />
4 Entry Point activity 23.87<br />
5 Institution and Capacity Building 29.84<br />
6 Detailed Project Report 5.97<br />
7 Watershed <strong>Development</strong> Works 298.39<br />
8 Livelihood activities for asset less 59.68<br />
9 Production systems and micro-enterprises 77.58<br />
10 Consolidation phase 29.84<br />
TOTAL 596.79<br />
Table no.49: Details <strong>of</strong> Convergence <strong>of</strong> <strong>IWMP</strong> with other Schemes (Rs. In Lakh)<br />
Sr. No. Village Total cost requirement<br />
Total fund available<br />
under <strong>IWMP</strong> Gap in fund requirement<br />
1 Kharetha 68.42 53.06 15.36<br />
2 Kund 26.73 13.37 13.37<br />
3 Vandarveli 53.34 38.59 14.75<br />
4 Valpor 47.67 27.42 19.88<br />
5 Galiba 99.88 88.27 11.61<br />
6 Fichvada 59.48 43.07 16.26<br />
7 Rupghat 60.84 40.57 20.27<br />
8 Shankoi 118.96 96.26 22.70<br />
9 Varkhadi 45.81 35.04 10.77<br />
Total 581.13 435.65 144.97<br />
West Forest Division- Rajpipla Page 102
Table no.50: Details <strong>of</strong> Convergence <strong>of</strong> <strong>IWMP</strong> with oth0er Schemes<br />
S. No. Name <strong>of</strong> village<br />
1 Kharetha<br />
2 Kund<br />
Names <strong>of</strong><br />
Departments with<br />
Schemes<br />
converging with<br />
<strong>IWMP</strong><br />
Fund made<br />
available to<br />
<strong>IWMP</strong> due to<br />
convergence<br />
(Rs. in lakh)<br />
Was this fund<br />
included in<br />
Rs.12,000/ 15,000<br />
per ha.<br />
Yes<br />
No<br />
Name <strong>of</strong> activity/task/structure<br />
undertaken with converged funds<br />
(a) Structures<br />
(b) livelihoods<br />
(c ) Any other (pl. specify)<br />
Farm Bunding<br />
MGNREGS 0.50<br />
MGNREGS 1.00 Contour Trenches<br />
MGNREGS 4.50 New well<br />
MGNREGS 2.00 Check dam<br />
MGNREGS 4.00 Check dam Desilting<br />
Yes<br />
TASP 1.50 Lift Irrigation<br />
Forest 1.21 Fuel wood and Timber plantation<br />
Forest 0.50 Farm forestry<br />
SGSY 0.15 Revolving fund<br />
Total 15.36<br />
MGNREGS 0.91<br />
Gully Plug<br />
MGNREGS 1.00 Contour Trenches<br />
MGNREGS 3.00 New well<br />
MGNREGS 2.64 Stone Bunding<br />
MGNREGS 1.00 Percolation Tank<br />
SGSY 2.26 Yes<br />
Animal husbandry<br />
Forest 1.21 Fuel wood and Timber plantation<br />
TASP 0.75 Lift irrigation unit<br />
Forest 0.50 Dis. Of Horti.plant<br />
SGSY 0.10 Revolving fund<br />
Total 13.37<br />
Level at which<br />
decision for<br />
convergence<br />
was taken<br />
District Level<br />
District Level<br />
West Forest Division- Rajpipla Page 103
3 Vanderveli<br />
4 Valpor<br />
5 Galiba<br />
MGNREGS<br />
MGNREGS<br />
1.50<br />
1.00<br />
Farm Bunding<br />
Contour Trenches<br />
MGNREGS 3.00 New well<br />
Forest 1.21 Fuel wood and Timber plantation<br />
MGNREGS 3.54 Check dam<br />
MGNREGS 1.50 Yes<br />
Percolation Tank<br />
TASP 1.50 Lift irrigation unit<br />
Forest 0.55 Farm forestry<br />
Forest 0.80 Dis. Of Horti.plant<br />
SGSY 0.15 Revolving fund<br />
Total 14.75<br />
MGNREGS 1.15<br />
Farm Bunding<br />
MGNREGS 0.50 Contour Trenches<br />
MGNREGS 1.56 Gully plug<br />
MGNREGS 1.70 Nalaplug<br />
MGNREGS 1.50 New well<br />
Forest 0.55 Farm forestry<br />
Forest 1.21 Yes<br />
Fuel wood and Timber plantation<br />
MGNREGS 7.00 Check dam<br />
Forest 0.80 Dis. Of Horti.plant<br />
SGSY 2.26 Animal Husbandry<br />
TASP 1.5 Lift Irrigation<br />
SGSY 0.15 Revolving fund<br />
Total 19.88<br />
MGNREGS 1.50<br />
Farm Bunding<br />
MGNREGS 6.21 Check dam<br />
Forest 0.55 Farm forestry<br />
Forest 0.60 Dis. Of Horti.plant<br />
Yes<br />
MGNREGS 1.00 Contour Trenches<br />
MGNREGS 1.50 New well<br />
SGSY 0.25 Revolving fund<br />
Total 11.61<br />
District Level<br />
District Level<br />
District Level<br />
West Forest Division- Rajpipla Page 104
6 Fichwada<br />
7 Rupghat<br />
8 Sankoi<br />
MGNREGS 1.00<br />
Farm Bunding<br />
MGNREGS 1.00 Contour Trenches<br />
MGNREGS 1.50 New well<br />
Forest 0.30 Farm forestry<br />
Forest 0.60 Dis. Of Horti.plant<br />
Yes<br />
MGNREGS 9.00 Check dam<br />
TASP 1.50 Lift irrigation unit<br />
Forest 1.21 Fuel wood and Timber plantation<br />
SGSY 0.15 Revolving fund<br />
Total 16.26<br />
MGNREGS 2.60<br />
Farm Bunding<br />
MGNREGS 1.00 Contour Trenches<br />
MGNREGS 5.06 Gully plug<br />
MGNREGS 4.65 Nala Plug<br />
MGNREGS 1.00 Percolation Tank<br />
MGNREGS 2.00 Check dam<br />
Yes<br />
Forest 1.21 Fuel wood and Timber plantation<br />
Forest 0.50 Farm forestry<br />
TASP 1.50 Lift irrigation unit<br />
Forest 0.60 Dis. Of Horti.plant<br />
SGSY 0.15 Revolving fund<br />
Total 20.27<br />
MGNREGS 1.00<br />
Farm Bunding<br />
MGNREGS 2.50 Contour Trenches<br />
MGNREGS 3.00 Check dam<br />
Forest 2.50 Farm forestry<br />
TASP 5.25 Yes<br />
Lift irrigation unit<br />
Forest 0.60 Dis. Of Horti.plant<br />
MGNREGS 7.50 New well<br />
SGSY 0.35 Revolving fund<br />
Total 22.70<br />
District Level<br />
District Level<br />
District Level<br />
West Forest Division- Rajpipla Page 105
9 Varkhadi<br />
MGNREGS 2.67<br />
Farm Bunding<br />
MGNREGS 0.50 Contour Trenches<br />
Forest 0.76 Fuel wood and Timber plantation<br />
Forest 0.30 Farm forestry<br />
Forest 1.29 Fruit tree plantation unit<br />
Yes<br />
MGNREGS 3.00 New well<br />
Forest 0.60 Dis. Of Horti.plant<br />
TASP 1.5 Lift Irrigation<br />
SGSY 0.15 Revolving fund<br />
Total 10.77<br />
District Level<br />
West Forest Division- Rajpipla Page 106
CHAPTER-6<br />
EXPECTED OUTCOME<br />
6.1 Expected Outcomes<br />
6.1.1 Employment<br />
Employment is a big problem in the Sankoi project. Main occupation <strong>of</strong> the villagers is agriculture, animal husbandry and wage labour.<br />
However, due to Moderate Slope / Hilly soil, farmers take only kharif crops. Only few farmers take rabi crops. Lack <strong>of</strong> fodder, animal husbandry<br />
is very difficult in the villages. So farmers mainly depend on wage labour whole over the year.<br />
Project will provide wage employment as well as self employment to the villagers. Wage employment would be created by engaging the<br />
people in watershed development work like construction <strong>of</strong> check dam, farm bunding, nala plug, staggered contour trenches, Afforestation<br />
work. Self employment would be created by providing different agriculture activities like nursery, vermi-compost, fruit tree plantation and in<br />
animal husbandry by providing animals and fodder directly to the farmers. Project would provide indirectly self employment to the women<br />
through training activities <strong>of</strong> tailoring, poultry, fisheries, Utensil services, mini oil mill, leaf plate and cup making machine.<br />
West Forest Division- Rajpipla Page 107
Table no. 51: Employment in Project area:<br />
Wage employment<br />
Self employment<br />
Sr. Names <strong>of</strong><br />
No. <strong>of</strong> man days No. <strong>of</strong> beneficiaries No. <strong>of</strong> beneficiaries<br />
No. Villages SC ST Others Women Total SC ST Others Women Total SC ST Others Women Total<br />
1 Kharetha 0 43767 0 21883 43767 0 438 0 219 438 0 131 0 66 131<br />
2 Kund 0 6233 0 3117 6233 0 62 0 31 62 0 19 0 9 19<br />
3 Vandarveli 0 8367 0 4183 8367 0 84 0 42 84 0 25 0 13 25<br />
4 Valpor 0 29200 0 14600 29200 0 292 0 146 292 0 88 0 44 88<br />
5 Galiba 0 45500 0 22750 45500 0 455 0 228 455 0 137 0 68 137<br />
6 Fichvada 0 19267 0 9633 19267 0 193 0 96 193 0 58 0 29 58<br />
7 Rupghat 0 19633 0 9817 19633 0 196 0 98 196 0 59 0 29 59<br />
8 Sankoi 0 60367 0 30183 60367 0 604 0 302 604 0 181 0 91 181<br />
9 Varkhadi 0 25967 0 12983 25967 0 260 0 130 260 0 78 0 39 78<br />
6.1.2. Migration<br />
Project would decrease the 100 % migration by providing employment to the villagers.<br />
Table no. 52: Details <strong>of</strong> seasonal migration from Project area<br />
Sr. No. Names <strong>of</strong> villages No. <strong>of</strong> persons migrating No. <strong>of</strong> days per year <strong>of</strong> migration<br />
Pre-project Expected post project Pre-project Expected post project<br />
1 Kharetha 135 34 3 month 0<br />
2 Kund 15 0 3 month 0<br />
3 Vandarveli 25 0 3 month 0<br />
4 Valpor 90 0 3 month 0<br />
5 Galiba 135 34 3 month 0<br />
6 Fichvada 55 0 3 month 0<br />
7 Rupghat 60 0 3 month 0<br />
8 Sankoi 110 28 3 month 0<br />
9 Varkhadi 75 0 3 month 0<br />
West Forest Division- Rajpipla Page 108
6.1.3 Ground water table<br />
Due to the Moderate Slope / Hilly soil, ground water table is very low 40-45m. Proper soil and water conservation activities, ground<br />
water table would increase upto 37-40 m.<br />
Table no. 53: Details <strong>of</strong> average ground water table depth in the project areas (in meters)<br />
S. No. Name <strong>of</strong> Project Sources Pre-Project level<br />
Expected Increase/decrease (Post-<br />
Project)<br />
1 Sankoi (<strong>IWMP</strong>-1) Open wells 40 to 45 37 to 40<br />
6.1.4 Drinking water<br />
People use handpump, bore well and river for drinking purpose. These structures provide only 9-10 month water to the villagers<br />
regularly. But in the summer season, villagers face a lot <strong>of</strong> problem. Water quality is also not good. After the project, villagers can get all over the<br />
year drinking water near by house with good quality.<br />
Table no. 54: Status <strong>of</strong> Drinking water<br />
Sr. No.<br />
Names <strong>of</strong> Villages<br />
Availability <strong>of</strong> drinking water<br />
Quality <strong>of</strong> drinking water<br />
(no. <strong>of</strong> months in a year)<br />
Pre-project Expected Post project Pre-project Expected Post-project<br />
1 Sankoi (<strong>IWMP</strong>-1) 9 12 contaminated Pure<br />
West Forest Division- Rajpipla Page 109
6.1.5 Crops<br />
All agriculture activities are specially based on monsoon. In the Sankoi project, due to the Moderate Slope / Hilly land agriculture<br />
productivity <strong>of</strong> the crops is very less. Farmers don't use proper farming pattern in their field also. There is no irrigation facility for the<br />
cultivation <strong>of</strong> the crops which is directly affected <strong>of</strong> the crop yield. Due to the erosion (gully and rill), fertility <strong>of</strong> the land is low.<br />
Project would increase the productivity <strong>of</strong> the crops by proving proper irrigation facility to the farmers as well as the different training<br />
programmes for new farming technology by crop demonstration and distributing High yielding varieties seeds to the farmers. Fertility <strong>of</strong> the<br />
land would increase by using vermi-compost and proper cropping pattern in the land. Erosion would be decreased by constructing different soil<br />
and water conservation measures.<br />
Table no. 55: Details <strong>of</strong> Kharif crop area and yield in the project areas<br />
Name <strong>of</strong> village<br />
Name <strong>of</strong> crops<br />
Pre-project<br />
Expected Post -Project<br />
Area(ha) Average Yield per ha (qtl) Area(ha) Average Yield per ha (qtl)<br />
Kharetha<br />
Kund<br />
Kharif<br />
Tuvar 91 6.4 91 12<br />
Cotton 69 6.4 69 12.5<br />
Rice 28 5.6 28 11<br />
Village total 188 18.4 188 35.5<br />
Kharif<br />
Tuvar 23 6.4 23 10.4<br />
Cotton 11 6.4 11 11.2<br />
Rice 6 5.6 6 9<br />
Village total 40 18.4 40 30.6<br />
West Forest Division- Rajpipla Page 110
Vanderveli<br />
Valpor<br />
Galiba<br />
Fichwada<br />
Kharif<br />
Tuvar 27 7.2 27 11<br />
Cotton 9 7.2 9 11.5<br />
Rice 7 6.4 7 9.5<br />
Rabi<br />
Juvar 15 5.6 15 8.5<br />
Wheat 5 5.6 5 9.5<br />
Village total 63 32 63 50<br />
Kharif<br />
Tuvar 87 8 87 12<br />
Cotton 48 7.2 48 13.2<br />
Rice 31 6.4 31 9.5<br />
Juvar 5 6.4 5 11<br />
Wheat 1.75 5.6 1.75 9.5<br />
Village total 172.75 33.6 172.75 55.2<br />
Rabi<br />
Kharif<br />
Tuvar 104 7.2 104 11.5<br />
Cotton 78 7.2 78 12.3<br />
Rice 37 6.8 37 9.8<br />
Juvar 6 6.4 6 12<br />
Wheat 2 4.8 2 8.5<br />
Village total 227 32.4 227 54.1<br />
Rabi<br />
Kharif<br />
Tuvar 38 6.4 38 12<br />
Cotton 26 6.4 26 11.5<br />
Rice 15 6.4 15 11.7<br />
Village total 79 19.2 79 35.2<br />
West Forest Division- Rajpipla Page 111
Rupghat<br />
Sankoi<br />
Varkhadi<br />
Kharif<br />
Tuvar 167 8 167 15<br />
Cotton 105 8 105 14.9<br />
Rice 69 7.2 69 13.9<br />
Rabi<br />
Juvar 6 6.4 6 9.5<br />
Wheat 1 6.4 1 11<br />
Zaid NA NA<br />
Village total 342 20 342 34.4<br />
Kharif<br />
Tuvar 35 6.4 35 12<br />
Cotton 24 7.2 24 13<br />
Rice 14 6.4 14 12<br />
Village total 73 20 73 37<br />
Kharif<br />
Tuvar 109 7.2 109 14<br />
Cotton 56 6.4 56 11.5<br />
Rice 25 6.8 25 11<br />
Rabi<br />
Juvar 1.5 4.8 1.5 8.5<br />
Wheat 0.5 4.8 0.5 8.5<br />
Zaid NA NA<br />
Village total 192 30 192 53.5<br />
West Forest Division- Rajpipla Page 112
Table no. 56: Area under horticulture<br />
Sr. No.<br />
Name <strong>of</strong> Village<br />
Existing area under horticulture<br />
(ha)<br />
Area under horticulture proposed to be<br />
covered through <strong>IWMP</strong><br />
1 Kharetha 2.00 6.25<br />
2 Kund 0.50 3.90<br />
3 Vandarveli 1.50 6.45<br />
4 Valpor 1.00 3.75<br />
5 Galiba 3.98 14.33<br />
6 Fichvada 1.00 3.95<br />
7 Rupghat 3.30 9.38<br />
8 Sankoi 4.96 15.04<br />
9 Varkhadi 1.00 3.83<br />
Total 19.24 66.88<br />
6.1.7 Vegetative cover<br />
Project covers about 50% area under vegetative cover. In the project area nilgiri, bamboo, subabool,neem, tik and mahua can be seen<br />
anywhere. Project would cover 3661.01 ha area through farm forestry, fuel and timber plantation and fruit tree plantation.<br />
Table no. 57: Forest/vegetative cover<br />
Sr. No. Name <strong>of</strong> Village Existing area under tree cover (ha) Area under tree cover proposed<br />
1 Kharetha 450 47.50<br />
2 Kund 140 26.10<br />
3 Vandarveli 259 48.10<br />
4 Valpor 95 36.70<br />
5 Galiba 595.12 77.90<br />
6 Fichvada 200.55 58.90<br />
7 Rupghat 50.68 47.10<br />
8 Sankoi 114.33 82.00<br />
9 Varkhadi 70.89 38.40<br />
Total 1975.57 462.70<br />
West Forest Division- Rajpipla Page 113
6.1.8 Livestock<br />
Project area covers milch animal like cow and buffaloes, drought animals, small ruminants and hens. Different activities like providing<br />
good quality cows and buffaloes, goat unit, poultry farming, provide fodder by establishment <strong>of</strong> fodder bank, veterinary services etc. It is<br />
expected that the post project period would see a substantial increase in livestock population and yield from them.<br />
Table no. 58: Details <strong>of</strong> livestock in the project areas (for fluids please mention in litres, for solids please mention in kgs. and<br />
income in Rs.)<br />
S. No. Name <strong>of</strong> Village Type <strong>of</strong> Animal<br />
Milch-animals<br />
Pre-Project<br />
Expected Post-project<br />
No. Yield Income No. Yield Income<br />
Remarks<br />
Cow (per animal/day) 185 2 16 222 3.5 20<br />
1 Kharetha<br />
Buffalo(per animal/day) 45 3 20 54 5 25<br />
Draught Purpose animals<br />
NA<br />
Animals for other purpose<br />
Goat 150 180 180 180<br />
Hen 27 120 33 120<br />
Milch-animals<br />
Cow (per animal/day) 40 2 16 48 3.5 20<br />
Buffalo(per animal/day) 20 3 20 24 5 25<br />
2 Kund<br />
Draught Purpose animals<br />
Animals for other purpose<br />
NA<br />
Goat 35 180 42 180<br />
Hen 25 120 30 120<br />
West Forest Division- Rajpipla Page 114
Milch-animals<br />
Cow (per animal/day) 35 2 16 42 3.5 20<br />
Buffalo(per animal/day) 25 3 20 30 5 25<br />
3 Vanderveli<br />
Draught Purpose animals<br />
NA<br />
Animals for other purpose<br />
Goat 55 180 66 180<br />
Hen 70 120 84 120<br />
Milch-animals<br />
Cow (per animal/day) 80 2 16 96 3.5 20<br />
Buffalo(per animal/day) 90 3 20 108 5 25<br />
4 Valpor<br />
Draught Purpose animals<br />
NA<br />
Animals for other purpose<br />
Goat 62 180 75 180<br />
Hen 75 120 90 120<br />
Milch-animals<br />
Cow (per animal/day) 120 2 16 144 3.5 20<br />
Buffalo(per animal/day) 106 3 20 128 5 25<br />
5 Galiba<br />
Draught Purpose animals<br />
NA<br />
Animals for other purpose<br />
Goat 115 180 138 180<br />
Hen 100 120 120 120<br />
West Forest Division- Rajpipla Page 115
Milch-animals<br />
Cow (per animal/day) 45 2 16 54 3.5 20<br />
Buffalo(per animal/day) 53 3 20 64 5 25<br />
6 Fichwada<br />
Draught Purpose animals<br />
Animals for other purpose<br />
NA<br />
Goat 80 180 96 180<br />
Hen 85 120 102 120<br />
Milch-animals<br />
Cow (per animal/day) 50 2 16 60 3.5 20<br />
Buffalo(per animal/day) 34 3 20 41 5 25<br />
7 Rupghat<br />
Draught Purpose animals<br />
Animals for other purpose<br />
NA<br />
Goat 50 180 60 180<br />
Hen 102 120 123 120<br />
Milch-animals<br />
Cow (per animal/day) 60 2 16 72 3.5 20<br />
Buffalo(per animal/day) 30 3 20 36 5 25<br />
8 Sankoi<br />
Draught Purpose animals<br />
Animals for other purpose<br />
NA<br />
Goat 70 180 84 180<br />
Hen 79 120 95 120<br />
West Forest Division- Rajpipla Page 116
Milch-animals<br />
Cow (per animal/day) 90 2 16 108 3.5 20<br />
Buffalo(per animal/day) 45 3 20 54 5 25<br />
9 Varkhadi<br />
Draught Purpose animals<br />
NA<br />
Animals for other purpose<br />
Goat 90 180 108 180<br />
Hen 57 120 69 120<br />
West Forest Division- Rajpipla Page 117
6.1.9 Linkages<br />
The direct livelihood activities need good forward and backward support. Without such support system the activities may fail to deliver<br />
the desired results. These linkages would involve credit, machinery, input supply, marketing, etc.<br />
Table no. 59: Backward-Forward linkages<br />
S. No. Project Type <strong>of</strong> Marketing Facility<br />
Pre-project<br />
(no.)<br />
During the project (no.) Post-project (no.)<br />
Backward linkages<br />
Seed certification<br />
Seed supply system 1 1<br />
Fertilizer supply system 1 1<br />
Pesticide supply system 1 1<br />
Credit institutions Bank Bank<br />
1<br />
<strong>IWMP</strong> -II<br />
Vasana<br />
Water supply<br />
Extension services<br />
KVK Chaswad,Akrsp - KVK Chaswad,Akrsp -<br />
Netrang<br />
Netrang<br />
Nurseries 1 1<br />
Tools/machinery suppliers 1 1<br />
Price Support system<br />
Labour<br />
Any other (please specify)<br />
Forward linkages<br />
Harvesting/threshing machinery 1 1<br />
Storage (including cold storage)<br />
Y<br />
Road network<br />
Y<br />
Transport facilities<br />
Y<br />
Markets / Mandis<br />
Y<br />
Agro and other Industries<br />
Milk and other collection centres Y 1<br />
Labour<br />
Any other (please specify) Vermi compost unit Vermi compost unit<br />
West Forest Division- Rajpipla Page 118
Logical Framework Analysis<br />
Components Activities Outputs Effect<br />
Village<br />
Institution<br />
Formation<br />
Formation <strong>of</strong> Watershed<br />
Committee, User Group and SHGs<br />
One Watershed Committee in each<br />
village<br />
Project can be implemented and<br />
managed in a democratic and<br />
participatory way ensuring equity.<br />
Number <strong>of</strong> User groups depending on<br />
Strengthening<br />
Village<br />
Institutions<br />
Organize training and awareness<br />
programme for Village institutions<br />
Capacity building workshops and<br />
exposure visits User Group, SHGs<br />
and Watershed Committee<br />
Facilitating and monitoring the<br />
functioning <strong>of</strong> UGs and WCs<br />
Strengthen linkages between UGs<br />
and WCs and Panchayat<br />
Institutions.<br />
Gender sensitization in WC, UGs,<br />
SHGs.<br />
the coverage <strong>of</strong> particular intervention<br />
Awareness camps to be organized.<br />
Trainings and exposure visits UGs and<br />
WCs to be held<br />
Capacity building workshops to be<br />
organized<br />
Quality management <strong>of</strong> common<br />
resources will improve.<br />
Quality product among people will be<br />
improved.<br />
Increased awareness amongst women<br />
about village resources.<br />
Fund<br />
Management<br />
Sensitise village communities to<br />
involve children and youth in<br />
development.<br />
Improve management and<br />
utilisation <strong>of</strong> UGs, SHGs and WCs.<br />
Prepare communities to explore<br />
other sources <strong>of</strong> income for UGs,<br />
SHGs and others.<br />
Involvement <strong>of</strong> youth and children in<br />
village development work.<br />
UGs, SHGs and WCs operating bank<br />
account and managing resources on<br />
their own<br />
Women participation enhanced in<br />
decision-making <strong>of</strong> GVCs.<br />
Purpose, frequency and volume <strong>of</strong> use<br />
<strong>of</strong> the fund enhanced.<br />
Volume <strong>of</strong> funds generated for UGs,<br />
SHGs and WCs from other sources <strong>of</strong><br />
income increased.<br />
West Forest Division- Rajpipla Page 119
Ecological<br />
Restoration<br />
Rainfed Area<br />
<strong>Development</strong><br />
Protection, treatment and<br />
regeneration <strong>of</strong> common and<br />
private resources.<br />
Plantation <strong>of</strong> fruits and forest<br />
species<br />
Treatment <strong>of</strong> land through<br />
improved soil and moisture<br />
conservation practices on<br />
watershed basis<br />
Construct water harvesting<br />
structures for conserving water on<br />
rainy season.<br />
Promotion <strong>of</strong> good agricultural<br />
practices- horticulture, improved<br />
crop and vegetable<br />
Common and private lands to be<br />
brought under new plantations and<br />
agro-horti-forestry like Neem, Babool,<br />
Drum stick, Mahua, Mango and Sapota<br />
etc.<br />
Trainings, exposure visits and meetings<br />
to be organized for communities, village<br />
volunteers and staff<br />
Land to be brought under improved soil<br />
moisture conservation practices<br />
Water can be conserve for a long time.<br />
Good agricultural practices to be<br />
promoted.<br />
Fodder availability from common and<br />
private lands increased.<br />
Money saving from purchasing <strong>of</strong><br />
Domestic products.<br />
Other micro-enterprise activities can<br />
be used at domestic level.<br />
Improved productivity <strong>of</strong> treated land<br />
Increased availability <strong>of</strong> water in wells,<br />
pond and checkdam.<br />
Increase in annual agriculture<br />
production<br />
Promotion <strong>of</strong> organic farming<br />
practices<br />
Organic farming to be promoted<br />
Farmers adopt organic farming<br />
practices.<br />
Formation <strong>of</strong> Fodder banks to<br />
increase fodder security and<br />
promote dairy development among<br />
communities<br />
Identification and promotion <strong>of</strong><br />
agri-produce based income<br />
generation activities like grading,<br />
processing and packaging.<br />
Fodder banks to be established<br />
Agriculture based livelihood income<br />
generation activities to be promoted<br />
Use <strong>of</strong> domestic product properly<br />
Fodder security <strong>of</strong> farmers enhanced.<br />
West Forest Division- Rajpipla Page 120
Promotion <strong>of</strong> better Irrigation<br />
practices like drip irrigation<br />
Water harvesting structures to be<br />
constructed.<br />
Increase availability <strong>of</strong> water for 12<br />
months<br />
Drip and Lift irrigation facilities to be<br />
distributed among farmers<br />
Increased availability <strong>of</strong> water for<br />
livestock<br />
Availability <strong>of</strong> irrigation water<br />
established<br />
Farmers take two or three crops in a<br />
year<br />
Increase in agricultural productivity <strong>of</strong><br />
land<br />
Availability <strong>of</strong> drinking water<br />
enhanced<br />
Women’s Sociopolitical<br />
and<br />
economic<br />
empowerment<br />
Impart trainings, conduct meetings<br />
and organise exposure visits <strong>of</strong><br />
communities, village volunteers and<br />
staff to effectively plan, execute and<br />
monitor activities<br />
Formation & Strengthening <strong>of</strong><br />
women’s SHG groups<br />
Capacity building <strong>of</strong> womenfolk<br />
Linking SHGs with external financial<br />
institutions<br />
Trainings, exposure visits and meetings<br />
to be organized for communities, village<br />
volunteers and staff<br />
Women’s SHG groups to be formed<br />
Federation <strong>of</strong> Women’s SHGs to be<br />
formed<br />
Enhanced capacities <strong>of</strong> leaders <strong>of</strong><br />
women's group in taking initiatives to<br />
solve problems at different levels.<br />
Increased household income.<br />
West Forest Division- Rajpipla Page 121
CHAPTER -7<br />
QUALITY AND SUSTAINABILITY ISSUES<br />
6. Quality and Sustainability Issues<br />
7.1 Plans for Monitoring and Evaluation<br />
A Web-based GIS System is being developed for monitoring and evaluating the project in its planning & implementation phases. The<br />
system would be available on a public domain and can be accessed by all the stakeholders <strong>of</strong> the project. The system shows the entire state <strong>of</strong><br />
<strong>Gujarat</strong> and all <strong>of</strong> those areas selected over the next 18 years. Filtering allows the user to zoom onto one particular project. Details related to soil<br />
type, Land-use classification, inhabitation etc., can be obtained village-wise. Furthermore, survey-number wise details related to ownership,<br />
irrigation source, yield etc., can also be accessed by the users <strong>of</strong> the system. This system is being used for pooling up the details obtained from<br />
the DPR. In other words, the DPR is made available online in the form <strong>of</strong> a database which will help the stakeholders know areas <strong>of</strong> importance<br />
viz., already treated areas/historical works in the area, proposed areas for treatment etc., for further treatment and planning. The system would<br />
also show the satellite imageries <strong>of</strong> various years from the project inception stage to the project closing stages. This allows the user to evaluate<br />
the effectiveness <strong>of</strong> the treatment and thereby plan corrective measures for the project area. The system would serve as an aiding tool to the<br />
planners and evaluators for judging the efficacy <strong>of</strong> the project.<br />
Yet another component <strong>of</strong> the Web-based GIS system is the Mobile based Monitoring & Evaluation System, which will help the ground<br />
staff alias WDTs (Watershed <strong>Development</strong> Team) to transmit information from the ground level to the central server. Also, any higher-up<br />
<strong>of</strong>ficial in charge <strong>of</strong> the project can obtain information regarding the project area on their mobile phone by means <strong>of</strong> an SMS. The system works<br />
West Forest Division- Rajpipla Page 122
in the following manner. The WDT equipped with a GPS instrument marks the latitude-longitude information <strong>of</strong> various treatment areas during<br />
the DPR. The probable sites are then transferred onto the central server. During the works phase, any progress in the treatment areas is<br />
reported to the server by means <strong>of</strong> an SMS by the WDT. Similarly, any nodal <strong>of</strong>ficer or higher-up <strong>of</strong>ficial can view the progress in a project by<br />
means <strong>of</strong> summarized reports generated over frequent periods <strong>of</strong> time.<br />
7.2 Plans for Project management:<br />
The Project management <strong>of</strong> any watershed programme is very important. It mainly depends upon the community organisation and the<br />
village level institutes. In Sankoi project, watershed committee, various user groups and SHGs have been formulated for post project operation<br />
and maintenance <strong>of</strong> assets created during project period. Major emphasis will be on equity and sustainable benefit <strong>of</strong> the project even after<br />
implementation stage. A proper link-up will be built during project period with various institutes and capacity building organisation. They will<br />
act as a major kingpin during post implementation for scaling up the successful experience during project.<br />
7.3 Watershed <strong>Development</strong> Fund:<br />
The major source <strong>of</strong> financial assistance after post implementation period is watershed <strong>Development</strong> Fund. The contribution <strong>of</strong> it will<br />
comes mainly fund the following:<br />
7.4 User Charges:<br />
Various user groups will be formed in village. These user groups will collect user charges according to the designated rules formed<br />
during the formation <strong>of</strong> user group. These funds will be transferred to the WDF funds as per these formulated rules. The secretary <strong>of</strong> watershed<br />
committee (WC) shall maintain the records <strong>of</strong> the following.<br />
West Forest Division- Rajpipla Page 123
Figure-8.1: Ground water map<br />
Chapter-8<br />
Map<br />
West Forest Division- Rajpipla Page 124
Figure-8.2: Land use map<br />
West Forest Division- Rajpipla Page 125
Figure-8.3: River water body map<br />
West Forest Division- Rajpipla Page 126
Figure-8.4: Slope map<br />
West Forest Division- Rajpipla Page 127
Figure-8.5: Soil map<br />
West Forest Division- Rajpipla Page 128
Figure-8.6: Geomorphology map<br />
West Forest Division- Rajpipla Page 129
Figure-8.7: Baseline map<br />
West Forest Division- Rajpipla Page 130
Figure-8.8: Action plan map<br />
West Forest Division- Rajpipla Page 131
West Forest Division- Rajpipla Page 132
West Forest Division- Rajpipla Page 133
West Forest Division- Rajpipla Page 134
West Forest Division- Rajpipla Page 135
West Forest Division- Rajpipla Page 136
West Forest Division- Rajpipla Page 137
West Forest Division- Rajpipla Page 138