RACING AND WAGERING WESTERN AUSTRALIA - RWWA Home
RACING AND WAGERING WESTERN AUSTRALIA - RWWA Home
RACING AND WAGERING WESTERN AUSTRALIA - RWWA Home

Create successful ePaper yourself
Turn your PDF publications into a flip-book with our unique Google optimized e-Paper software.
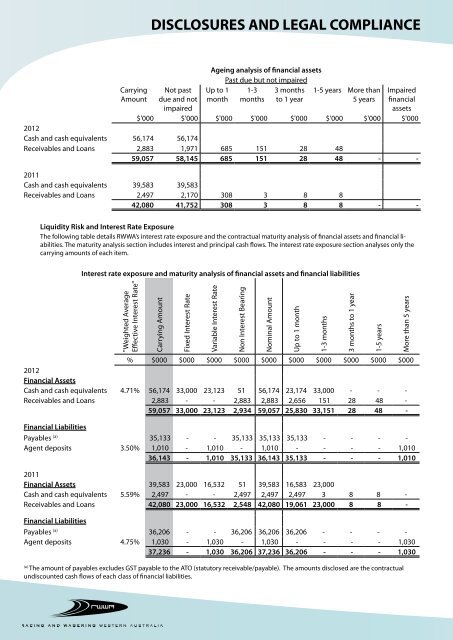
DISCLOSURES <strong>AND</strong> LEGAL COMPLIANCE<br />
Carrying<br />
Amount<br />
Ageing analysis of financial assets<br />
Past due but not impaired<br />
Up to 1 1-3 3 months 1-5 years More than<br />
month months to 1 year<br />
5 years<br />
Not past<br />
due and not<br />
impaired<br />
Impaired<br />
financial<br />
assets<br />
$'000 $'000 $'000 $'000 $'000 $'000 $'000 $'000<br />
2012<br />
Cash and cash equivalents 56,174 56,174<br />
Receivables and Loans 2,883 1,971 685 151 28 48<br />
59,057 58,145 685 151 28 48 - -<br />
2011<br />
Cash and cash equivalents 39,583 39,583<br />
Receivables and Loans 2,497 2,170 308 3 8 8<br />
42,080 41,752 308 3 8 8 - -<br />
Liquidity Risk and Interest Rate Exposure<br />
The following table details <strong>RWWA</strong>’s interest rate exposure and the contractual maturity analysis of financial assets and financial liabilities.<br />
The maturity analysis section includes interest and principal cash flows. The interest rate exposure section analyses only the<br />
carrying amounts of each item.<br />
Interest rate exposure and maturity analysis of financial assets and financial liabilities<br />
"Weighted Average<br />
Effective Interest Rate"<br />
Carrying Amount<br />
Fixed Interest Rate<br />
Variable Interest Rate<br />
% $000 $000 $000 $000 $000 $000 $000 $000 $000 $000<br />
2012<br />
Financial Assets<br />
Cash and cash equivalents 4.71% 56,174 33,000 23,123 51 56,174 23,174 33,000 - - -<br />
Receivables and Loans 2,883 - - 2,883 2,883 2,656 151 28 48 -<br />
59,057 33,000 23,123 2,934 59,057 25,830 33,151 28 48 -<br />
Non Interest Bearing<br />
Nominal Amount<br />
Up to 1 month<br />
1-3 months<br />
3 months to 1 year<br />
1-5 years<br />
More than 5 years<br />
Financial Liabilities<br />
Payables (a) 35,133 - - 35,133 35,133 35,133 - - - -<br />
Agent deposits 3.50% 1,010 - 1,010 - 1,010 - - - - 1,010<br />
36,143 - 1,010 35,133 36,143 35,133 - - - 1,010<br />
2011<br />
Financial Assets 39,583 23,000 16,532 51 39,583 16,583 23,000<br />
Cash and cash equivalents 5.59% 2,497 - - 2,497 2,497 2,497 3 8 8 -<br />
Receivables and Loans 42,080 23,000 16,532 2,548 42,080 19,061 23,000 8 8 -<br />
Financial Liabilities<br />
Payables (a) 36,206 - - 36,206 36,206 36,206 - - - -<br />
Agent deposits 4.75% 1,030 - 1,030 - 1,030 - - - - 1,030<br />
37,236 - 1,030 36,206 37,236 36,206 - - - 1,030<br />
(a)<br />
The amount of payables excludes GST payable to the ATO (statutory receivable/payable). The amounts disclosed are the contractual<br />
undiscounted cash flows of each class of financial liabilities.