

the Mpingo Conservation Project - Coastal Forests of Kenya and ...
the Mpingo Conservation Project - Coastal Forests of Kenya and ...
the Mpingo Conservation Project - Coastal Forests of Kenya and ...

You also want an ePaper? Increase the reach of your titles
YUMPU automatically turns print PDFs into web optimized ePapers that Google loves.
The <strong>Mpingo</strong> <strong>Conservation</strong> <strong>Project</strong><br />
Final Draft<br />
<strong>Mpingo</strong> Survey 2000 Full Report<br />
Results<br />
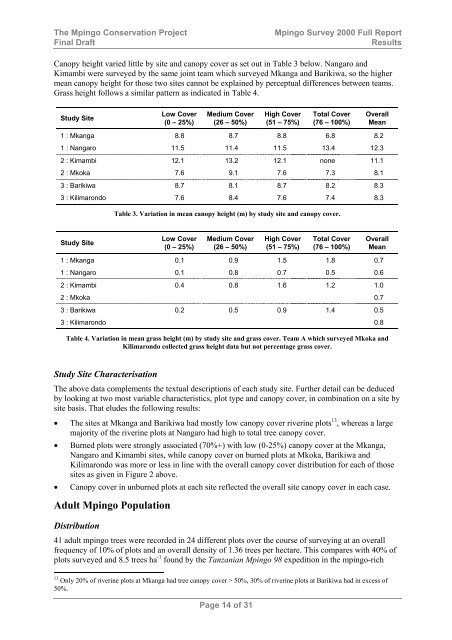
Canopy height varied little by site <strong>and</strong> canopy cover as set out in Table 3 below. Nangaro <strong>and</strong><br />
Kimambi were surveyed by <strong>the</strong> same joint team which surveyed Mkanga <strong>and</strong> Barikiwa, so <strong>the</strong> higher<br />
mean canopy height for those two sites cannot be explained by perceptual differences between teams.<br />
Grass height follows a similar pattern as indicated in Table 4.<br />
Study Site<br />
Low Cover<br />
(0 – 25%)<br />
Medium Cover<br />
(26 – 50%)<br />
High Cover<br />
(51 – 75%)<br />
Total Cover<br />
(76 – 100%)<br />
Overall<br />
Mean<br />
1 : Mkanga 8.8 8.7 8.8 6.8 8.2<br />
1 : Nangaro 11.5 11.4 11.5 13.4 12.3<br />
2 : Kimambi 12.1 13.2 12.1 none 11.1<br />
2 : Mkoka 7.6 9.1 7.6 7.3 8.1<br />
3 : Barikiwa 8.7 8.1 8.7 8.2 8.3<br />
3 : Kilimarondo 7.6 8.4 7.6 7.4 8.3<br />
Table 3. Variation in mean canopy height (m) by study site <strong>and</strong> canopy cover.<br />
Study Site<br />
Low Cover<br />
(0 – 25%)<br />
Medium Cover<br />
(26 – 50%)<br />
High Cover<br />
(51 – 75%)<br />
Total Cover<br />
(76 – 100%)<br />
Overall<br />
Mean<br />
1 : Mkanga 0.1 0.9 1.5 1.8 0.7<br />
1 : Nangaro 0.1 0.8 0.7 0.5 0.6<br />
2 : Kimambi 0.4 0.8 1.6 1.2 1.0<br />
2 : Mkoka 0.7<br />
3 : Barikiwa 0.2 0.5 0.9 1.4 0.5<br />
3 : Kilimarondo 0.8<br />
Table 4. Variation in mean grass height (m) by study site <strong>and</strong> grass cover. Team A which surveyed Mkoka <strong>and</strong><br />
Kilimarondo collected grass height data but not percentage grass cover.<br />
Study Site Characterisation<br />
The above data complements <strong>the</strong> textual descriptions <strong>of</strong> each study site. Fur<strong>the</strong>r detail can be deduced<br />
by looking at two most variable characteristics, plot type <strong>and</strong> canopy cover, in combination on a site by<br />
site basis. That eludes <strong>the</strong> following results:<br />
• The sites at Mkanga <strong>and</strong> Barikiwa had mostly low canopy cover riverine plots 13 , whereas a large<br />
majority <strong>of</strong> <strong>the</strong> riverine plots at Nangaro had high to total tree canopy cover.<br />
• Burned plots were strongly associated (70%+) with low (0-25%) canopy cover at <strong>the</strong> Mkanga,<br />
Nangaro <strong>and</strong> Kimambi sites, while canopy cover on burned plots at Mkoka, Barikiwa <strong>and</strong><br />
Kilimarondo was more or less in line with <strong>the</strong> overall canopy cover distribution for each <strong>of</strong> those<br />
sites as given in Figure 2 above.<br />
• Canopy cover in unburned plots at each site reflected <strong>the</strong> overall site canopy cover in each case.<br />
Adult <strong>Mpingo</strong> Population<br />
Distribution<br />
41 adult mpingo trees were recorded in 24 different plots over <strong>the</strong> course <strong>of</strong> surveying at an overall<br />
frequency <strong>of</strong> 10% <strong>of</strong> plots <strong>and</strong> an overall density <strong>of</strong> 1.36 trees per hectare. This compares with 40% <strong>of</strong><br />
plots surveyed <strong>and</strong> 8.5 trees ha -1 found by <strong>the</strong> Tanzanian <strong>Mpingo</strong> 98 expedition in <strong>the</strong> mpingo-rich<br />
13 Only 20% <strong>of</strong> riverine plots at Mkanga had tree canopy cover > 50%, 30% <strong>of</strong> riverine plots at Barikiwa had in excess <strong>of</strong><br />
50%.<br />
Page 14 <strong>of</strong> 31


