

the Mpingo Conservation Project - Coastal Forests of Kenya and ...
the Mpingo Conservation Project - Coastal Forests of Kenya and ...
the Mpingo Conservation Project - Coastal Forests of Kenya and ...

You also want an ePaper? Increase the reach of your titles
YUMPU automatically turns print PDFs into web optimized ePapers that Google loves.
The <strong>Mpingo</strong> <strong>Conservation</strong> <strong>Project</strong><br />
Final Draft<br />
<strong>Mpingo</strong> Survey 2000 Full Report<br />
Results<br />
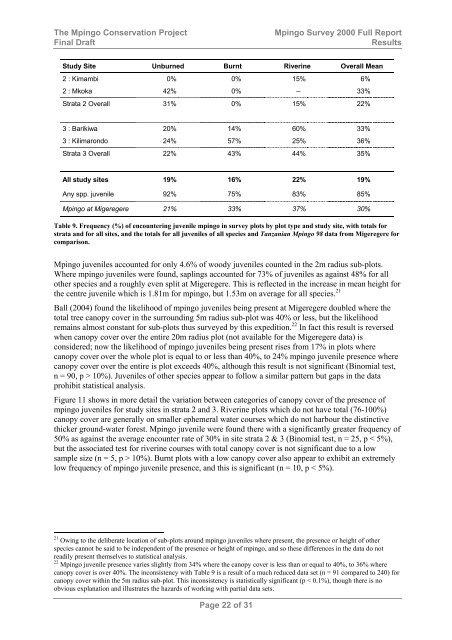
Study Site Unburned Burnt Riverine Overall Mean<br />
2 : Kimambi 0% 0% 15% 6%<br />
2 : Mkoka 42% 0% – 33%<br />
Strata 2 Overall 31% 0% 15% 22%<br />
3 : Barikiwa 20% 14% 60% 33%<br />
3 : Kilimarondo 24% 57% 25% 36%<br />
Strata 3 Overall 22% 43% 44% 35%<br />
All study sites 19% 16% 22% 19%<br />
Any spp. juvenile 92% 75% 83% 85%<br />
<strong>Mpingo</strong> at Migeregere 21% 33% 37% 30%<br />
Table 9. Frequency (%) <strong>of</strong> encountering juvenile mpingo in survey plots by plot type <strong>and</strong> study site, with totals for<br />
strata <strong>and</strong> for all sites, <strong>and</strong> <strong>the</strong> totals for all juveniles <strong>of</strong> all species <strong>and</strong> Tanzanian <strong>Mpingo</strong> 98 data from Migeregere for<br />
comparison.<br />
<strong>Mpingo</strong> juveniles accounted for only 4.6% <strong>of</strong> woody juveniles counted in <strong>the</strong> 2m radius sub-plots.<br />
Where mpingo juveniles were found, saplings accounted for 73% <strong>of</strong> juveniles as against 48% for all<br />
o<strong>the</strong>r species <strong>and</strong> a roughly even split at Migeregere. This is reflected in <strong>the</strong> increase in mean height for<br />
<strong>the</strong> centre juvenile which is 1.81m for mpingo, but 1.53m on average for all species. 21<br />
Ball (2004) found <strong>the</strong> likelihood <strong>of</strong> mpingo juveniles being present at Migeregere doubled where <strong>the</strong><br />
total tree canopy cover in <strong>the</strong> surrounding 5m radius sub-plot was 40% or less, but <strong>the</strong> likelihood<br />
remains almost constant for sub-plots thus surveyed by this expedition. 22 In fact this result is reversed<br />
when canopy cover over <strong>the</strong> entire 20m radius plot (not available for <strong>the</strong> Migeregere data) is<br />
considered; now <strong>the</strong> likelihood <strong>of</strong> mpingo juveniles being present rises from 17% in plots where<br />
canopy cover over <strong>the</strong> whole plot is equal to or less than 40%, to 24% mpingo juvenile presence where<br />
canopy cover over <strong>the</strong> entire is plot exceeds 40%, although this result is not significant (Binomial test,<br />
n = 90, p > 10%). Juveniles <strong>of</strong> o<strong>the</strong>r species appear to follow a similar pattern but gaps in <strong>the</strong> data<br />
prohibit statistical analysis.<br />
Figure 11 shows in more detail <strong>the</strong> variation between categories <strong>of</strong> canopy cover <strong>of</strong> <strong>the</strong> presence <strong>of</strong><br />
mpingo juveniles for study sites in strata 2 <strong>and</strong> 3. Riverine plots which do not have total (76-100%)<br />
canopy cover are generally on smaller ephemeral water courses which do not harbour <strong>the</strong> distinctive<br />
thicker ground-water forest. <strong>Mpingo</strong> juvenile were found <strong>the</strong>re with a significantly greater frequency <strong>of</strong><br />
50% as against <strong>the</strong> average encounter rate <strong>of</strong> 30% in site strata 2 & 3 (Binomial test, n = 25, p < 5%),<br />
but <strong>the</strong> associated test for riverine courses with total canopy cover is not significant due to a low<br />
sample size (n = 5, p > 10%). Burnt plots with a low canopy cover also appear to exhibit an extremely<br />
low frequency <strong>of</strong> mpingo juvenile presence, <strong>and</strong> this is significant (n = 10, p < 5%).<br />
21 Owing to <strong>the</strong> deliberate location <strong>of</strong> sub-plots around mpingo juveniles where present, <strong>the</strong> presence or height <strong>of</strong> o<strong>the</strong>r<br />
species cannot be said to be independent <strong>of</strong> <strong>the</strong> presence or height <strong>of</strong> mpingo, <strong>and</strong> so <strong>the</strong>se differences in <strong>the</strong> data do not<br />
readily present <strong>the</strong>mselves to statistical analysis.<br />
22 <strong>Mpingo</strong> juvenile presence varies slightly from 34% where <strong>the</strong> canopy cover is less than or equal to 40%, to 36% where<br />
canopy cover is over 40%. The inconsistency with Table 9 is a result <strong>of</strong> a much reduced data set (n = 91 compared to 240) for<br />
canopy cover within <strong>the</strong> 5m radius sub-plot. This inconsistency is statistically significant (p < 0.1%), though <strong>the</strong>re is no<br />
obvious explanation <strong>and</strong> illustrates <strong>the</strong> hazards <strong>of</strong> working with partial data sets.<br />
Page 22 <strong>of</strong> 31


