

the Mpingo Conservation Project - Coastal Forests of Kenya and ...
the Mpingo Conservation Project - Coastal Forests of Kenya and ...
the Mpingo Conservation Project - Coastal Forests of Kenya and ...

Create successful ePaper yourself
Turn your PDF publications into a flip-book with our unique Google optimized e-Paper software.
The <strong>Mpingo</strong> <strong>Conservation</strong> <strong>Project</strong><br />
Final Draft<br />
<strong>Mpingo</strong> Survey 2000 Full Report<br />
Results<br />
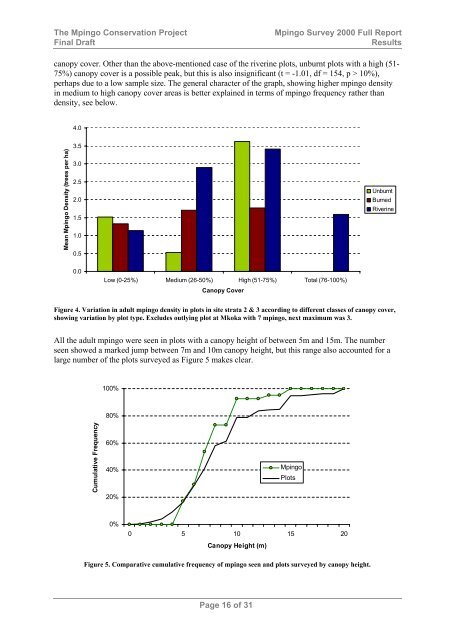
canopy cover. O<strong>the</strong>r than <strong>the</strong> above-mentioned case <strong>of</strong> <strong>the</strong> riverine plots, unburnt plots with a high (51-<br />
75%) canopy cover is a possible peak, but this is also insignificant (t = -1.01, df = 154, p > 10%),<br />
perhaps due to a low sample size. The general character <strong>of</strong> <strong>the</strong> graph, showing higher mpingo density<br />
in medium to high canopy cover areas is better explained in terms <strong>of</strong> mpingo frequency ra<strong>the</strong>r than<br />
density, see below.<br />
4.0<br />
Mean <strong>Mpingo</strong> Density (trees per ha)<br />
3.5<br />
3.0<br />
2.5<br />
2.0<br />
1.5<br />
1.0<br />
0.5<br />
Unburnt<br />
Burned<br />
Riverine<br />
0.0<br />
Low (0-25%) Medium (26-50%) High (51-75%) Total (76-100%)<br />
Canopy Cover<br />
Figure 4. Variation in adult mpingo density in plots in site strata 2 & 3 according to different classes <strong>of</strong> canopy cover,<br />
showing variation by plot type. Excludes outlying plot at Mkoka with 7 mpingo, next maximum was 3.<br />
All <strong>the</strong> adult mpingo were seen in plots with a canopy height <strong>of</strong> between 5m <strong>and</strong> 15m. The number<br />
seen showed a marked jump between 7m <strong>and</strong> 10m canopy height, but this range also accounted for a<br />
large number <strong>of</strong> <strong>the</strong> plots surveyed as Figure 5 makes clear.<br />
100%<br />
80%<br />
Cumulative Frequency<br />
60%<br />
40%<br />
20%<br />
<strong>Mpingo</strong><br />
Plots<br />
0%<br />
0 5 10 15 20<br />
Canopy Height (m)<br />
Figure 5. Comparative cumulative frequency <strong>of</strong> mpingo seen <strong>and</strong> plots surveyed by canopy height.<br />
Page 16 <strong>of</strong> 31


