

the Mpingo Conservation Project - Coastal Forests of Kenya and ...
the Mpingo Conservation Project - Coastal Forests of Kenya and ...
the Mpingo Conservation Project - Coastal Forests of Kenya and ...

Create successful ePaper yourself
Turn your PDF publications into a flip-book with our unique Google optimized e-Paper software.
The <strong>Mpingo</strong> <strong>Conservation</strong> <strong>Project</strong><br />
Final Draft<br />
<strong>Mpingo</strong> Survey 2000 Full Report<br />
Results<br />
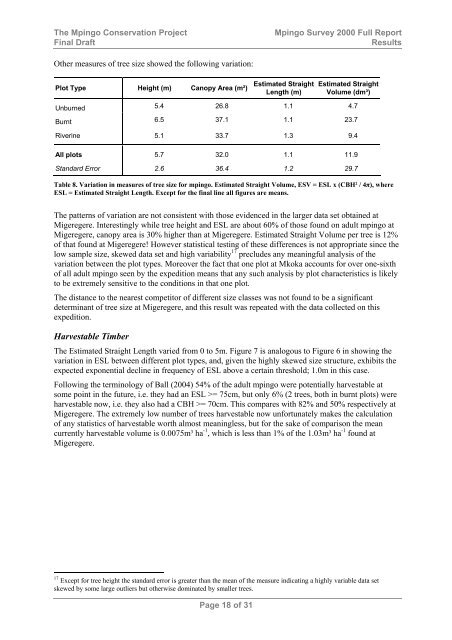
O<strong>the</strong>r measures <strong>of</strong> tree size showed <strong>the</strong> following variation:<br />
Plot Type Height (m) Canopy Area (m²)<br />
Estimated Straight<br />
Length (m)<br />
Estimated Straight<br />
Volume (dm³)<br />
Unburned 5.4 26.8 1.1 4.7<br />
Burnt 6.5 37.1 1.1 23.7<br />
Riverine 5.1 33.7 1.3 9.4<br />
All plots 5.7 32.0 1.1 11.9<br />
St<strong>and</strong>ard Error 2.6 36.4 1.2 29.7<br />
Table 8. Variation in measures <strong>of</strong> tree size for mpingo. Estimated Straight Volume, ESV = ESL x (CBH² / 4π), where<br />
ESL = Estimated Straight Length. Except for <strong>the</strong> final line all figures are means.<br />
The patterns <strong>of</strong> variation are not consistent with those evidenced in <strong>the</strong> larger data set obtained at<br />
Migeregere. Interestingly while tree height <strong>and</strong> ESL are about 60% <strong>of</strong> those found on adult mpingo at<br />
Migeregere, canopy area is 30% higher than at Migeregere. Estimated Straight Volume per tree is 12%<br />
<strong>of</strong> that found at Migeregere! However statistical testing <strong>of</strong> <strong>the</strong>se differences is not appropriate since <strong>the</strong><br />
low sample size, skewed data set <strong>and</strong> high variability 17 precludes any meaningful analysis <strong>of</strong> <strong>the</strong><br />
variation between <strong>the</strong> plot types. Moreover <strong>the</strong> fact that one plot at Mkoka accounts for over one-sixth<br />
<strong>of</strong> all adult mpingo seen by <strong>the</strong> expedition means that any such analysis by plot characteristics is likely<br />
to be extremely sensitive to <strong>the</strong> conditions in that one plot.<br />
The distance to <strong>the</strong> nearest competitor <strong>of</strong> different size classes was not found to be a significant<br />
determinant <strong>of</strong> tree size at Migeregere, <strong>and</strong> this result was repeated with <strong>the</strong> data collected on this<br />
expedition.<br />
Harvestable Timber<br />
The Estimated Straight Length varied from 0 to 5m. Figure 7 is analogous to Figure 6 in showing <strong>the</strong><br />
variation in ESL between different plot types, <strong>and</strong>, given <strong>the</strong> highly skewed size structure, exhibits <strong>the</strong><br />
expected exponential decline in frequency <strong>of</strong> ESL above a certain threshold; 1.0m in this case.<br />
Following <strong>the</strong> terminology <strong>of</strong> Ball (2004) 54% <strong>of</strong> <strong>the</strong> adult mpingo were potentially harvestable at<br />
some point in <strong>the</strong> future, i.e. <strong>the</strong>y had an ESL >= 75cm, but only 6% (2 trees, both in burnt plots) were<br />
harvestable now, i.e. <strong>the</strong>y also had a CBH >= 70cm. This compares with 82% <strong>and</strong> 50% respectively at<br />
Migeregere. The extremely low number <strong>of</strong> trees harvestable now unfortunately makes <strong>the</strong> calculation<br />
<strong>of</strong> any statistics <strong>of</strong> harvestable worth almost meaningless, but for <strong>the</strong> sake <strong>of</strong> comparison <strong>the</strong> mean<br />
currently harvestable volume is 0.0075m³ ha -1 , which is less than 1% <strong>of</strong> <strong>the</strong> 1.03m³ ha -1 found at<br />
Migeregere.<br />
17 Except for tree height <strong>the</strong> st<strong>and</strong>ard error is greater than <strong>the</strong> mean <strong>of</strong> <strong>the</strong> measure indicating a highly variable data set<br />
skewed by some large outliers but o<strong>the</strong>rwise dominated by smaller trees.<br />
Page 18 <strong>of</strong> 31


